Contents
5. Statistics > Application Analytics
Objective
This guide explains the changes of Omada Controller from v5 to v6.
Requirements
Introduction
The objective of this document is to provide with a comprehensive, section-by-section mapping between Omada Controller version 5.x and the re-architected 6.0 user interface.
Release 6.0 introduces a hierarchical re-organization of all monitoring, configuration and reporting functions. Numerous legacy pages have been relocated, consolidated or renamed to improve navigational consistency and to align device-centric data with the devices themselves. Consequently, familiar menu paths from earlier versions may no longer resolve the expected location.
The guidance that follows presents every legacy module, sub-module and widget in its original order, accompanied by the precise navigation path required to access the equivalent capability in version 6.0. Use this reference to accelerate the transition to 6.0 and to ensure continuity of operational tasks.
Configuration
1. Home
The former “Home” page no longer exists as a top-level module.
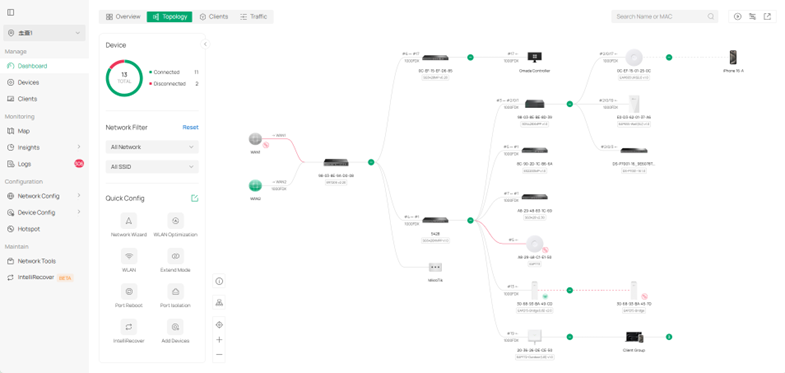
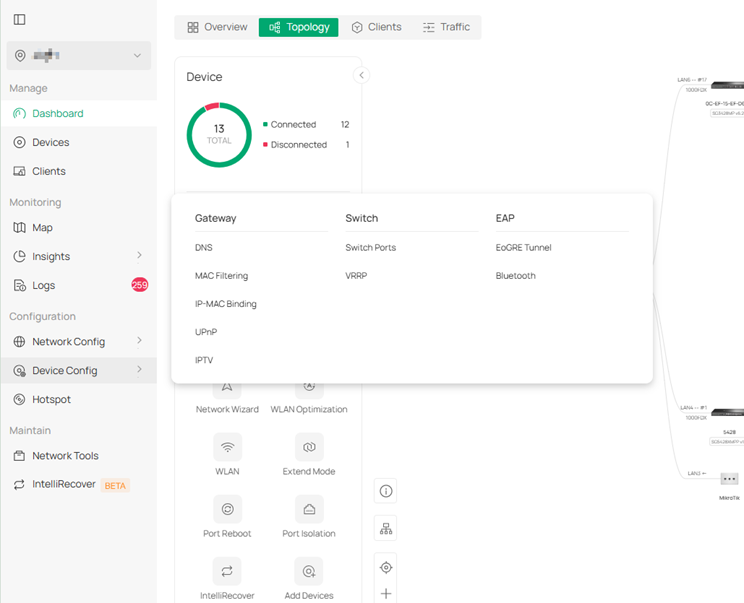
- All former Home widgets are now located inside Dashboard > Topology.
- When users log in, they land on Dashboard-Overview; the Topology tab delivers the old Home experience.
2. Dashboard
The legacy custom-widget designer has been removed. You can customize the chart in Insights > Reports
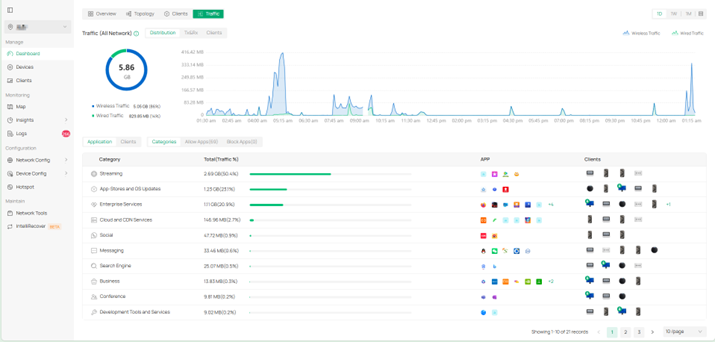
The new Dashboard is divided into four fixed tabs:
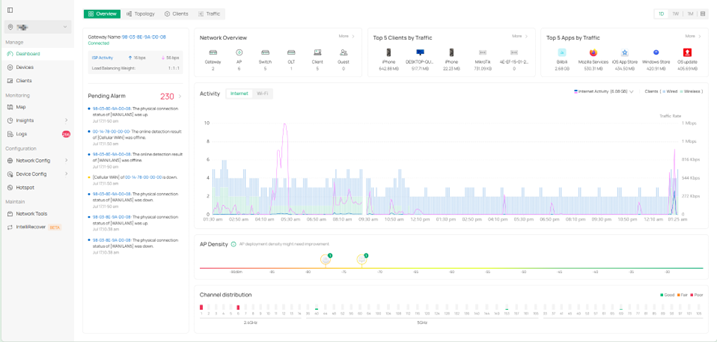
- Overview – site-wide KPIs
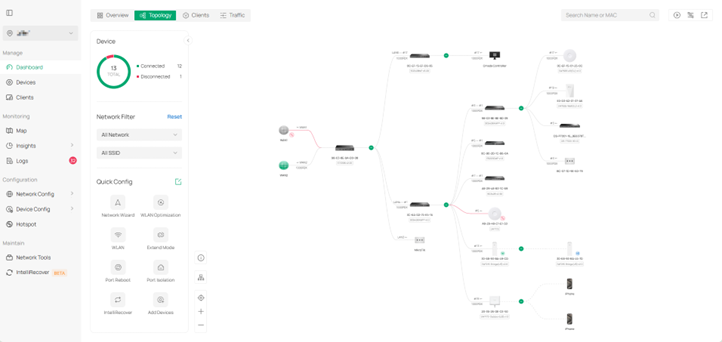
- Topology – network map, device status and alarms (inherits Home)
- Clients – summary of online/offline/blocked clients
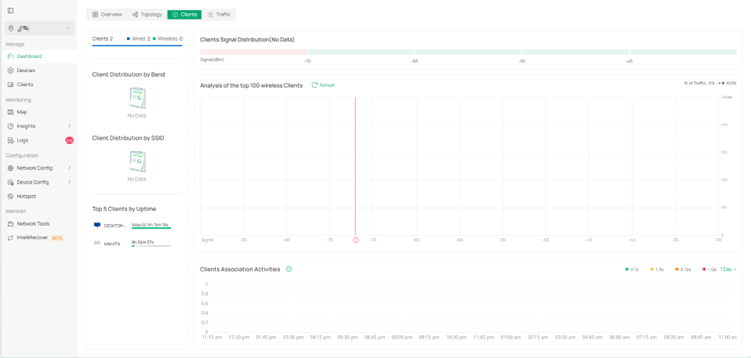
- Traffic – site-level traffic statistics
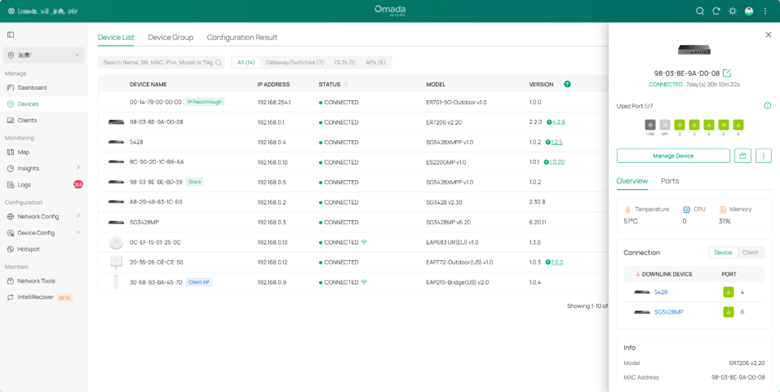
3. Device Details
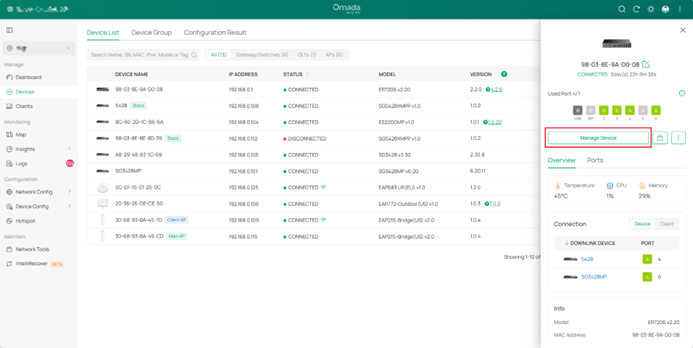
Formerly the details page was only a drawer that contained full monitoring and configuration.
In 6.0:
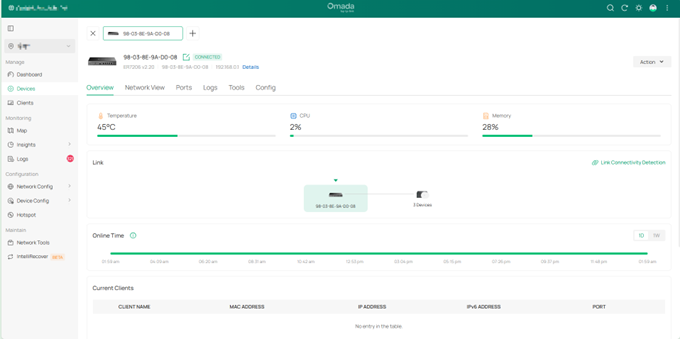
- Clicking a device row opens a drawer that shows basic properties and quick actions (Upgrade, Move, etc.).Inside the drawer, press “Manage Device” to open the full-detail page where the complete config lives.
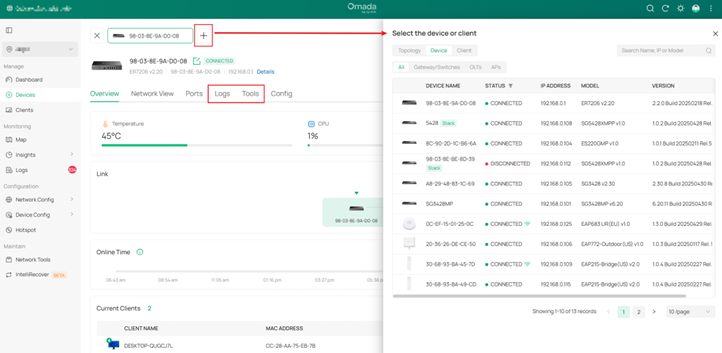
- You can continue to click “Add” (top-right) on any full page to open additional devices; they appear as side-by-side tabs. And the Log and Tools tabs have been added to troubleshooting of individual devices.
3.1 Gateway
- Drawer view – two modules only: Overview (basic info) and Port (WAN port list).
- Full page – all legacy monitoring plus complete configuration (routing, VPN, DNS, etc.).
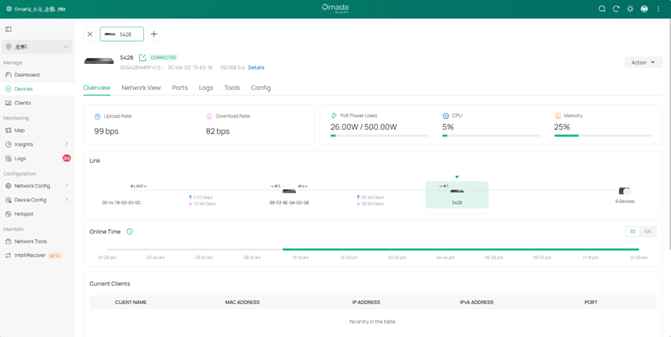
3.2 Switch
- Drawer view – basic info, up-/down-link devices, quick actions.
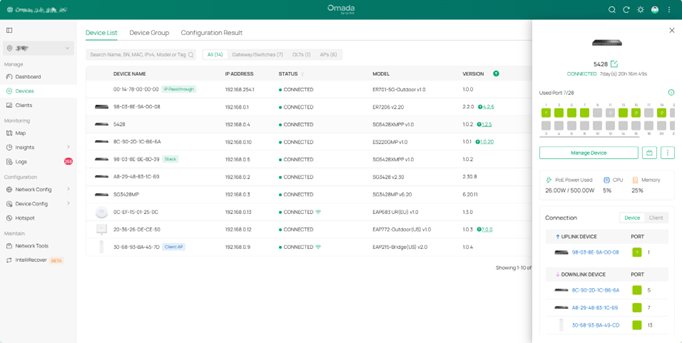
- Full page – full port table, PoE, VLAN, STP, LAG, routing, etc.
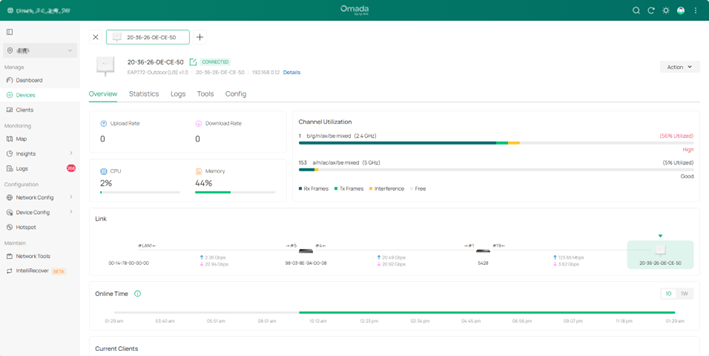
3.3 AP
- Drawer view – basic info, uplink device, quick actions.
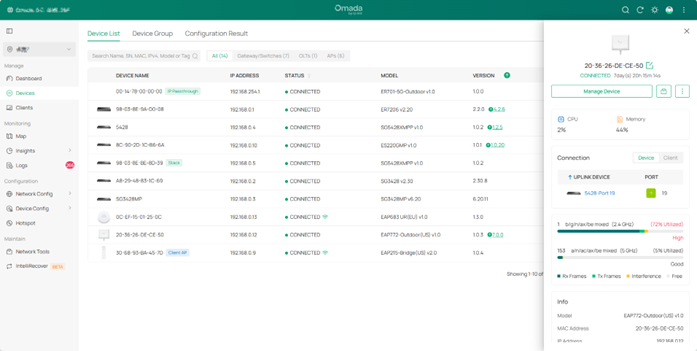
- Full page – radios, SSIDs, mesh, client history, RF statistics, advanced radio profiles.
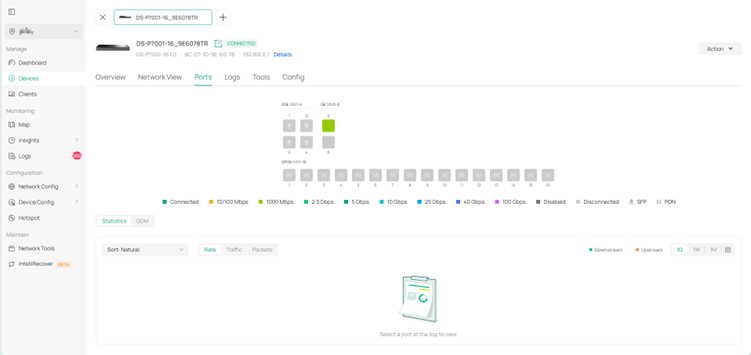
3.4 OLT
- Drawer view – OLT base info, ONU count, quick actions.
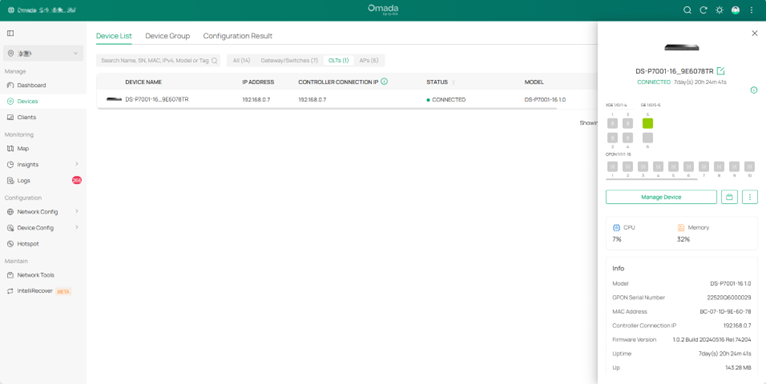
- Full page – PON ports, DDM, ONUs list, VLAN, multicast, QoS.
3.5 Stack
- Drawer view – list of members, base info, up-/down-links, quick actions.
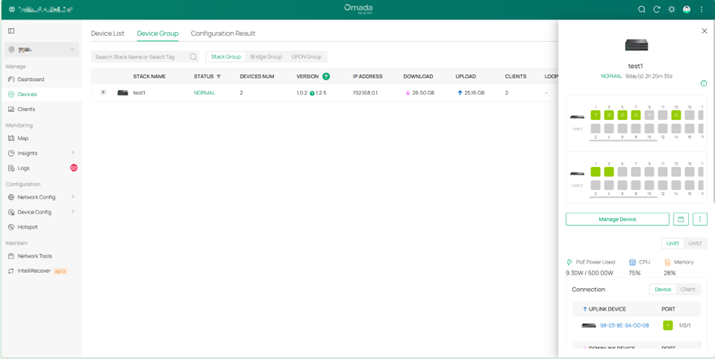
- Full page – stack topology, port statistics, VLAN, STP, LAG, routing per member.

4. Statistics > Performance
4.1 Gateway
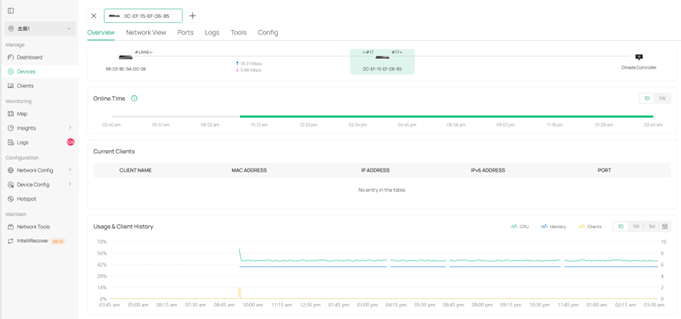
- User Counts & Usage → merged and moved to Gateway details > Overview > Usage & Client History chart.
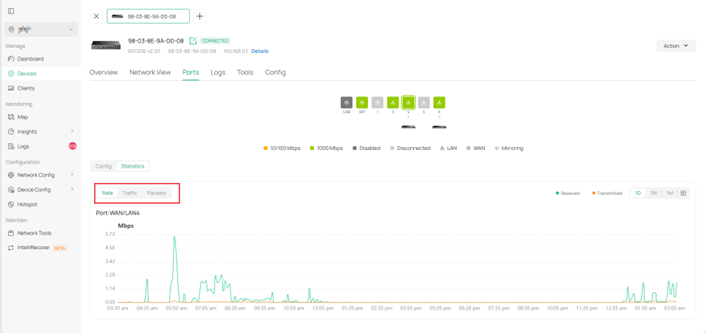
- Traffic & Packets → split into Rate / Traffic / Packets and moved to Gateway details > Port > Statistics.
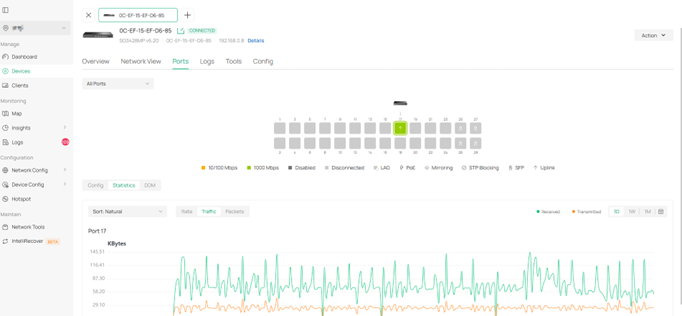
4.2 Switch
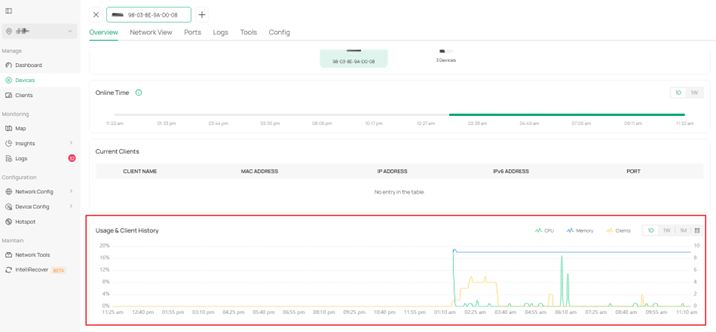
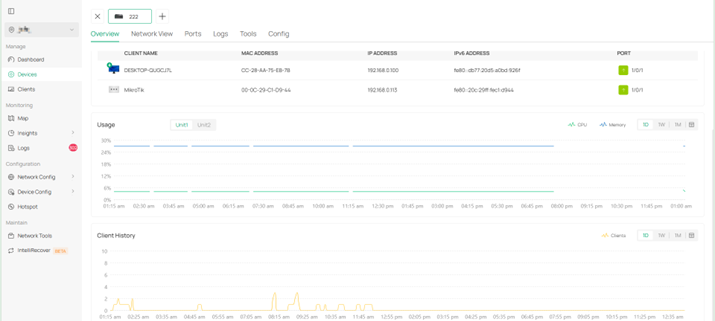
- User Counts & Usage → merged and moved to Switch details > Overview > Usage & Client History.
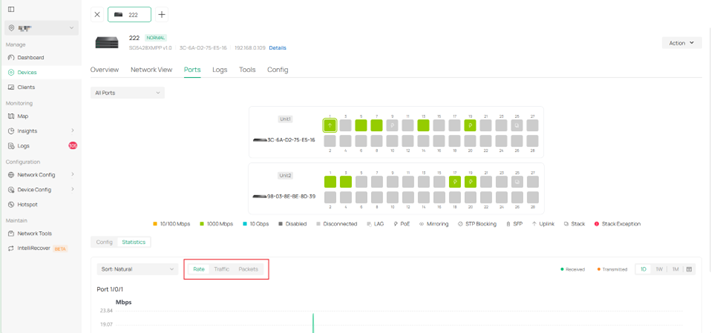
- Port Rate/Traffic/Packets → moved to Switch details > Ports > Statistics.
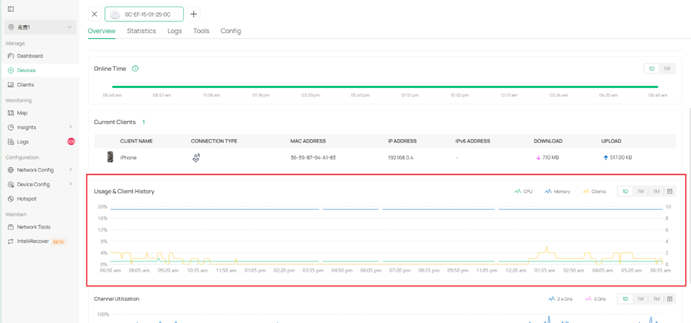
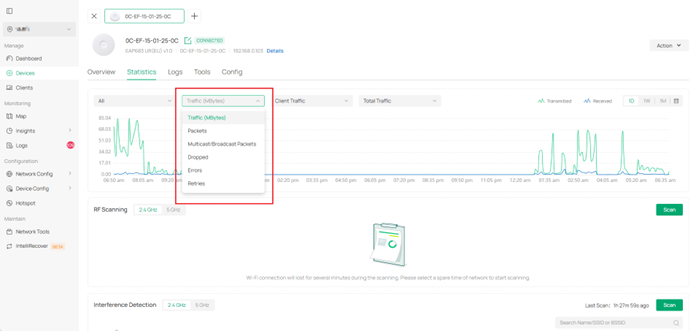
4.3 AP
- User Counts & Usage → merged into AP details > Overview > Usage & Client History.
- Traffic / Packets / Multicast / Broadcast / Dropped / Errors / Retries → moved to AP details > Statistics.
4.4 OLT
- ONU Counts, Usage, Traffic → split into Traffic and Usage & ONU Counts inside OLT details > Overview.
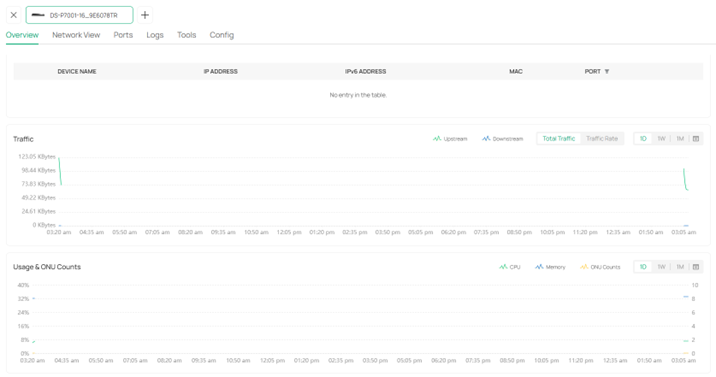
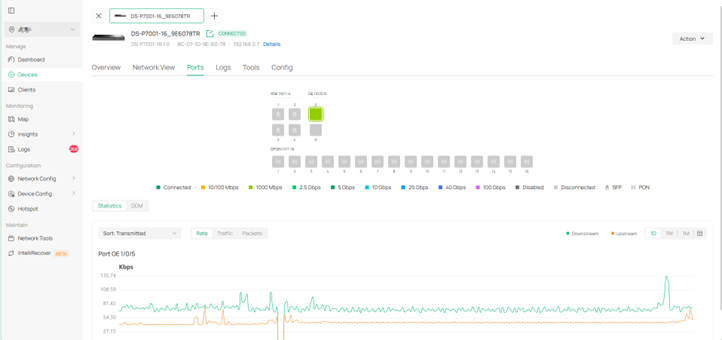
- DDM info and port Rate/Traffic/Packets → moved to OLT details > Ports > Statistics.
4.5 Stack
- User Counts & Usage → moved to Stack details > Overview.
- Port Information → moved to Stack details > Port > Statistics.
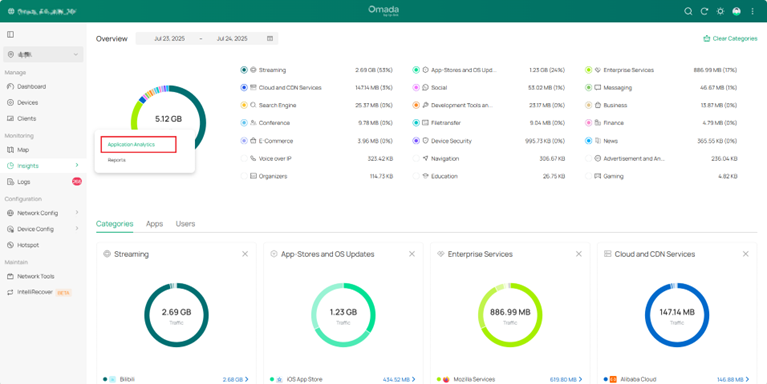
5. Statistics > Application Analytics
The entire page has been relocated to Insight > Application Analytics (now under the new Insight menu).
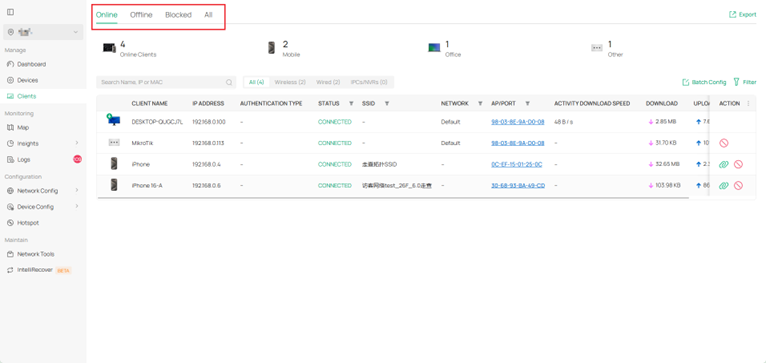
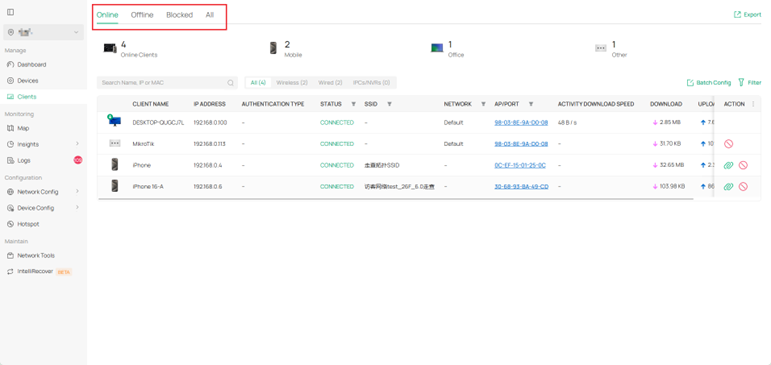
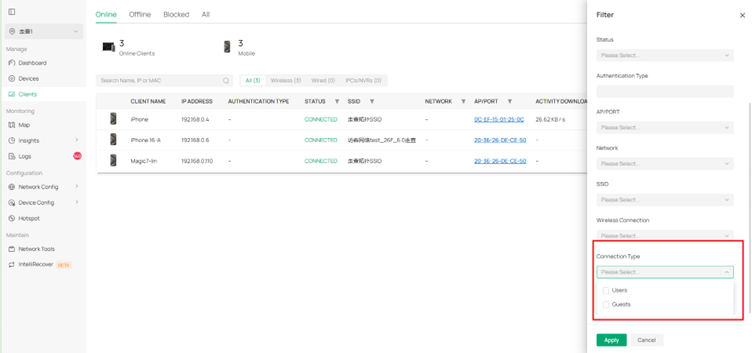
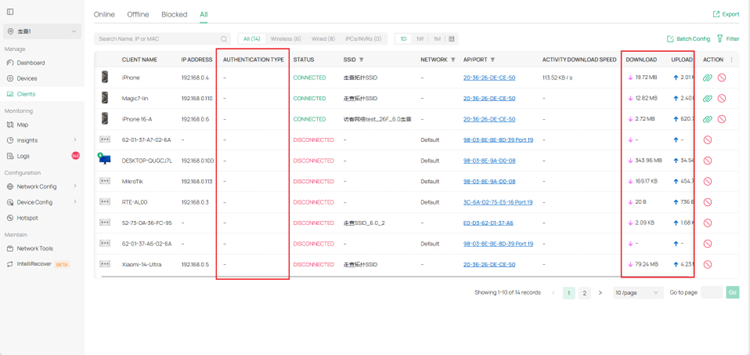
6. Clients
New filter tabs added: Online, Offline, Blocked. Each state has its own view; the legacy single list still exists as “All Clients”.
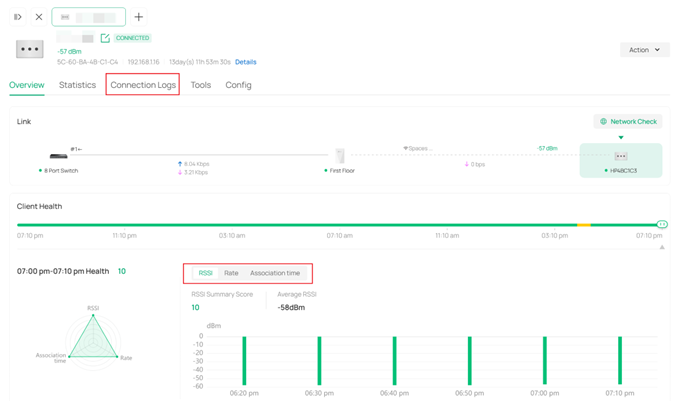
Added RSSI, Rate, and Association Time trend charts and the Connection Log tab to the client details page.
7. Insight
The Insights module was removed in 6.0, and the modules within it were migrated independently.
All sub-features have been moved as follows:
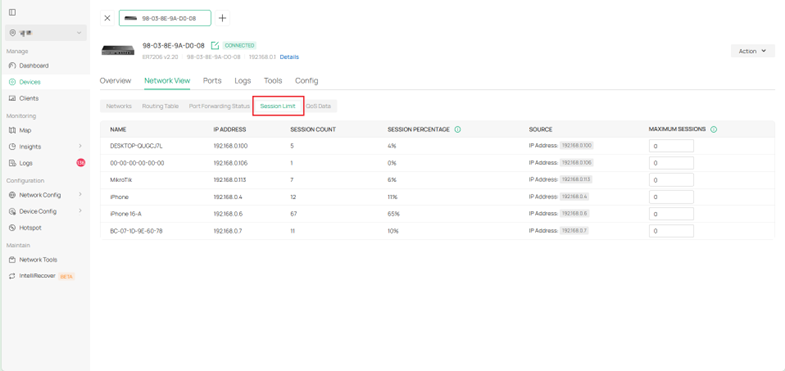
7.1 Session Limit
Relocated to Gateway details > Network View > Session Limit.
7.2 Known Clients
Now part of Clients module.
7.3 Past Connection
Merged into Clients module.
7.4 Past Portal Authorization
Data columns now appear inside Clients. And you can also find them in Hotspot > Authorized Clients.
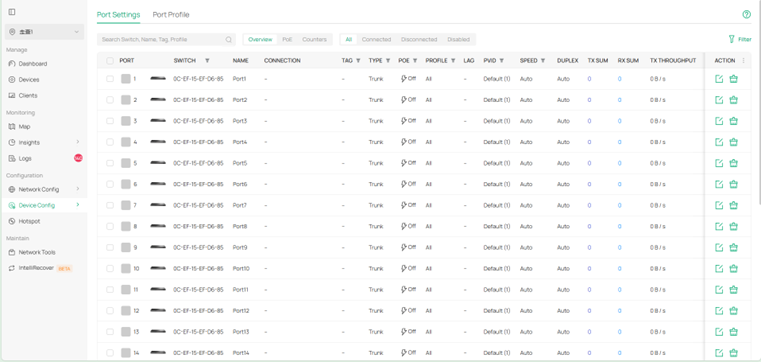
7.5 Switch Status
Moved to Device Config > Switch > Switch Ports; adds bulk-edit and column filtering.
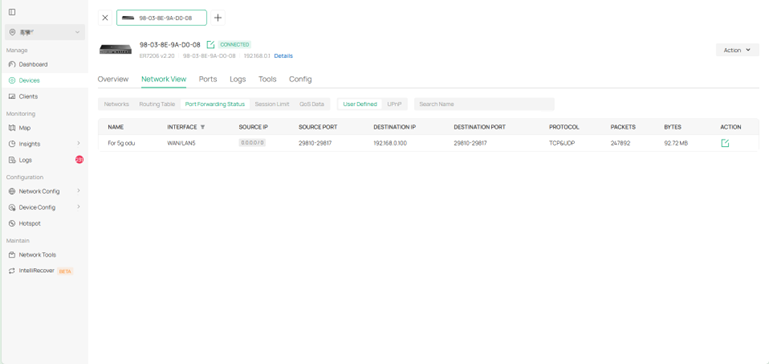
7.6 Port Forwarding Status
Moved to Gateway details > Network View > Port Forwarding.
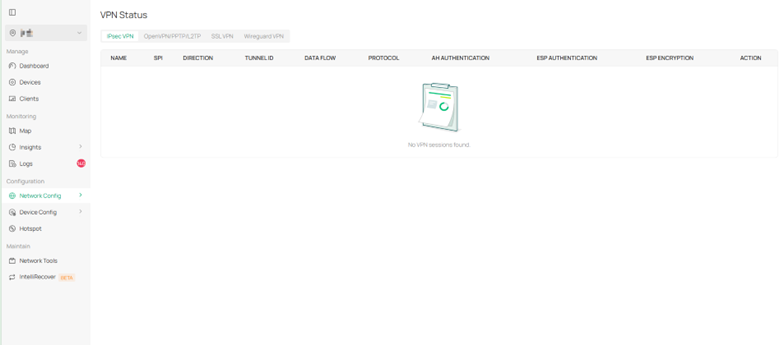
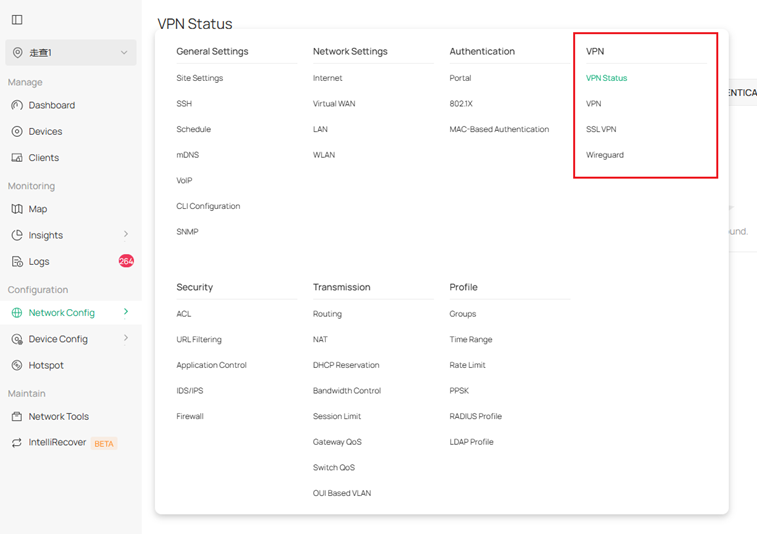
7.7 VPN Status
New top-level page: Network Config > VPN > VPN Status.
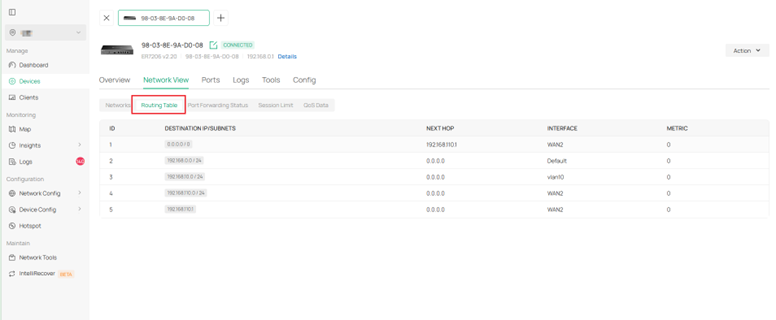
7.8 Routing Table
Moved to Gateway details > Network View > Routing Table.
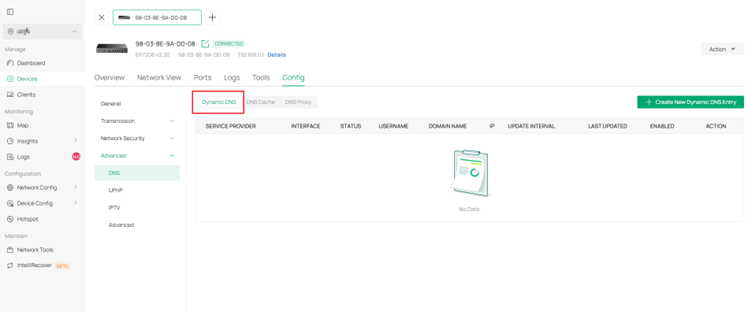
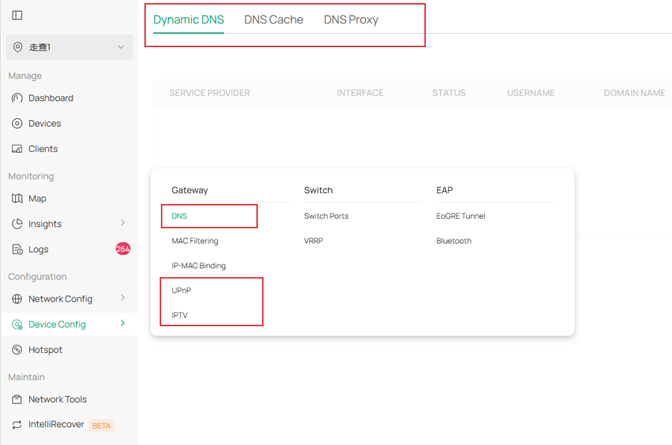
7.9 Dynamic DNS
Moved to Gateway details > Config > Advanced > DNS > Dynamic DNS.
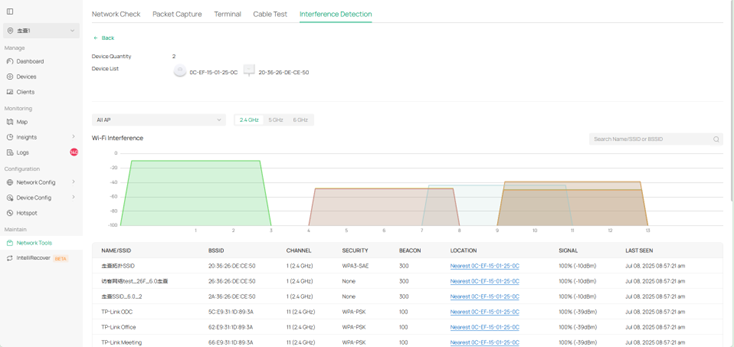
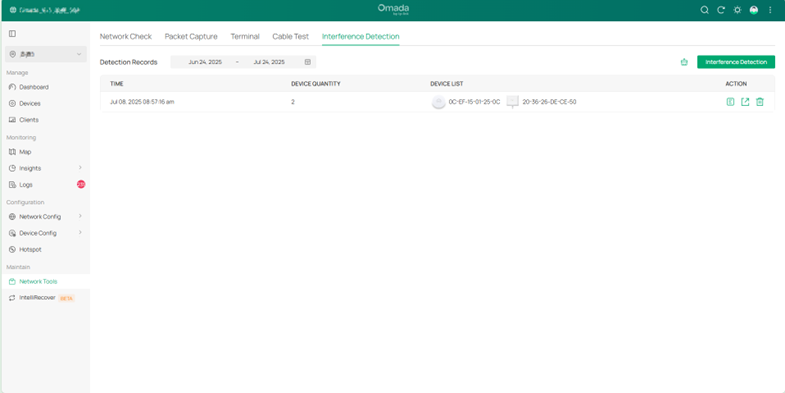
7.10 Rogue APs
Renamed Interference Detection and placed under Network Tools; keeps scan history and adds Wi-Fi Interference chart. (In version 6.0, only the EAP787 model supports displaying the Wi-Fi Interference chart).
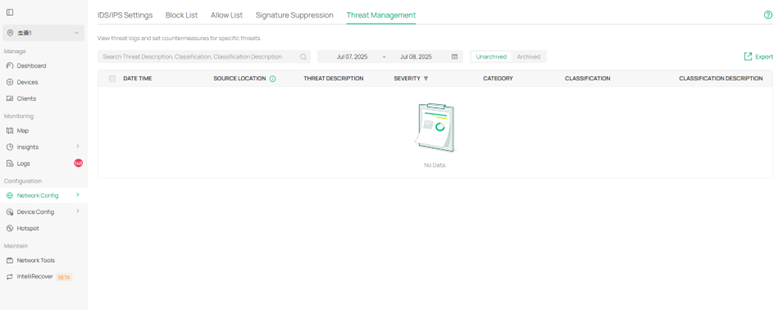
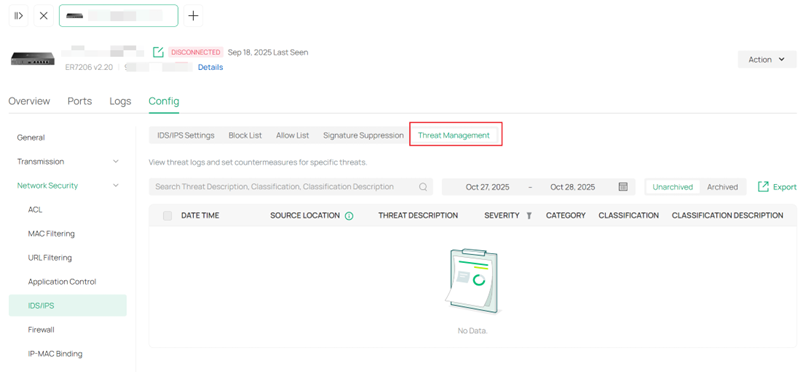
7.11 Threat Management
Moved to Network Config > Security > IDS/IPS > Threat Management and Gateway Detail > Config > Network Security > IDS/IPS.
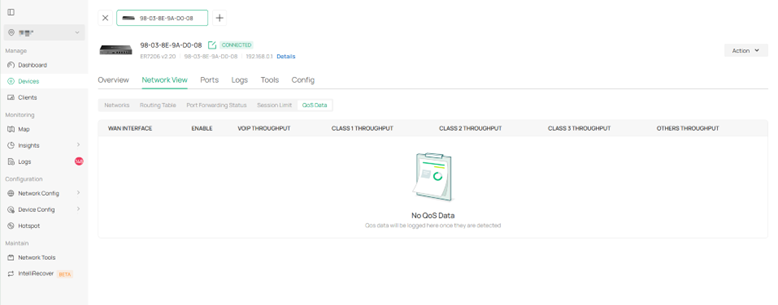
7.12 QoS Data
Moved to Gateway details > Network View > QoS Data.
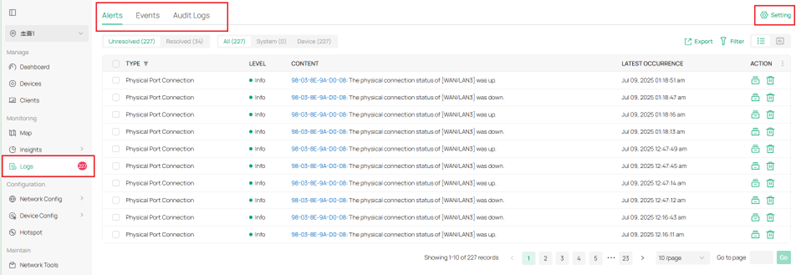
8. Logs & Audit Logs
Former two separate modules are now a single Logs module. All log-related settings (syslog, email) are gathered here.
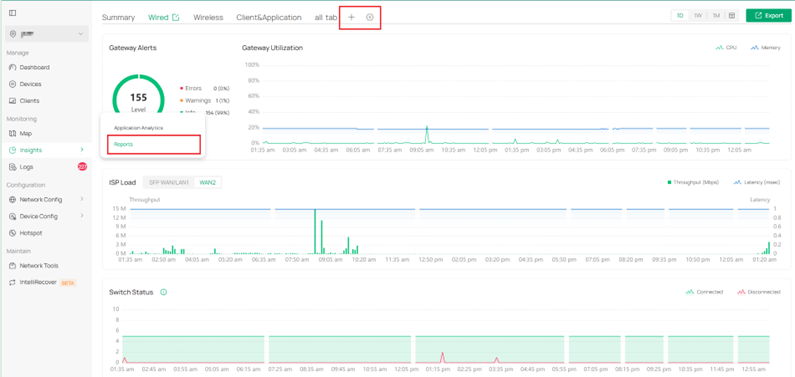
9. Reports
Legacy Reports page is now inside Insight > Reports; UI refreshed and users can create custom views.
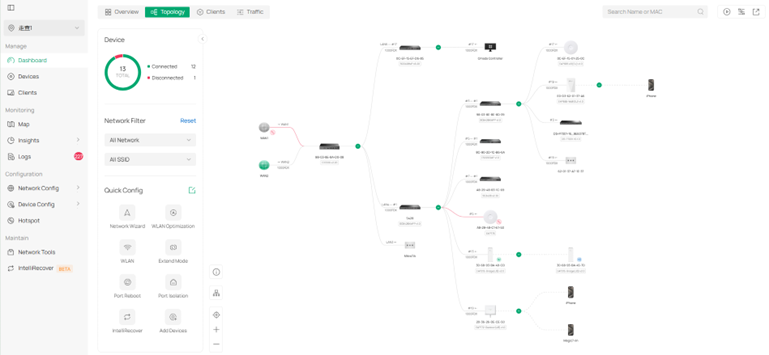
10. Map > Topology
Relocated to Dashboard > Topology; extra monitoring badges and filter controls added.
11. Network Tools
Keeps all legacy tools; adds Interference Detection (evolved from Insight > Rogue APs).
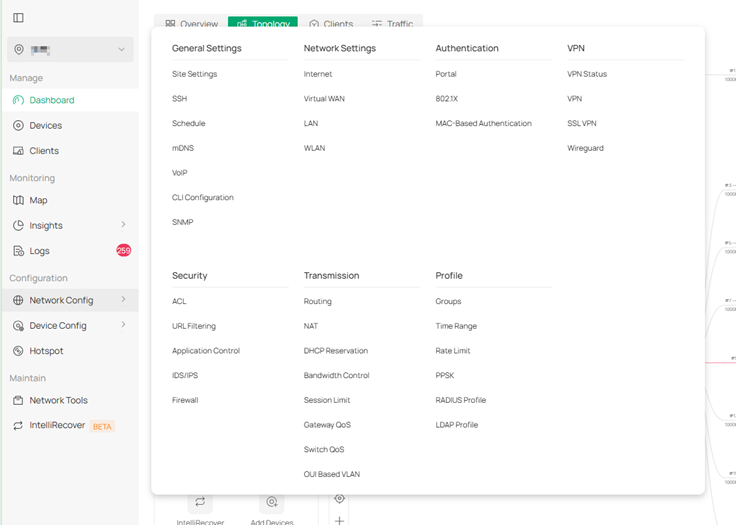
12. Settings
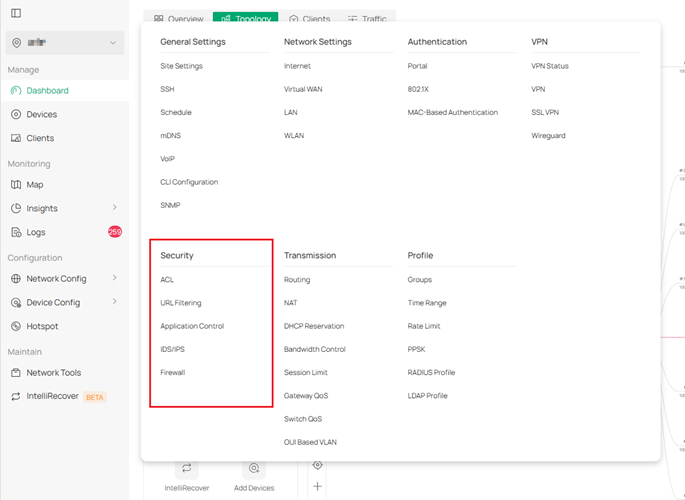
The former flat Settings tree is now grouped into two top-level buckets:
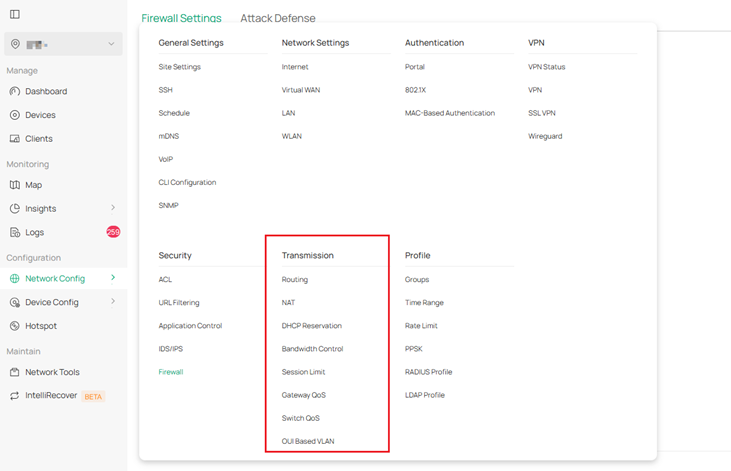
- Network Config – General Settings,Network Settings,Authentication,VPN,Security,Transmission,Profile
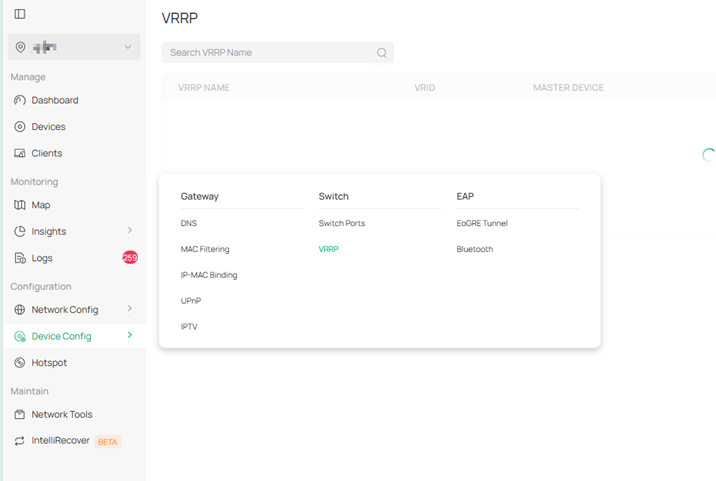
- Device Config – Gateway,Switch,EAP
Detailed relocations
12.1 Wired & Wireless Network →Network Config > Network Settings (content unchanged).
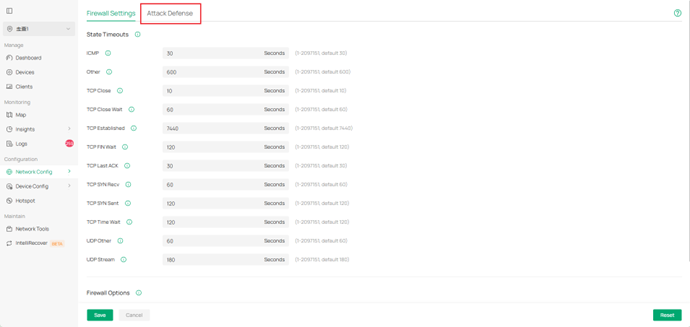
12.2 Network Security →Network Config > Security.
Attack Defense merged into Firewall.
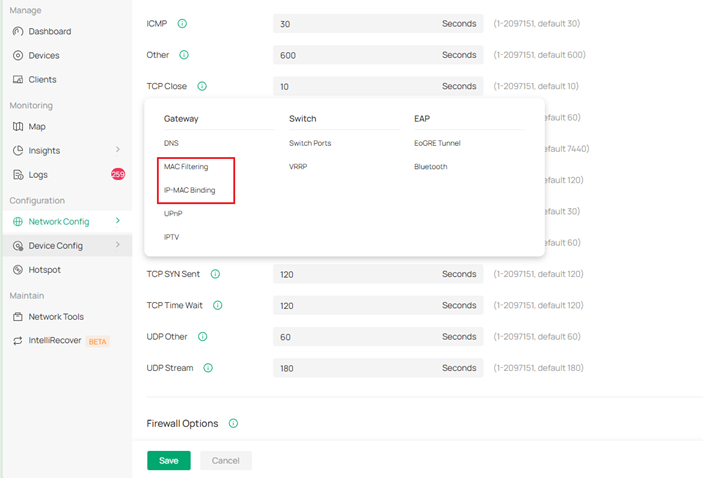
MAC Filtering & IP-MAC Binding moved to Device Config > Gateway.
12.3 Transmission →Network Config > Transmission.
VRRP moved to Device Config > Switch.
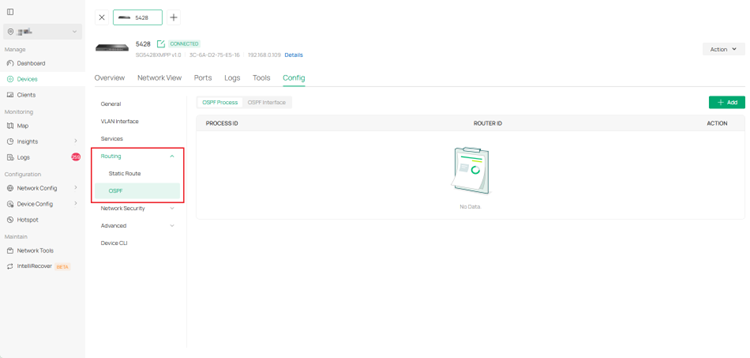
Switch OSPF moved to Switch details > Config > Routing; new OUI-Based VLAN added.
12.4 VPN → renamed Network Config > VPN; plus new VPN Status page.
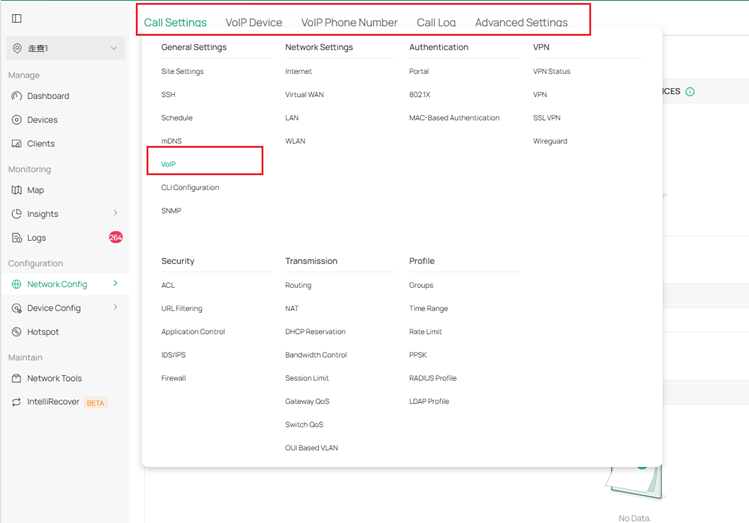
12.5 VoIP module removed; single VoIP toggle now under Network Config > General Settings > VoIP.
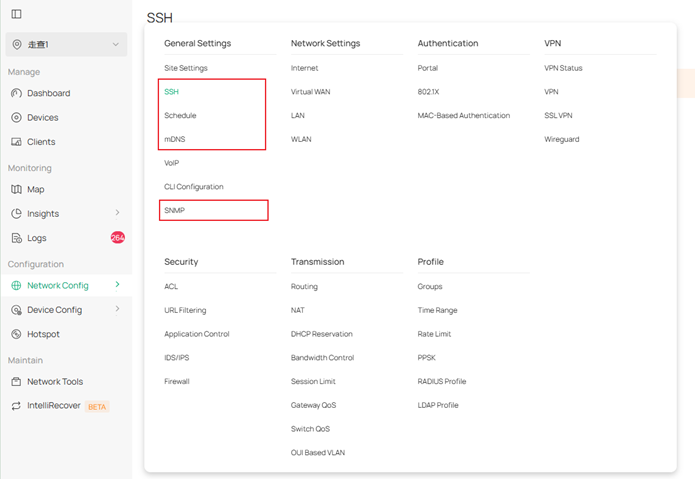
12.6 Services module removed:
– SSH, Reboot Schedule, Port Schedule, mDNS, SNMP → Network Config > General Settings (Reboot & Port Schedule merged into Schedule)
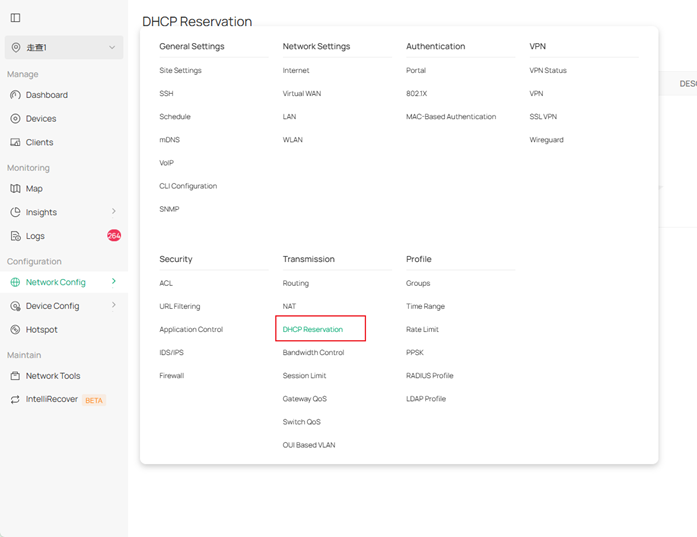
– DHCP Reservation → Network Config > Transmission
– Dynamic DNS, DNS Proxy, DNS Cache, UPnP, IPTV → Device Config > Gateway (first three merged into DNS)
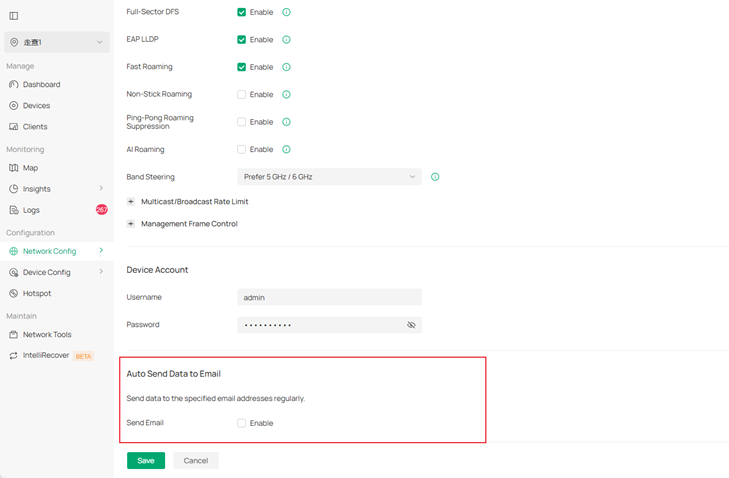
– Auto Send Data to Email → Network Config > General Settings > Site Settings
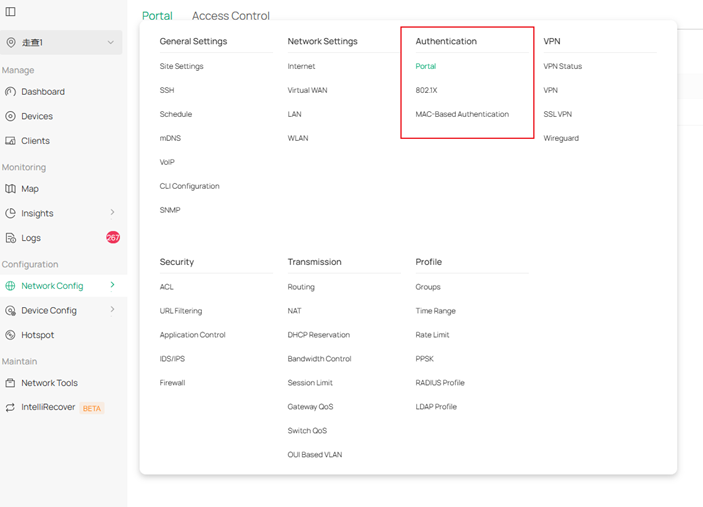
12.6 Authentication →Network Config > Authentication
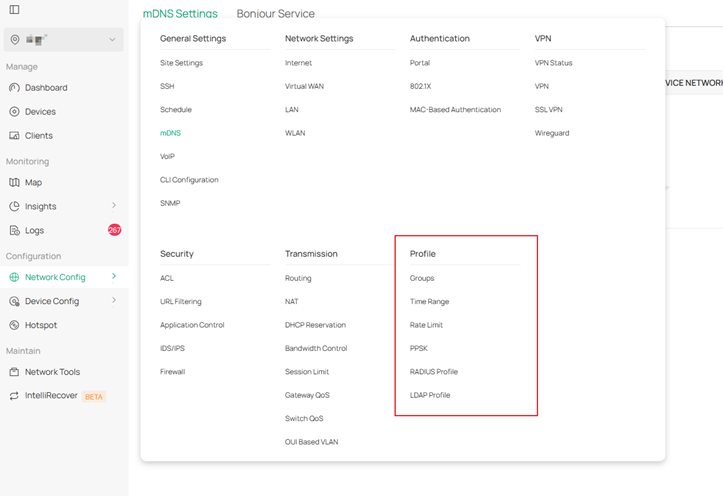
12.7 Basic Profile & Network Profile combined into Network Config > Profile.
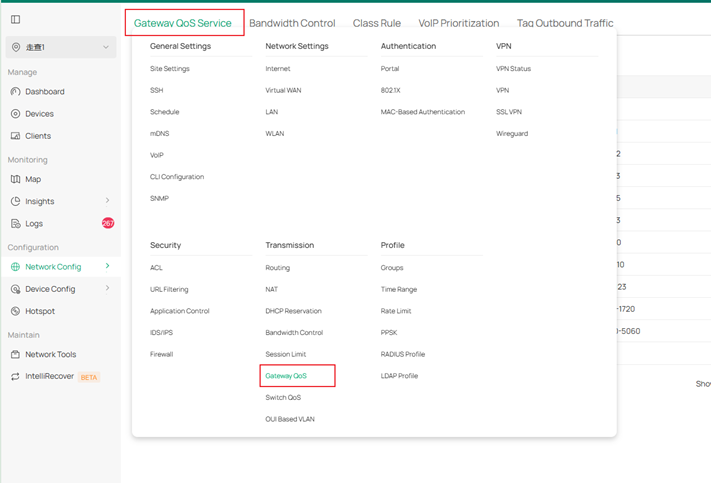
Gateway QoS Service merged into Network Config > Transmission > Gateway QoS.
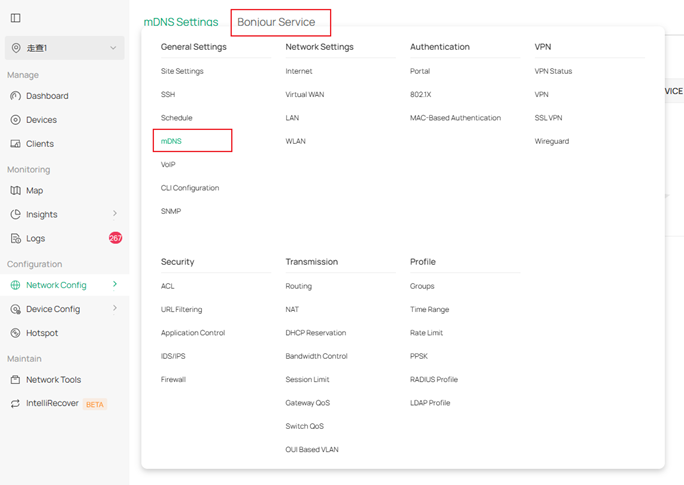
Bonjour Service merged into Network Config > General Settings > mDNS.
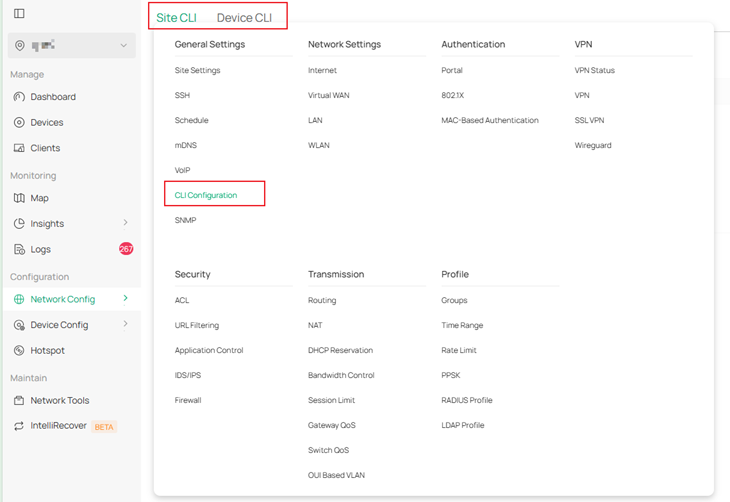
12.8 CLI Configuration removed; Site CLI & Device CLI combined and placed under Network Config > General Settings > CLI Configuration.