


Contents
Introduction
A Fusion Gateway is a single-site device that combines the gateway and the controller of its site, so every Fusion Gateway that is bound to a cloud account appears in Omada Cloud Portal as one site, with its own WAN links.
Site Monitor is a new feature of the Fusion system page in Omada Cloud Portal, introduced in Controller 6.4. It collects the WAN link quality of all Fusion sites of the account into one view: the state of each link, the WAN health score, the average latency, the WAN jitter, and the packet loss, together with a trend chart for the selected period. A link that degrades in one site can therefore be found without opening the sites one by one.
Because a Fusion Gateway is a single site, the statistics of a site are the statistics of that gateway. Each WAN port reports on its own, so a gateway that uses three WAN ports contributes three sets of values, one for each link, and the difference between the links of the same gateway becomes visible.
This article describes what Site Monitor shows, how to check it for a group of Fusion sites that are bound to the same account, and how to read the table and the trend chart.
Requirements
- Omada Fusion Gateway
- Omada Fusion Pro Gateway
- Omada Cloud Portal
Site Monitor also requires the conditions below, which the Config Requirements tab of the page lists:
- Organization type: Omada Fusion Systems.
- Version: Fusion Systems v4.1.0 or later.
- Status: the organization must be online.
- Cloud Access: must be enabled.
Accessing Site Monitor
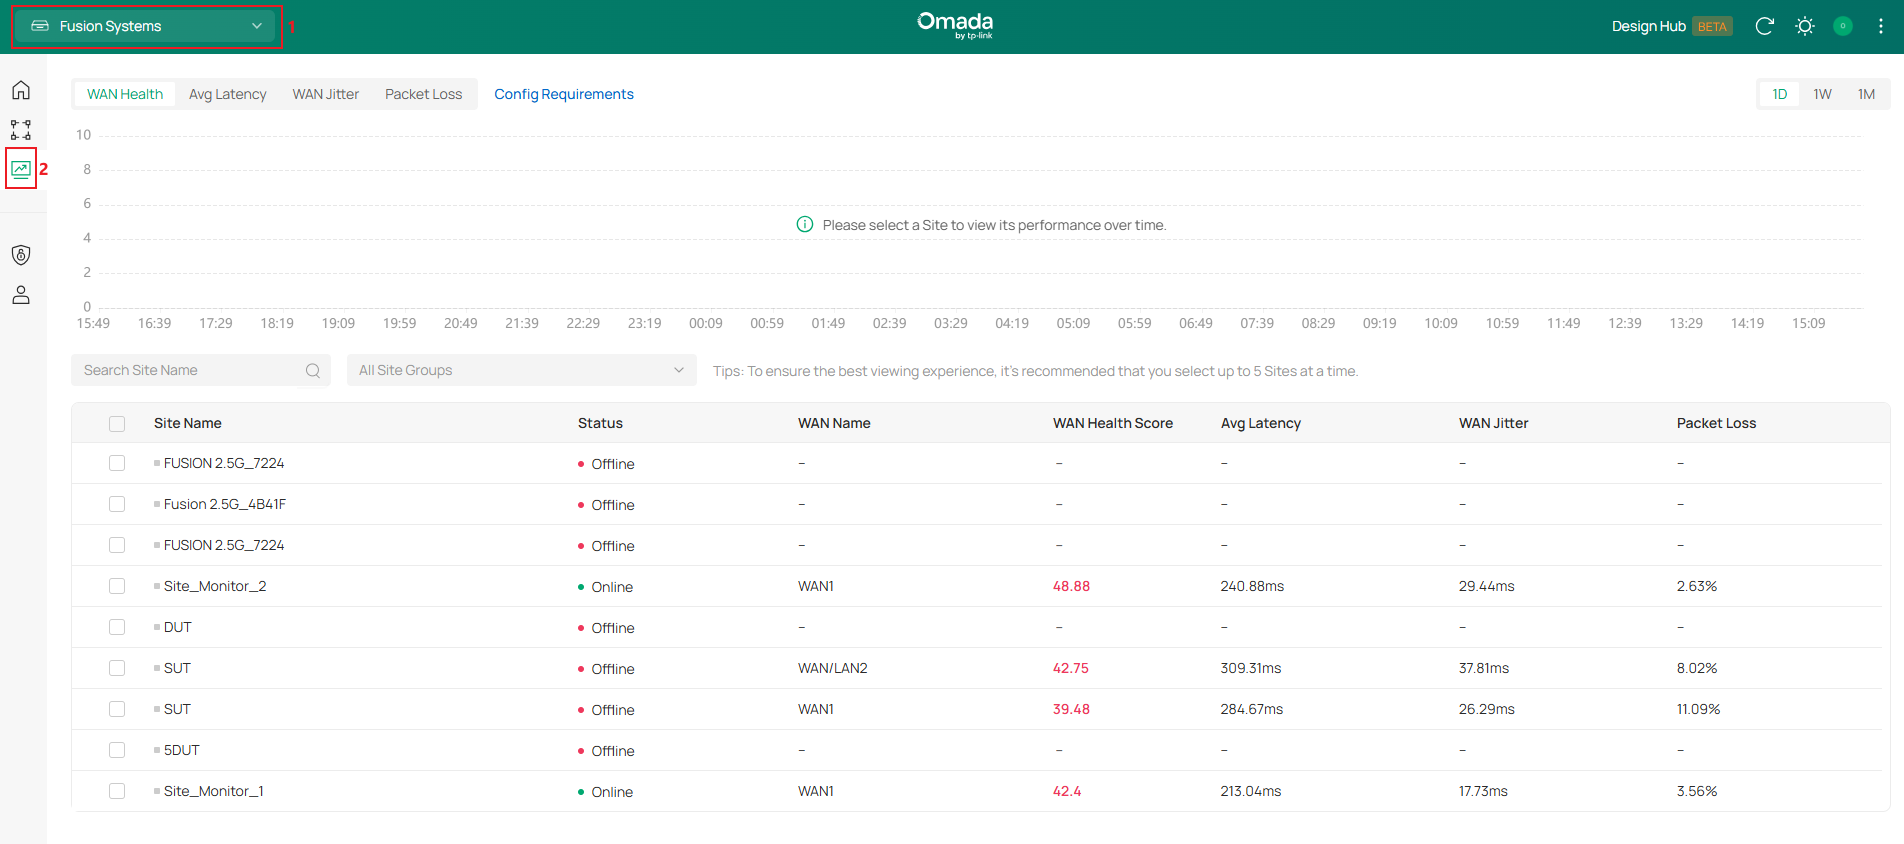
Step 1. Access Site Monitor.
After adding Fusion Gateways to the same account, go to Omada Cloud Portal, select Fusion Systems, and click Site Monitor to open the Site Monitor panel.
Step 2. Select WAN links to monitor.
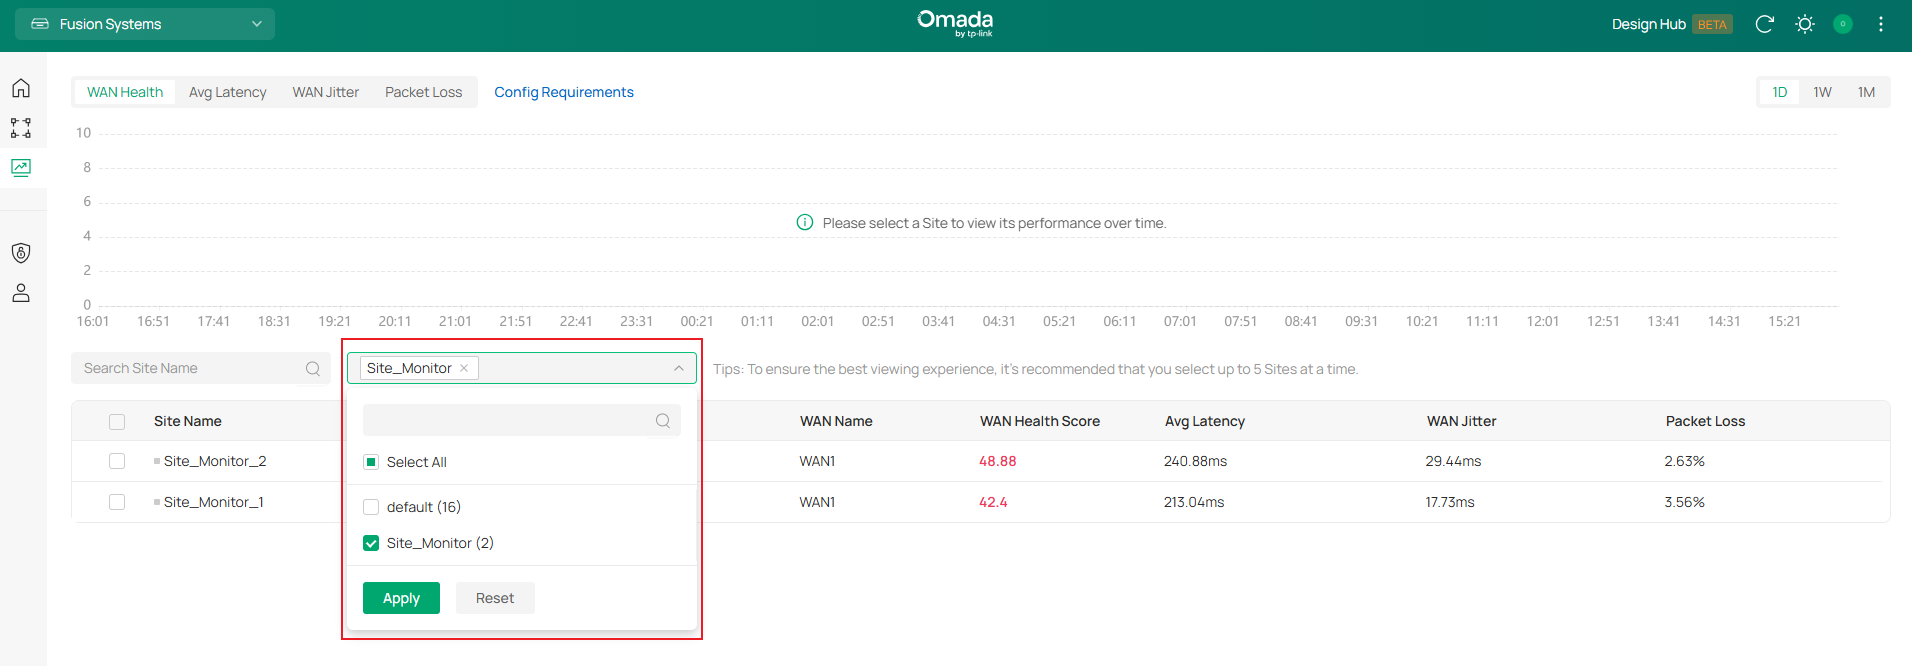
Each WAN link of a site generates an individual entry. Select the desired WAN links to display their performance data in the trend chart.
For better visibility, it is recommended to select no more than five WAN links at the same time. Each selected WAN link is represented by a different color. Historical data can also be displayed for offline sites when data is available for the selected time range. 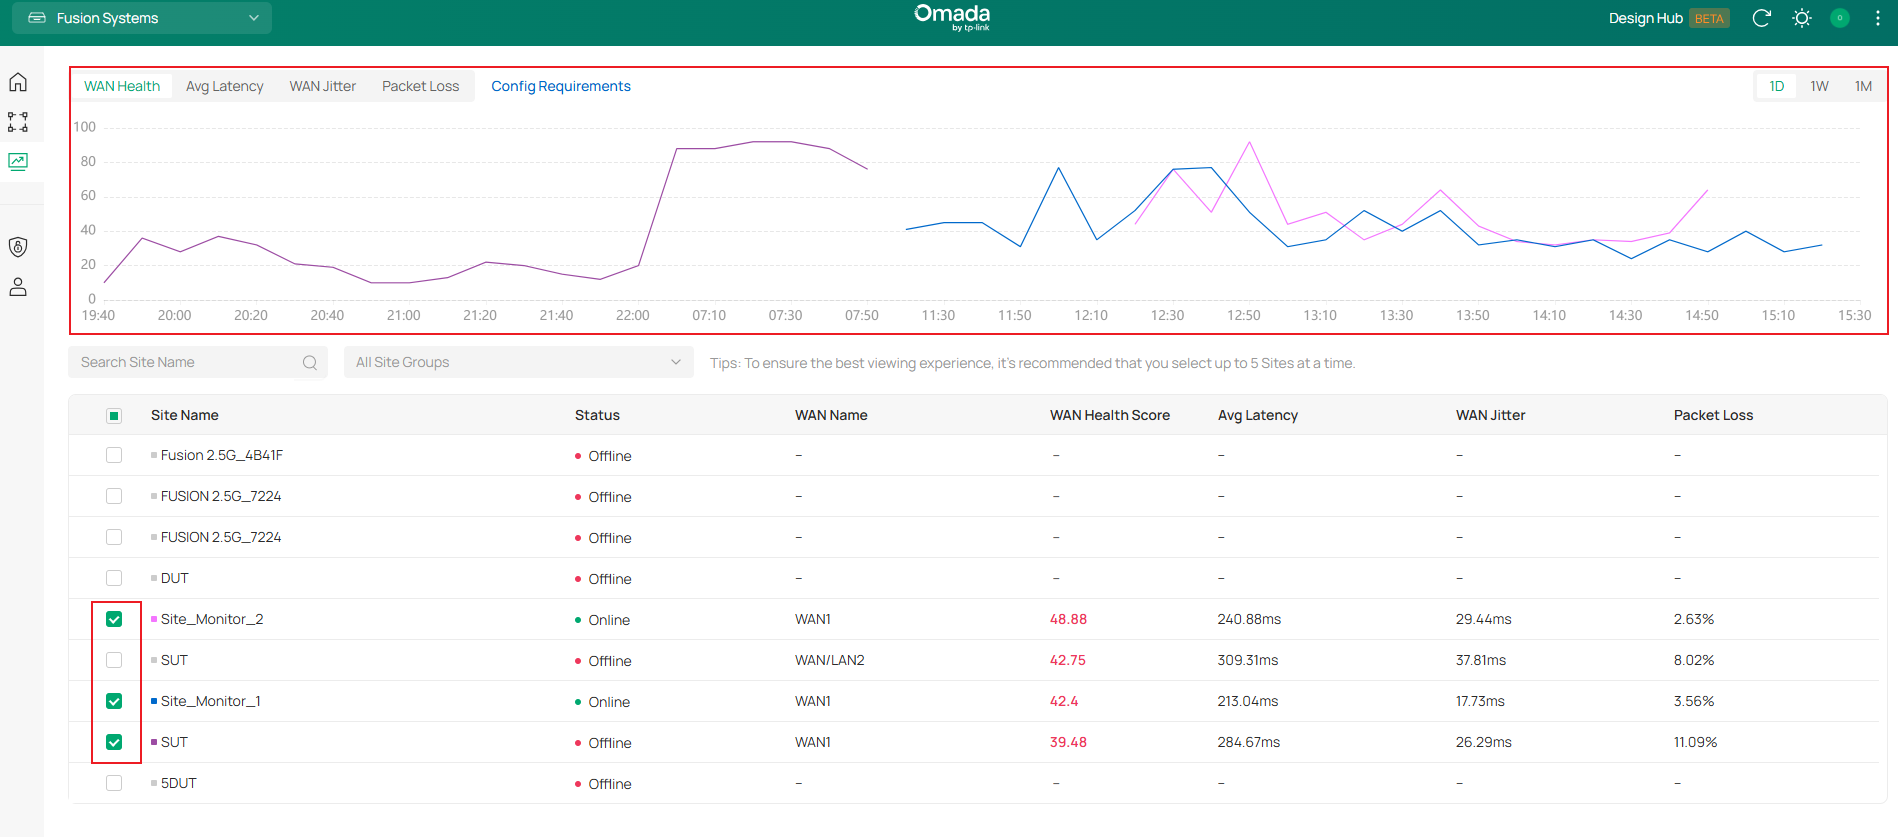
Step 3. Select metrics and a time range.
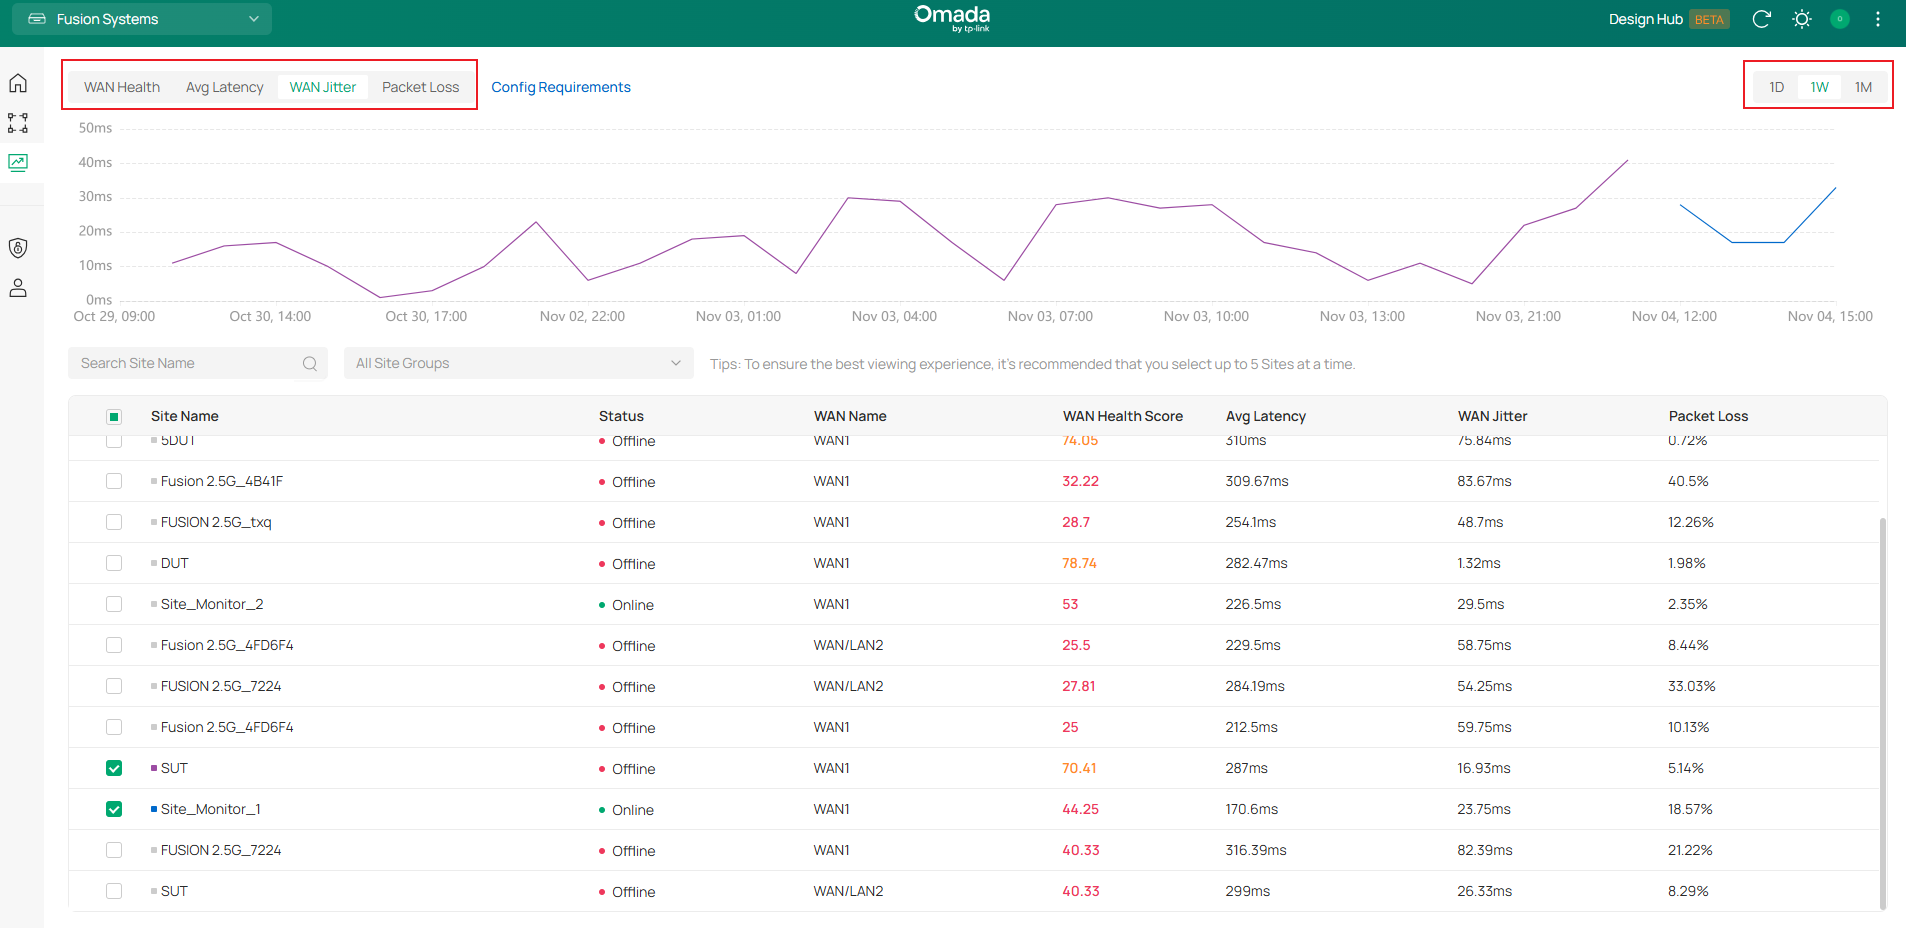
Select a metric tab to view different types of WAN performance data. A time range can also be selected to analyze performance trends over different periods.
Step 4. Filter sites.
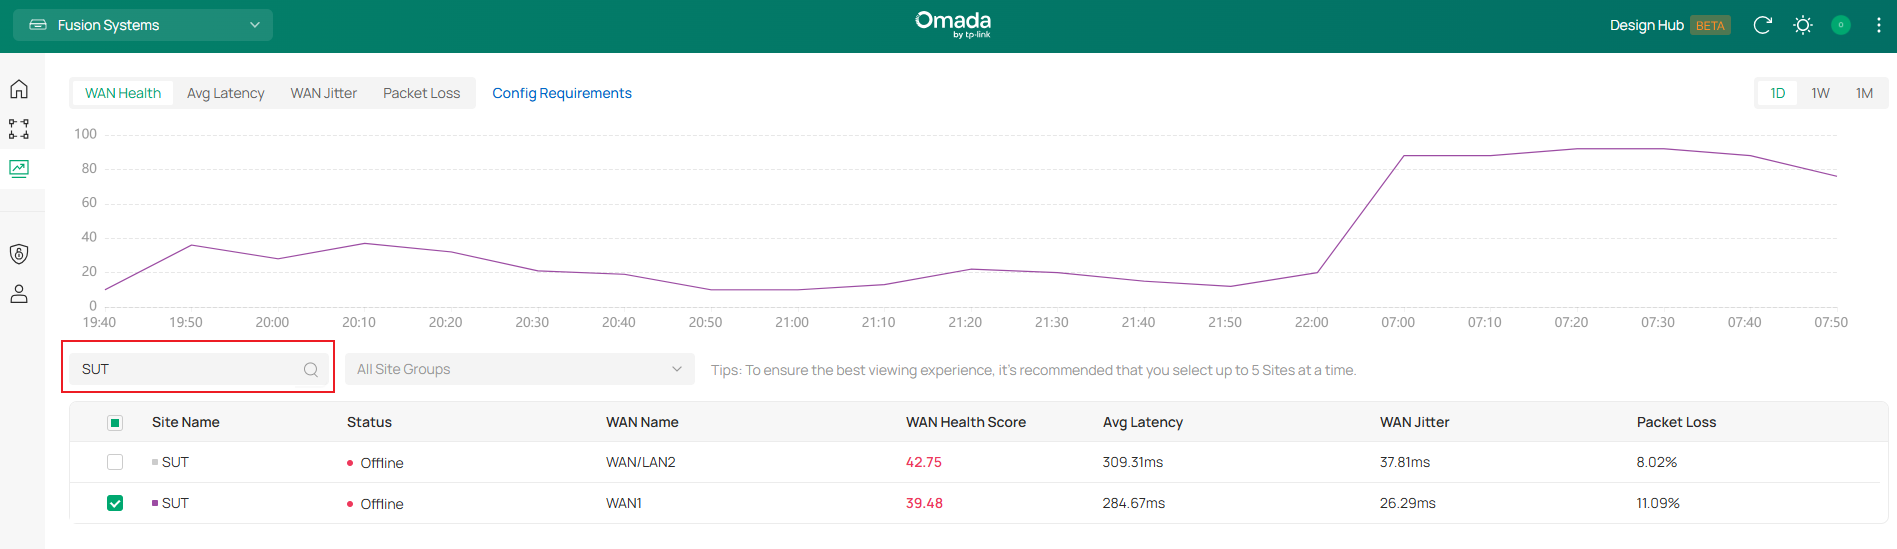
To narrow the results to specific sites, search by Site Name or filter by Site Group.
What Site Monitor shows
Site Monitor provides a centralized view for monitoring WAN link quality across Fusion sites. The page includes metric tabs, time-range controls, Site Name and Site Group filters, a trend chart, and a table showing individual sites and WAN links.
Metric tabs
The metric tabs allow different WAN performance indicators to be viewed. Corresponding values are also displayed for the WAN links in the site table.
|
Tab |
What it shows |
|
WAN Health |
The overall quality of the link, as a score from 0 to 100. A higher score means a healthier link, and the value falls when the latency, the jitter, or the packet loss rise |
|
Avg Latency |
The average time that the traffic needs to travel over the link and back |
|
WAN Jitter |
How much the latency varies between measurements. A steady link has a low jitter |
|
Packet Loss |
The share of the traffic that does not reach the far end of the link |
|
Config Requirements |
The conditions that the organization must meet before the page collects data, which are listed in Requirements |
Note: The WAN Health score is calculated based on latency, jitter, and packet loss. If the score is low, check these three metrics to identify the factor contributing to the degraded link health.
Time range
The 1D, 1W, and 1M options set the monitoring period to one day, one week, or one month respectively. The trend chart updates according to the selected period and displays a separate line for each selected WAN link.
A gap in a trend line indicates that no data was reported for that WAN link during that period, such as when the site was offline.
Conclusion
Site Monitor turns the WAN quality of every Fusion site of an account into one table and one trend chart. A Fusion Gateway is a single site, so the sites of the view are the gateways themselves, and the WAN links of a gateway are read one by one, which makes a failing link visible next to the healthy links of the same device.
To learn more about each function and configuration, please visit Support Home to download or check the manual for your product.
QA
Q1: Which sites appear in Site Monitor?
A1: Only Fusion sites. Controller 6.4 provides Site Monitor for Omada Fusion Gateways, and a Fusion Gateway is a single site, so each gateway that is bound to the account appears in the list.
Q2: How does a gateway with several WAN ports appear?
A2: With one line for each WAN port in use. A gateway with three WAN ports shows three lines, and each line carries its own health score, latency, jitter, and packet loss.
Q3: Why does a WAN link show a dash instead of a value?
A3: A dash means that no data was reported for the WAN link during the selected period. This may occur when the link was down, the site was not connected to the cloud, or the first scheduled data report has not yet been received, this is usually less than 10 minutes after the Fusion was connected for first time.
Q4: Does Site Monitor change any setting on the gateways?
A4: No. Site Monitor is a read-only view that aggregates what the gateways report. The settings of a site stay on its own gateway.
Q5: Why does a Fusion Gateway appear in the portal but not in Site Monitor?
A5: Site Monitor lists only the sites that meet the conditions of its Config Requirements tab, and the version is the usual reason: the gateway must run Fusion Systems v4.1.0 or later, the organization must be of the Omada Fusion Systems type and online, and Cloud Access must be enabled. A gateway that is bound to another account does not appear in the portal at all, so the site list already shows that problem. When a Fusion Gateway first comes online in Omada Cloud Portal, it requires a short period to prepare and report its monitoring data. This process generally takes no more than 10 minutes. The site will appear in Site Monitor after the initial data preparation and reporting are complete.
Afterward, monitoring data is reported approximately once per hour. Each update includes the data points collected during the preceding reporting period. Therefore, the data displayed in Site Monitor may not reflect the gateway’s latest status immediately.
