


Contents
Introduction
sFlow (Sampled Flow) is a technology for accurately monitoring network traffic at high speeds. The sFlow monitoring system consists of a sFlow agent (embedded in a switch, router, or standalone probe) and a central sFlow collector. The sFlow agent is a virtual entity using sampling technology to capture traffic statistics from the device it is monitoring. The sFlow collector can be a host receiving sFlow datagrams from the sFlow agent.
On Omada switches, the version of sFlow is version 5. It is implemented as follows: the sFlow sampler takes samples of traffic statistics and sends sFlow datagrams to the sFlow agent for processing. The sFlow agent will forward sFlow datagrams to the sFlow collector for analysis. The analytic results can be displayed on the sFlow collector.
Currently, at most four sFlow collectors can be configured on the same Omada switch; then, each port can be configured to report to one of these collectors. The ingress and egress sampling rate also needs to be configured; it could be set as 0 or a number between 1024 and 65535. When set to 0, this port will never take samples or report. When set to 1024-65535, for example, 1024, the port will take a sample every 1024 packets and report. On Omada access and aggregation switches, each port can be configured with a different ingress and egress sampling rate. In contrast, Omada campus switches and Omada Pro L3 switches apply the same ingress and egress sampling rate to all ports.
Requirements
- Omada Access Switches with model number SG3xxx
- Omada Aggregation Switches
- Omada Campus Switches
- S6500 & S7500 Series Omada Switches
Configuration
To use sFlow, what we need to do is to enable sFlow globally, assign an agent address (usually same as the switch IP address), then input the sFlow collector IP address (usually the IP address of PC running sFlow collector service) and collecting UDP port (by default is 6343), finally, bind the port you want to monitor towards a collector configured and set the ingress/egress sampling rate.
Step 1. Enable sFlow globally and assign an agent address (usually the same as the switch IP address). Go to Maintenance > sFlow > sFlow Agent, select the sFlow Agent option, and enter an Agent Address. In this case, the switch IP address is 10.30.26.214, so we configure this address as the Agent Address. Click Apply to save the configuration.
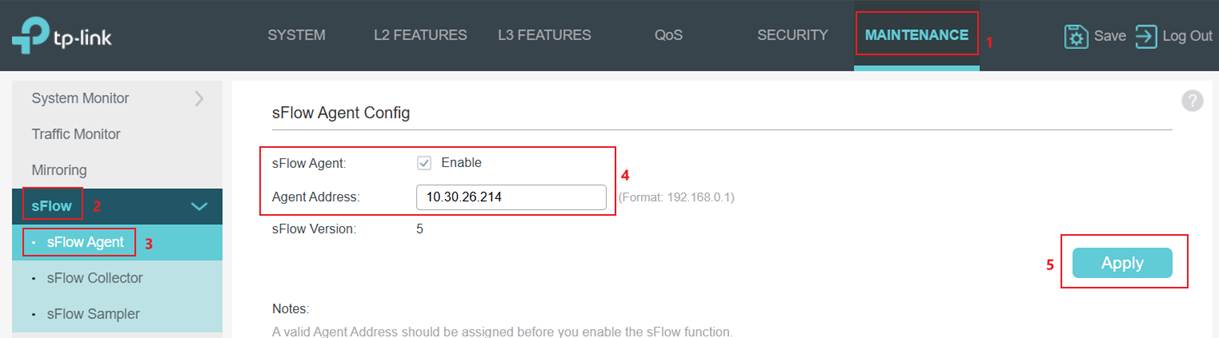
If configuring via CLI, the commands are as follows:
sflow enable
sflow address 10.30.26.214
Step 2. Configure the sFlow collector. As an example, the IP address of the PC running the sFlow collector service is 10.30.26.225. Go to sFlow Collector, tick Collector 1, enter the Collector IP 10.30.26.225, leave the Collector Port as default, click Apply to save the config.
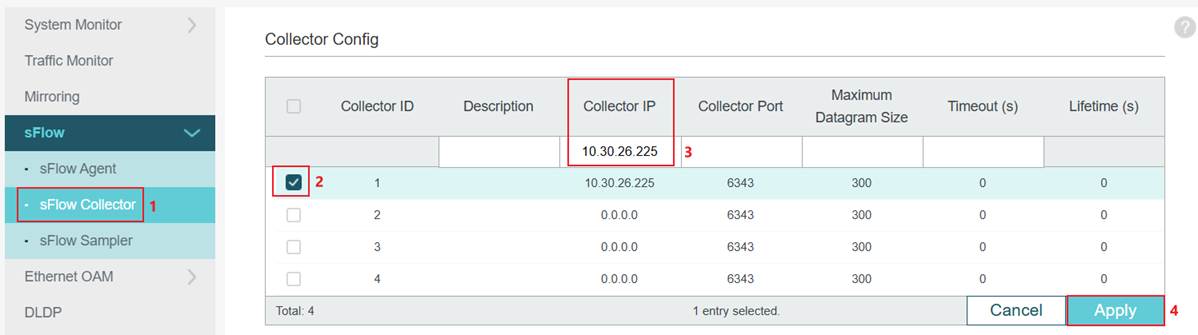
If configuring via CLI, the commands are as follows:
sflow collector collector-ID 1 ip 10.30.26.225
Step 3. Configure the port sampler. For example, we want to monitor the traffic of port 1, send the sample to Collector 1 we have configured, and set both Ingress and Egress Sampling Rate as 1024Hz, which is to sample every 1024 packets.
On Omada Access and Aggregation switches, navigate to the sFlow Sampler, select Port 1, set Collector ID to 1, and configure both Ingress Sampling Rate and Egress Sampling Rate to 1024.
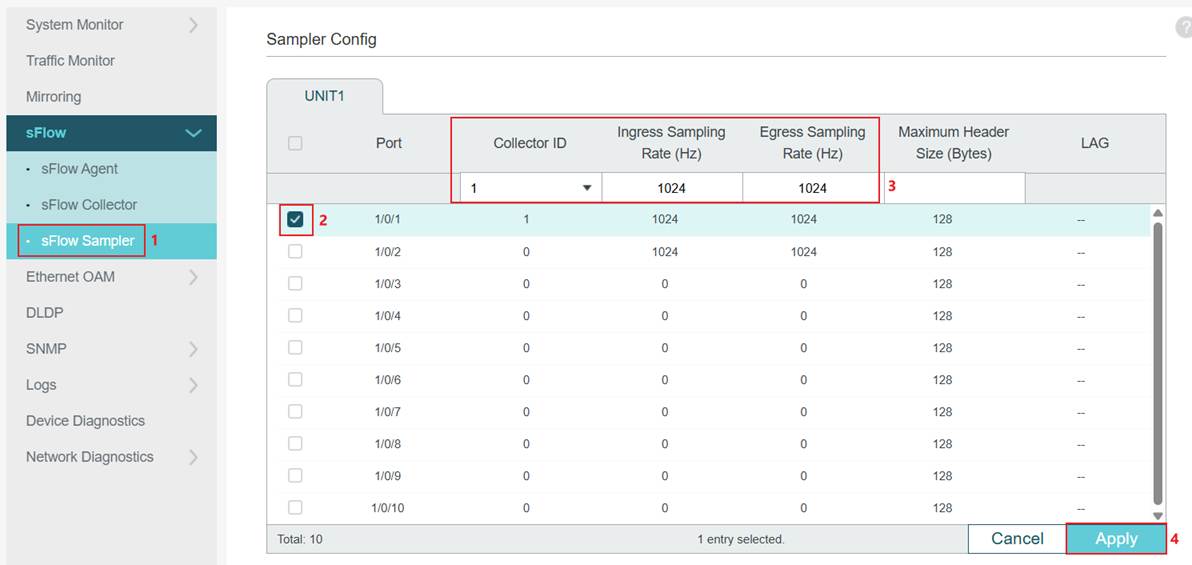
If configuring via CLI, the commands are as follows:
Interface two-gigabitEthernet 1/0/1 (In this example, port 1 is a 2.5G port)
sflow sampler collector-ID 1
sflow sampler ingRate 1024
sflow sampler egRate 1024
exit
On Omada Campus switches and Omada Pro L3 switches, navigate to the sFlow Sampler, configure the Ingress Sampling Rate and Egress Sampling Rate to 1024, and then click Apply to save the configuration. This will apply to all the ports. Next, tick Port 1, select Collector ID as 1, and then click Apply to save the configuration.
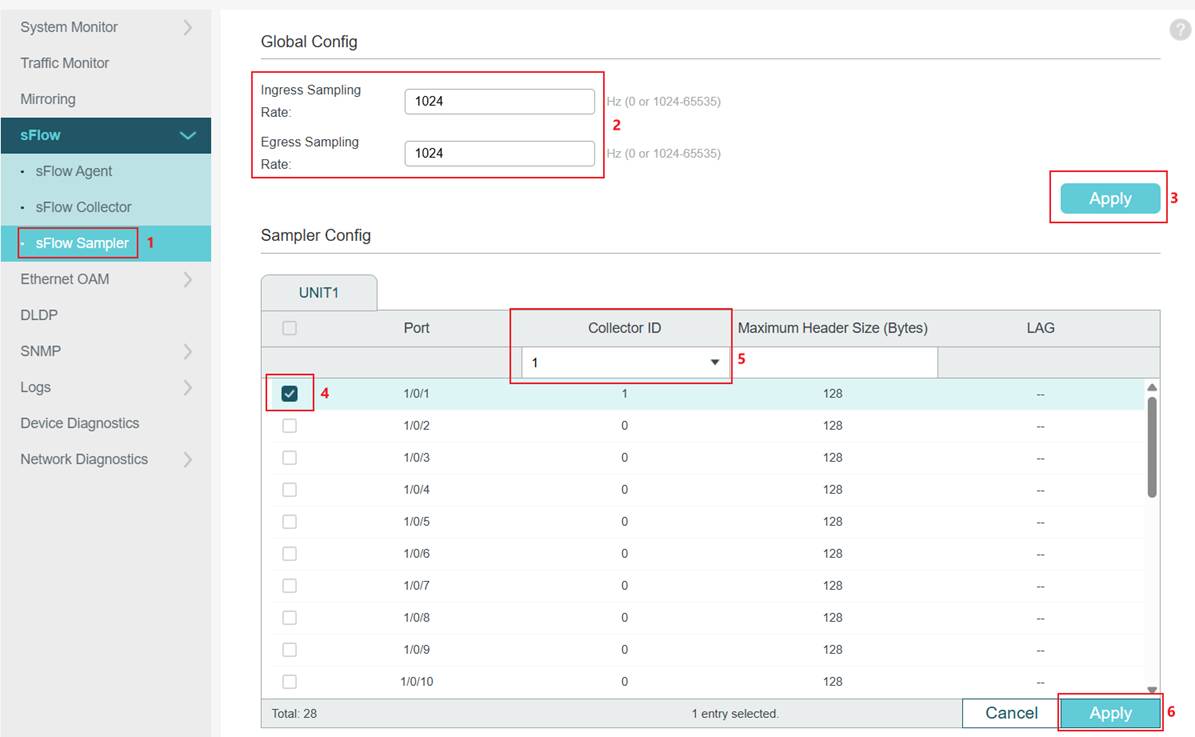
If configuring via CLI, the commands are as follows:
Interface gigabitEthernet 1/0/1 (In this example, port 1 is a 1G port)
sflow sampler collector-ID 1
exit
sflow sampler ingRate 1024
sflow sampler egRate 1024
We have completed configuring sFlow on the Omada switch. The traffic sample statistics can be checked on the corresponding sFlow collector, typically a PC or server running the sFlow collector service.
Verification
In this example, the IP address of the PC running the sFlow collector is 10.30.26.255. On this PC, start the sFlow collector and check the results. Please bear in mind that the firewall permit rule for UDP 6343 should be configured, and the collecting interface, as well as the collecting port, should be correctly configured on the collector.
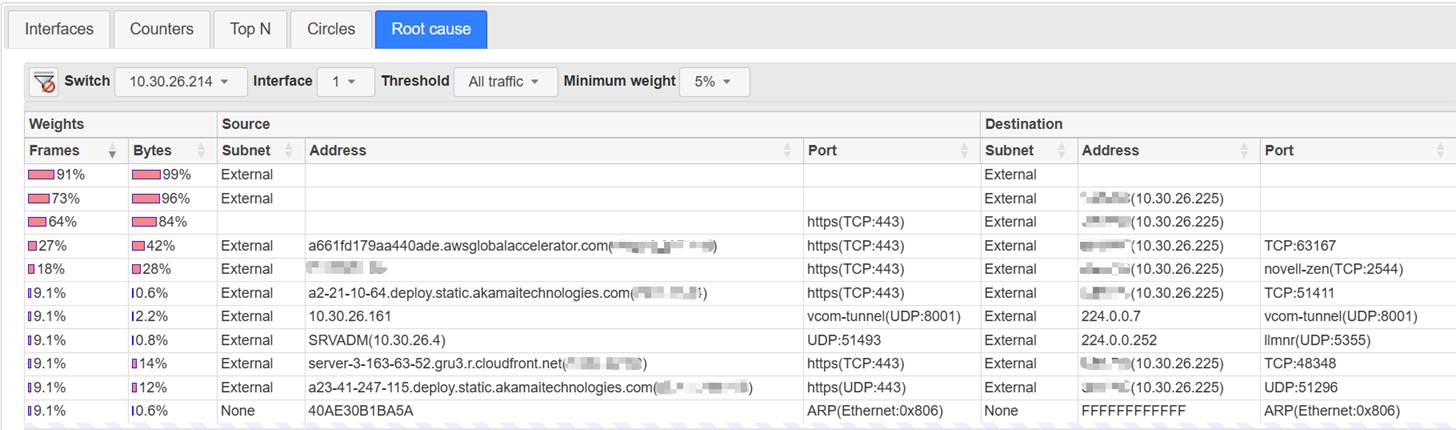
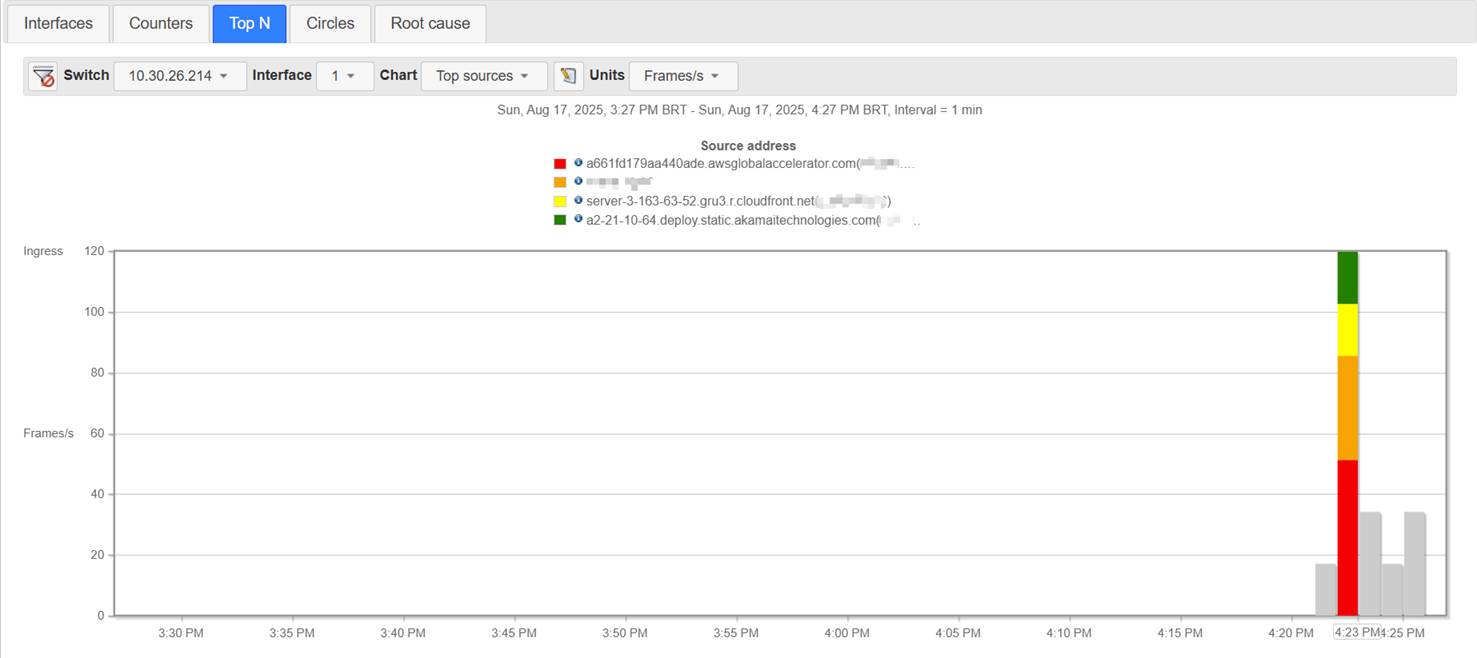
After being correctly configured, we could check the result of the traffic sample statistics.
Conclusion
In this article, we have introduced what sFlow is and how to configure sFlow on Omada switches, and a simple example of sFlow result is also shown.
Get to know more details of each function and configuration please go to Download Center to download the manual of your product.
