How to use tools on the Omada Controller(v5.9 to v6)
Contents
This guide introduces the use of three tools available on the Omada Controller for network troubleshooting.
- Omada Controller v5.9 and above
- Omada Gateway / Switch / AP that support the Tools
When the network encounters problems that need to be troubleshot, the tools on the Omada Controller can help. These tools, including Network Check, Packet Capture, and Terminal, allow users to quickly identify the cause of the problems, saving time on troubleshooting and achieving greater efficiency.
The Network Check tool can be used to check network connectivity, identify the source of a problematic link, or look up DNS information. The Omada Controller provides three methods for network check: Ping, Traceroute, and DNSLookup.
Controller Compatibility:
Version 5.9 and above: Compatible with Switch and AP
Version 5.12 and above: Compatible with Gateway, Switch, and AP
Step 1. Log in to the Controller via web browser, go to Tools > Network Check.

Step 2. Enter the configuration information according to your own needs. For instance, we use the Ping tool to check the connectivity between the AP and the gateway (192.168.1.1), so we send 4 data packets with the size of 32 Bytes to the IP address 192.168.1.1 to see if the connection is normal based on the returned message.

Step 3. Click Run to perform the test.

Step 4. View the result in the Device Output section. The tested device is shown in the Device List on the left and the test result is displayed on the right for further analysis. You can also use the search bar to search for the specific result, send the results by email, download the test logs, zoom in and out the displayed area, and clear the results displayed.

Parameters Explanation:
|
Parameters |
Type |
Explanation |
||
|
Device Type |
Drop-down list |
Select the type of device(s) to perform a test: EAP, Switch, or Gateway. |
||
|
Source |
Pop-up window |
Select one or multiple devices to perform the test. You can use the search bar to search for the specific device. |
||
|
Test |
Drop-down list |
Select the type of the test tool: Ping, Traceroute, or DNSLookup. |
||
|
Interface |
Drop-down list |
Select the WAN port for testing. This option only appears when the Gateway is chosen as the device type. |
||
|
Destination Type |
Drop-down list |
Select the destination type and specify the Domain/IP Address or Client to ping. |
||
|
Packet Sizes |
Input box |
The size of a single packet. This option only appears when the test type is Ping. |
||
|
Counts |
Input box |
The number of packets. This option only appears when the test type is Ping. |
||
|
RUN |
Button |
Click to start the test. |
||
|
Device Output |
||||
|
Device List |
List |
Click on different MAC addresses to show the test results for the corresponding devices. |
||
|
Output for the Device |
Displayed area |
Display the test result. |
||
|
Search bar |
Input box |
Display logs based on the search keywords. |
||
|
|
Button |
Send all the longs of the corresponding device to the specific email address. |
||
|
|
Button |
Download all the logs of the corresponding device from the browser. |
||
|
|
Button |
Zoom in to view the logs. |
||
|
Clear |
Button |
Clear the logs of the current device or all devices. |
||
Note: Please make sure your devices are compatible with the Omada Controller and are updated to the latest firmware version. If the device does not support the Ping, Traceroute, or DNSLookup function, a note will appear in the pop-up window of Sources.
The Packet Capture tool can be used to capture data packets transmitted in the network for further analysis.
Controller Compatibility:
Version 5.9 and above: Compatible with AP
(Only Omada Pro Controller is compatible with Gateway, Switch, and AP)
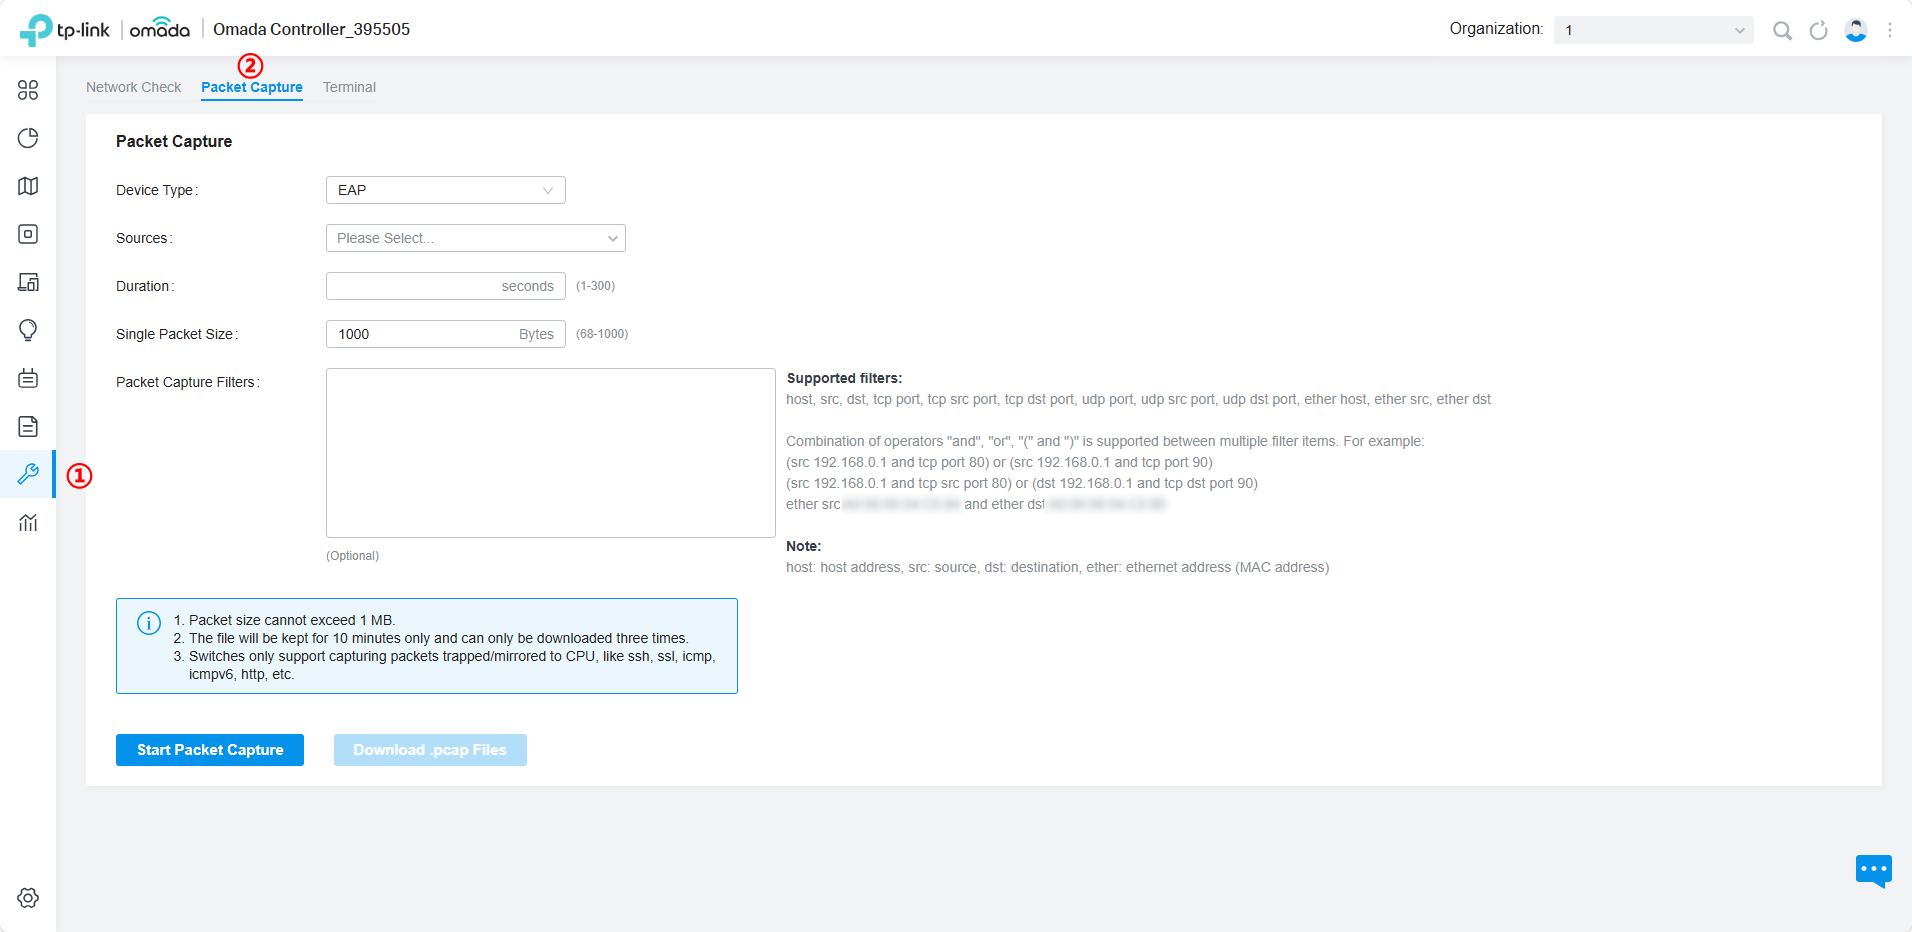
Step 1. Log in to the Controller via web browser, go to Tools > Packet Capture.

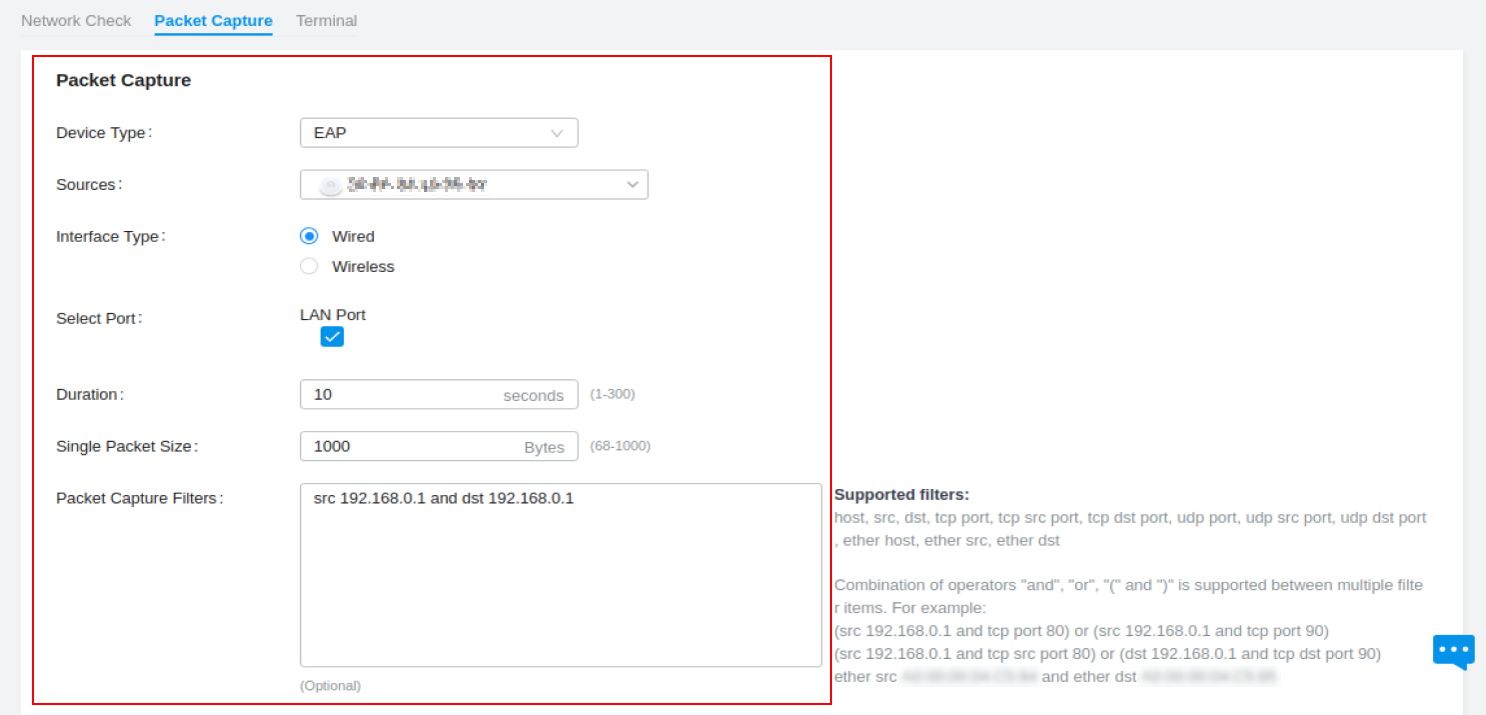
Step 2. Enter the configuration information according to your own needs. For instance, when we suddenly fail to access a web page, we can use the packet capture tool to analyze if there is any issue occurred during the TCP three-way handshake process. If the host (IP: 192.168.1.1) fails to ping other hosts, enter src 192.168.0.1 and dst 192.168.0.1 in the Packet Capture Filters and perform packet capture to analyze ICMP messages for further information.

Step 3. Click Start Packet Capture.

Step 4. After the packet capture is completed, the Download.pcap File button will be enabled (no longer grayed out). Click on the button to download the captured network traffic file.

Parameters Explanation:
|
Parameters |
Type |
Explanation |
|
Device Type |
Drop-down list |
Only EAP is supported. |
|
Sources |
Pop-up window |
Select a device to perform the test. You can use the search bar to search for the specific device. |
|
Interface Type |
Checkbox |
Select the Wired or Wireless interface type. Capturing 802.11 packets in the wireless environment is not supported. |
|
Select Port |
Checkbox |
Select the wired port. This option only appears when the Interface Type is Wired. The specific number and other information of the ports varies according to the device. |
|
Band |
Drop-down list |
Select the wireless band. This option only appears when the Interface Type is Wireless. The band (2.4/5/6 GHz) information varies according to the device. |
|
SSID / Interface |
Drop-down list |
Select the wireless port. This option only appears when the Interface Type is Wireless. SSID and mesh interface are supported. For SSID configuration, go to Settings-> Wireless Networks->WLAN. Mesh interfaces include sta and bkhap, which will appear when the device supports the mesh function. |
|
Duration |
Input box |
Specify the duration for packet capture (1-300 seconds). |
|
Single Packet Size |
Input box |
Specify the size of a single captured packet (68-1000 Bytes). |
|
Packet Capture Filters |
Input box |
Enter the filters to capture packets. It can help capture the specific type of packets. Refer to the note in the page. This field is optional. |
Note:
1. AP can capture various wired packets such as ICMP, ARP, TCP, UDP, as well as some multicast and broadcast packets. To ensure the normal operation of the wireless network, capturing air interface packets in the wireless environment is not currently supported.
2. The Omada Pro Controller supports the Gateway/Switch packet capture. For Switches, it can capture packets that are sent to the CPU (packets trapped/mirrored to CPU), such as TCP, UDP, ICMP, ICMPv6, and others.
3. The packet capture file is only retained for 10 minutes and can only be downloaded a maximum of 3 times. Please download the file as soon as possible after the capture is completed.
The Terminal tool can be used to debug devices or obtain device information through command lines.
Controller Compatibility:
Version 5.9 and above: Compatible with Switch and AP
Version 5.12 and above: Compatible with Gateway, Switch, and AP
Step 1. Log in to the Controller via web browser, go to Tools > Terminal.

Step 2. Configure Remote Control Terminal Session. For instance, we want to obtain device information of EAP215-Bridge through Terminal, select EAP for Device Type, click Source to enter the Choose Device page, select EAP215-Bridge, and click Confirm.

Step 3. Click Open Terminal.

Step 4. On the left of the Sessions displays the device list and on the right shows the command-line interface on the Terminal. Enter the command lines to debug the device and obtain the device information.

Step 5. You can also use the search bar to search for the specific command lines and returned messages, download and send them by email, zoom in and out, and clear the displayed area.

Parameters Explanation:
|
Device Output |
||
|
Device List |
List |
Click on different MAC addresses to show the test results for the corresponding devices. |
|
Output for the Device |
Displayed area |
Display the test result. |
|
Search bar |
Input box |
Display logs based on the search keywords. |
|
|
Button |
Send all the longs of the corresponding device to the specific email address. |
|
|
Button |
Download all the logs of the corresponding device from the browser. |
|
|
Button |
Zoom in to view the logs. |
|
Clear |
Button |
Clear the logs of the current device or all devices. |
The common commands are as follows:
Common Command Lines on Terminal Devices
|
Device Type |
Command Lines |
Function |
|
|
AP |
pwd |
Display the current directory |
|
|
xping ip |
Variable IP address that performs background ping tests. If no IP address is provided as a parameter, it will default to pinging 4 responses. |
||
|
ls |
View files in the current directory |
||
|
echo str |
Print or display a specified string or text. str can be any any arbitrary string. |
||
|
date |
Display the current date and time |
||
|
free |
Display available and used system memory |
||
|
ps |
View running process |
||
|
ifconfig |
Check the IP address of network interface card |
||
|
netstat -r |
View the routing table |
||
|
exit |
Log out/end Terminal |
||
|
Switch |
broadcast <string> |
Send a message to all logged in users |
|
|
logout |
Log out |
||
|
debug |
View information on fan, power status etc. |
||
|
ping |
Ping |
||
|
telnet |
Remotely log in to another host |
||
|
terminal length <length> |
Set the number of lines to display before pagination |
||
|
clear |
Reset certain functions |
||
|
exit |
Exit |
||
|
history |
Display command history |
||
|
show |
Display system information |
||
|
Gateway |
help |
Display available commands |
|
|
exit |
Exit from current mode |
||
|
enable |
Turn on privileged commands |
||
|
disable |
Turn off privileged commands |
||
|
configure |
Enter configuration mode |
||
|
show |
Display module information |
||
|
ping |
Ping ip address |
||
|
tracert |
traceroute ip address |
||
|
clear history |
Clear previously run commands |
||
|
reboot |
Reboot device |
Note:
1. All Bash commands on AP devices can be accessed by double-tapping the Tab key. CLI commands on the Switches can be viewed by entering “?” in the CLI. Help for the Gateway device can be accessed by entering “help” in the CLI.
2. The CLI guide for the device can be downloaded from Download Center > specific device page > Manual. For example, the CLI guide for the Smart Switch SG2452LP V1 can be accessed at:
https://www.tp-link.com/en/support/download/sg2452lp/
The above is the configuration guide for Tools on Omada Controller.
Get to know more details of each function and configuration please go to Download Center to download the manual of your product.


