


How to Export System Logs from Omada Devices


Contents
Overview: Log collection methods by device type
Understand system logs and debug logs
Export logs for controller-managed devices
Enable debug log for troubleshooting
Export system logs from a standalone gateway
Export system logs from a standalone switch
Export system logs from a standalone EAP
Introduction
System logs are an important source of diagnostic information when troubleshooting network and device-related issues. They record operational events, configuration changes, warnings, errors, and status updates that can help identify the root cause of abnormal behavior.
For complex or intermittent issues, additional diagnostic data may be required. In these situations, TP-Link Technical Support may recommend enabling Debug Log to capture more detailed information before reproducing the issue.
This article explains the differences between System Logs and Debug Logs and provides step-by-step instructions for collecting logs from Omada Controller-managed devices, standalone gateways, switches, and EAPs.
Requirements
- Omada Controller or Omada Central (for Controller-managed devices).
- Omada Gateway, Switch, or EAP running in Standalone Mode.
- Administrator account with management privileges.
Overview: Log collection methods by device type
Different Omada deployment modes provide different log collection and diagnostic capabilities. The table below summarizes the available log collection methods for each device type.
|
Device Type |
Local Log Export |
Syslog Server |
Debug Log |
|
Controller-Managed Devices |
Yes |
N/A |
Yes |
|
Standalone Gateway |
Yes |
Yes |
No |
|
Standalone Switch |
Yes |
Yes |
No |
|
Standalone EAP |
No |
Yes |
No |
Select the section applicable to the deployment environment to collect the required logs.
Understand system logs and debug logs
System logs contain records of system events and operating information, including:
- Device startup and reboot events.
- Network connectivity status.
- Configuration changes.
- Authentication and access records.
- Warning and error messages.
- Device operational information.
When troubleshooting intermittent or complex issues, technical support may require additional debug logs. Debug logs provide more detailed diagnostic information than standard system logs.
Note: If you are requested to collect logs for troubleshooting, it is recommended to enable Debug Log first, reproduce the issue, and then export the logs immediately after the issue occurs. This helps ensure that sufficient diagnostic information is included in the exported log file.
Export logs for controller-managed devices
When devices are adopted by an Omada Controller, logs can be collected centrally from the Controller rather than from individual devices.
Export system logs
Step 1. Log in to the Omada Controller and select the target site.
Step 2. Navigate to Logs in the left navigation menu.
You can view different types of logs, including Alerts, Events, and Audit Logs according to your troubleshooting requirements. Alerts record warning and abnormal conditions, Events record device and network activities, and Audit Logs record administrator operations and configuration changes.
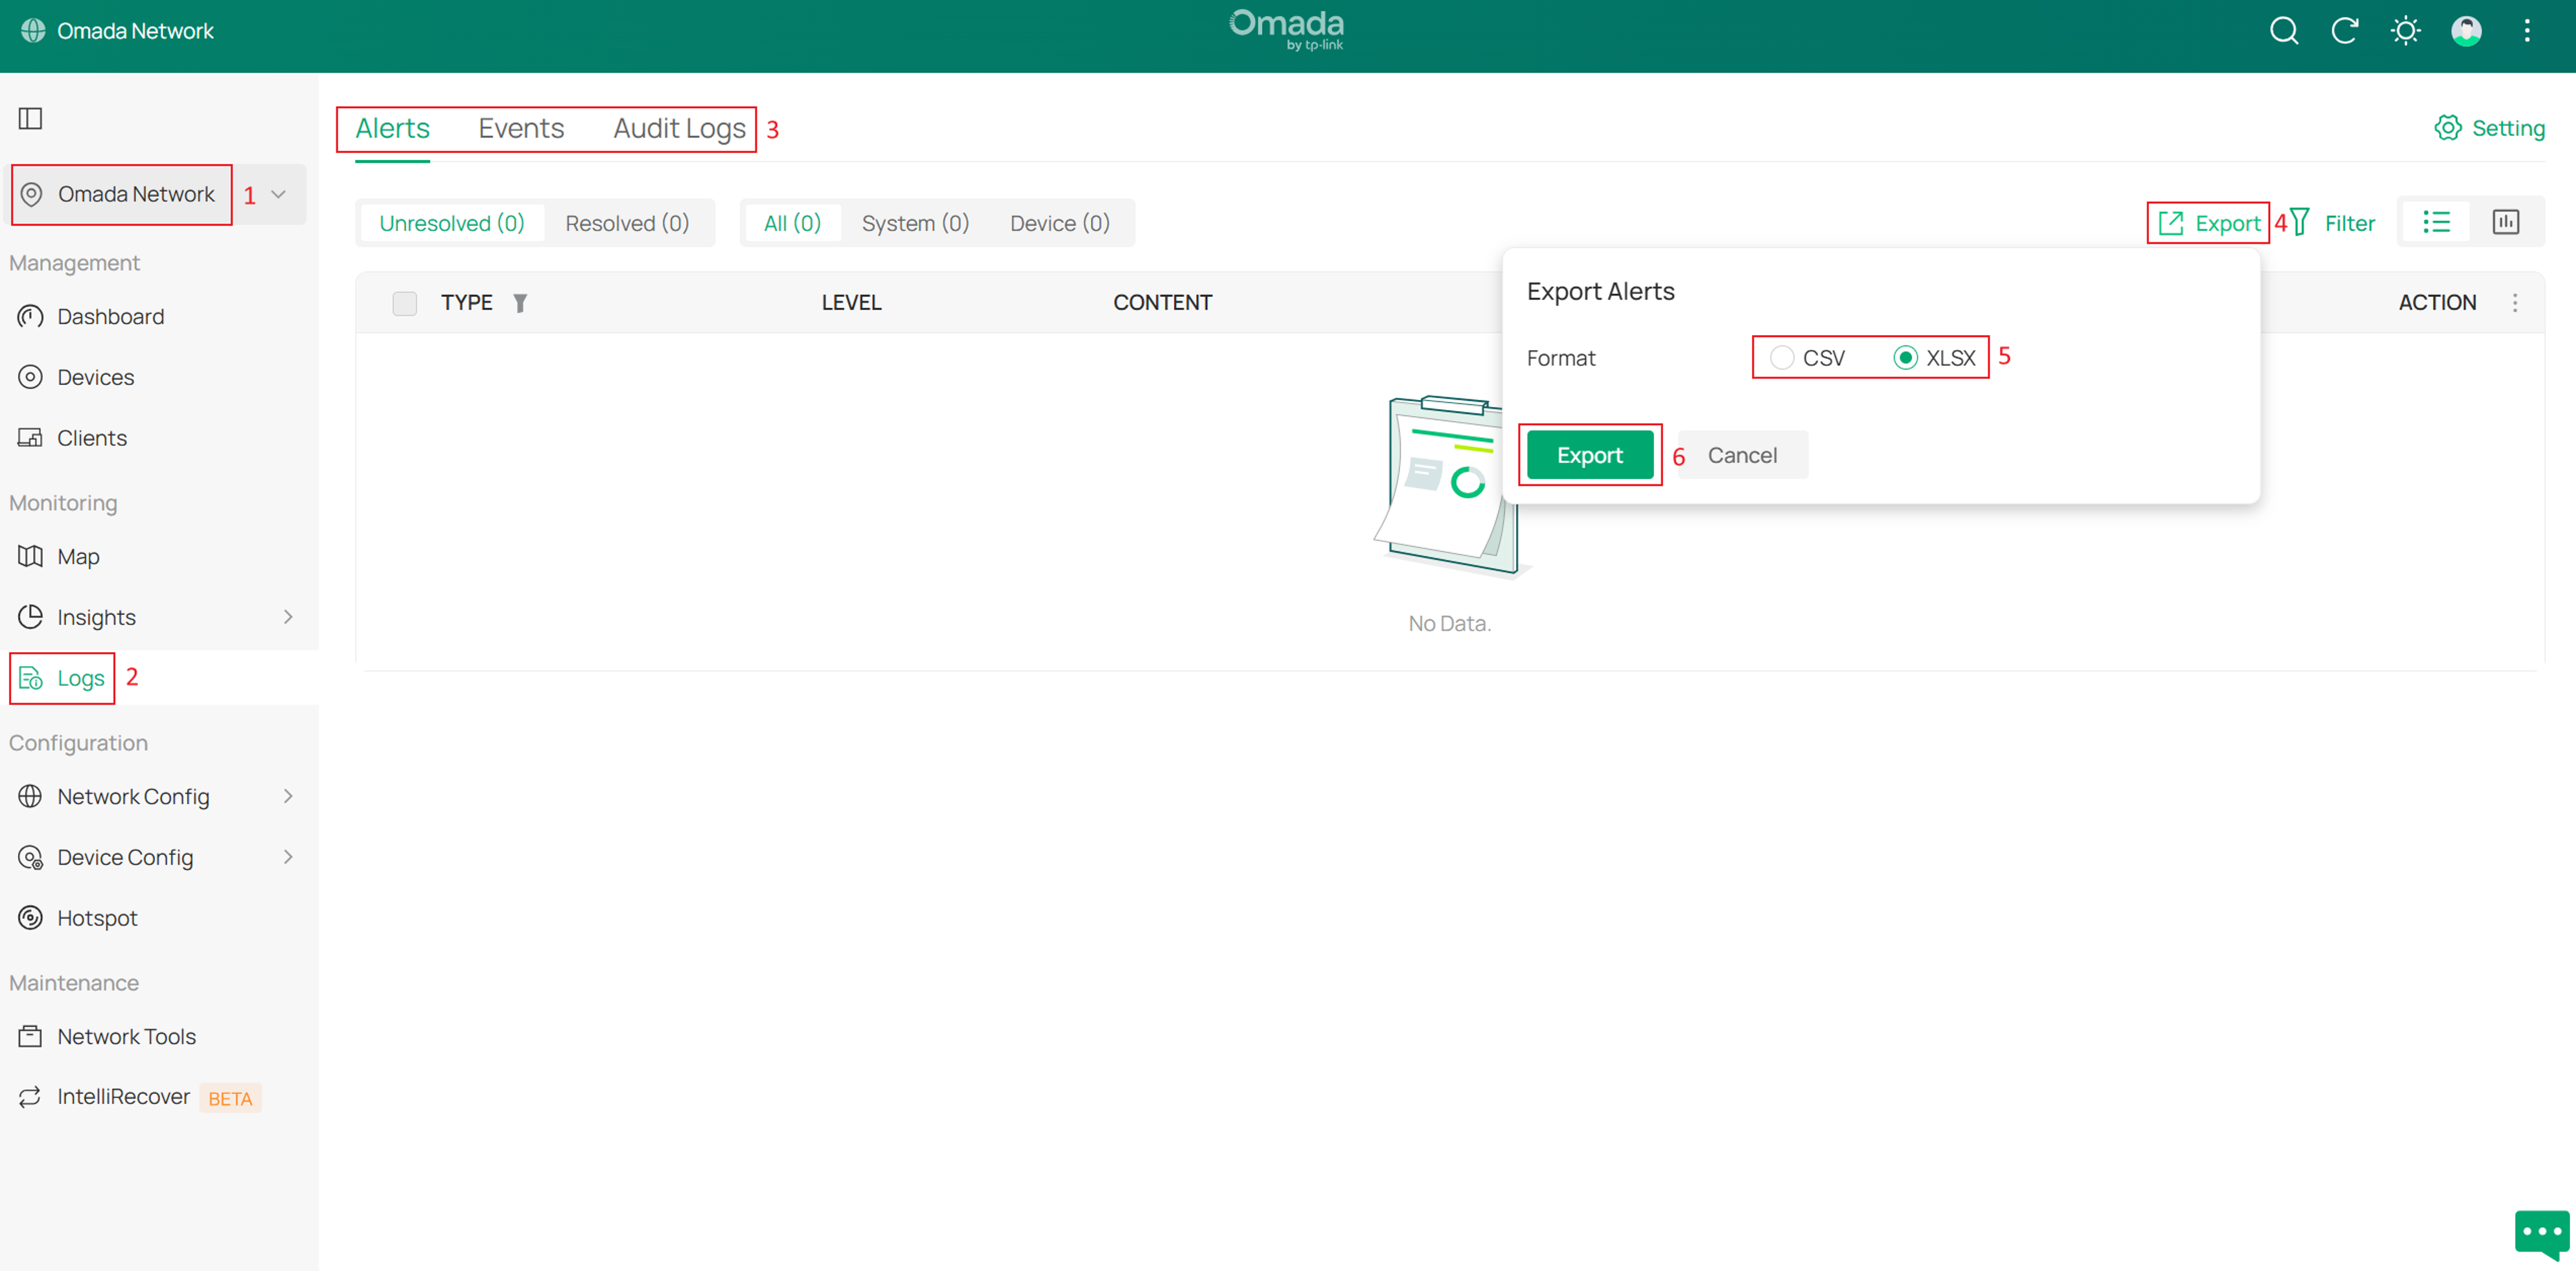
Step 3. Select the desired log category and use filters if necessary to narrow down the log entries.
Step 4. Click Export in the upper-right corner of the page. Select the desired export format, such as CSV or XLSX, and then click Export.
The log file will be downloaded to your local computer.
Note: If you are collecting logs for troubleshooting purposes, export the logs as soon as possible after the issue occurs to ensure that relevant records are included in the exported file.
Enable debug log for troubleshooting
When troubleshooting complex or intermittent issues, standard system logs may not contain sufficient information for analysis. In such cases, TP-Link Technical Support may request you to enable Debug Log before reproducing the issue.
Debug logging generates more detailed diagnostic information and can help identify the root cause of network or device-related problems.
Step 1. Log in to the Omada Controller and switch to Global View.
Step 2. Navigate to Settings > System Settings.
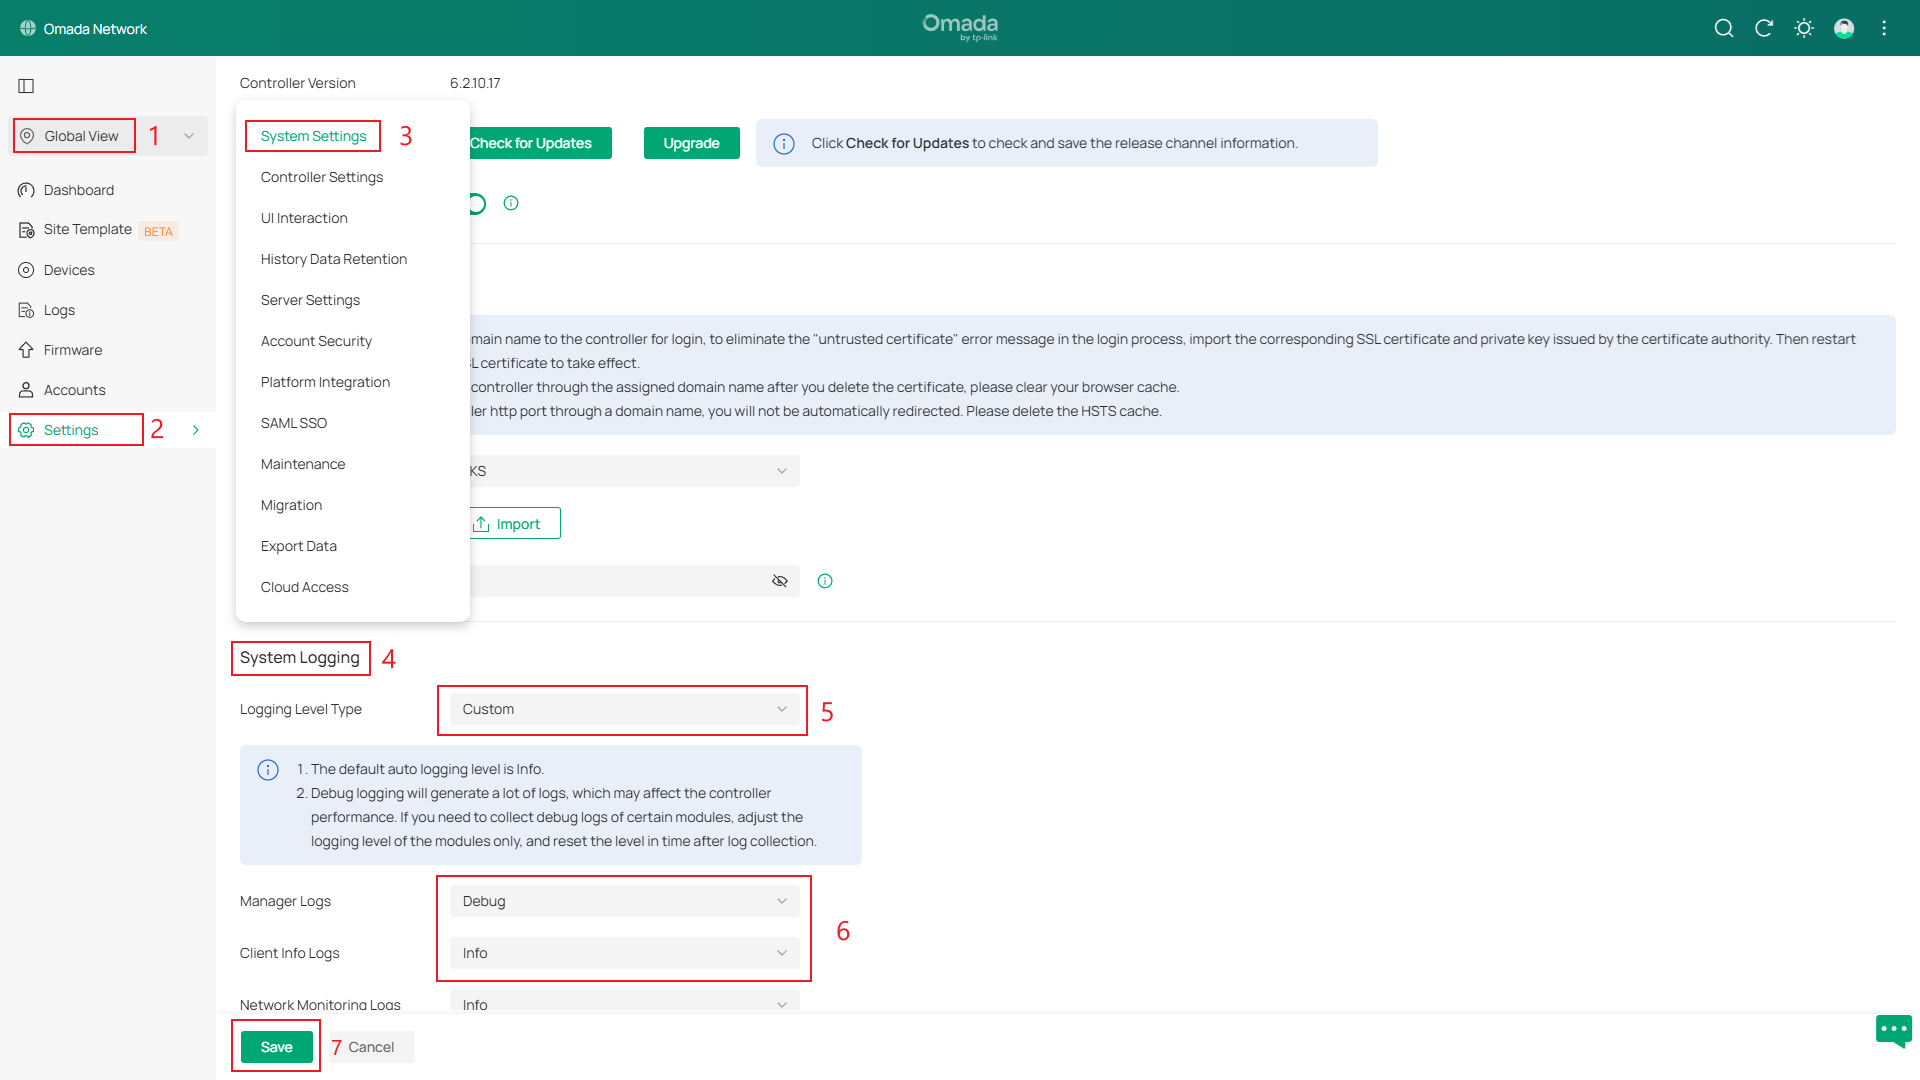
Step 3. Scroll down to the System Logging section. In the Logging Level Type field, select Custom. Locate the module related to the issue you want to troubleshoot, and change its logging level from Info to Debug.
For example, you can set Manager Logs to Debug when troubleshooting controller management issues.
Note: The default logging level is Info. Debug logging generates significantly more log entries and may increase controller resource usage. It is recommended to enable Debug logging only for the module related to the issue and revert the logging level after log collection is completed.
Step 4. Click Save to apply the configuration.
Step 5. Reproduce the issue while Debug Log is enabled.
After the issue occurs, export the relevant logs and provide them to TP-Link Technical Support for analysis.
Note: To ensure that sufficient diagnostic information is captured, enable Debug Log before reproducing the issue and export the logs immediately after the issue occurs.
Export system logs from a standalone gateway
Standalone gateways support both remote logs forwarding through a Syslog Server and local log export. Administrators can configure the gateway to send logs to an external Syslog Server for long-term storage and analysis or export the locally cached system logs.
Send logs to a Syslog server
If long-term log retention is required, you can configure the gateway to forward logs to a Syslog Server.
Step 1. Log in to the Gateway's standalone web management interface.
Step 2. Navigate to System Tools > System Log.
Step 3. Select the desired log severity.
Note: Changing the Severity setting affects only the logs displayed in the web interface. It does not change the logging level used by the device internally and does not affect the contents stored in the device log buffer. Unlike the Omada Controller, Standalone Gateways do not provide a separate Debug Log collection function. Exported logs are based on the device's current cached system logs.
Step 4. In the Server IP field, enter the IP address of the Syslog Server.
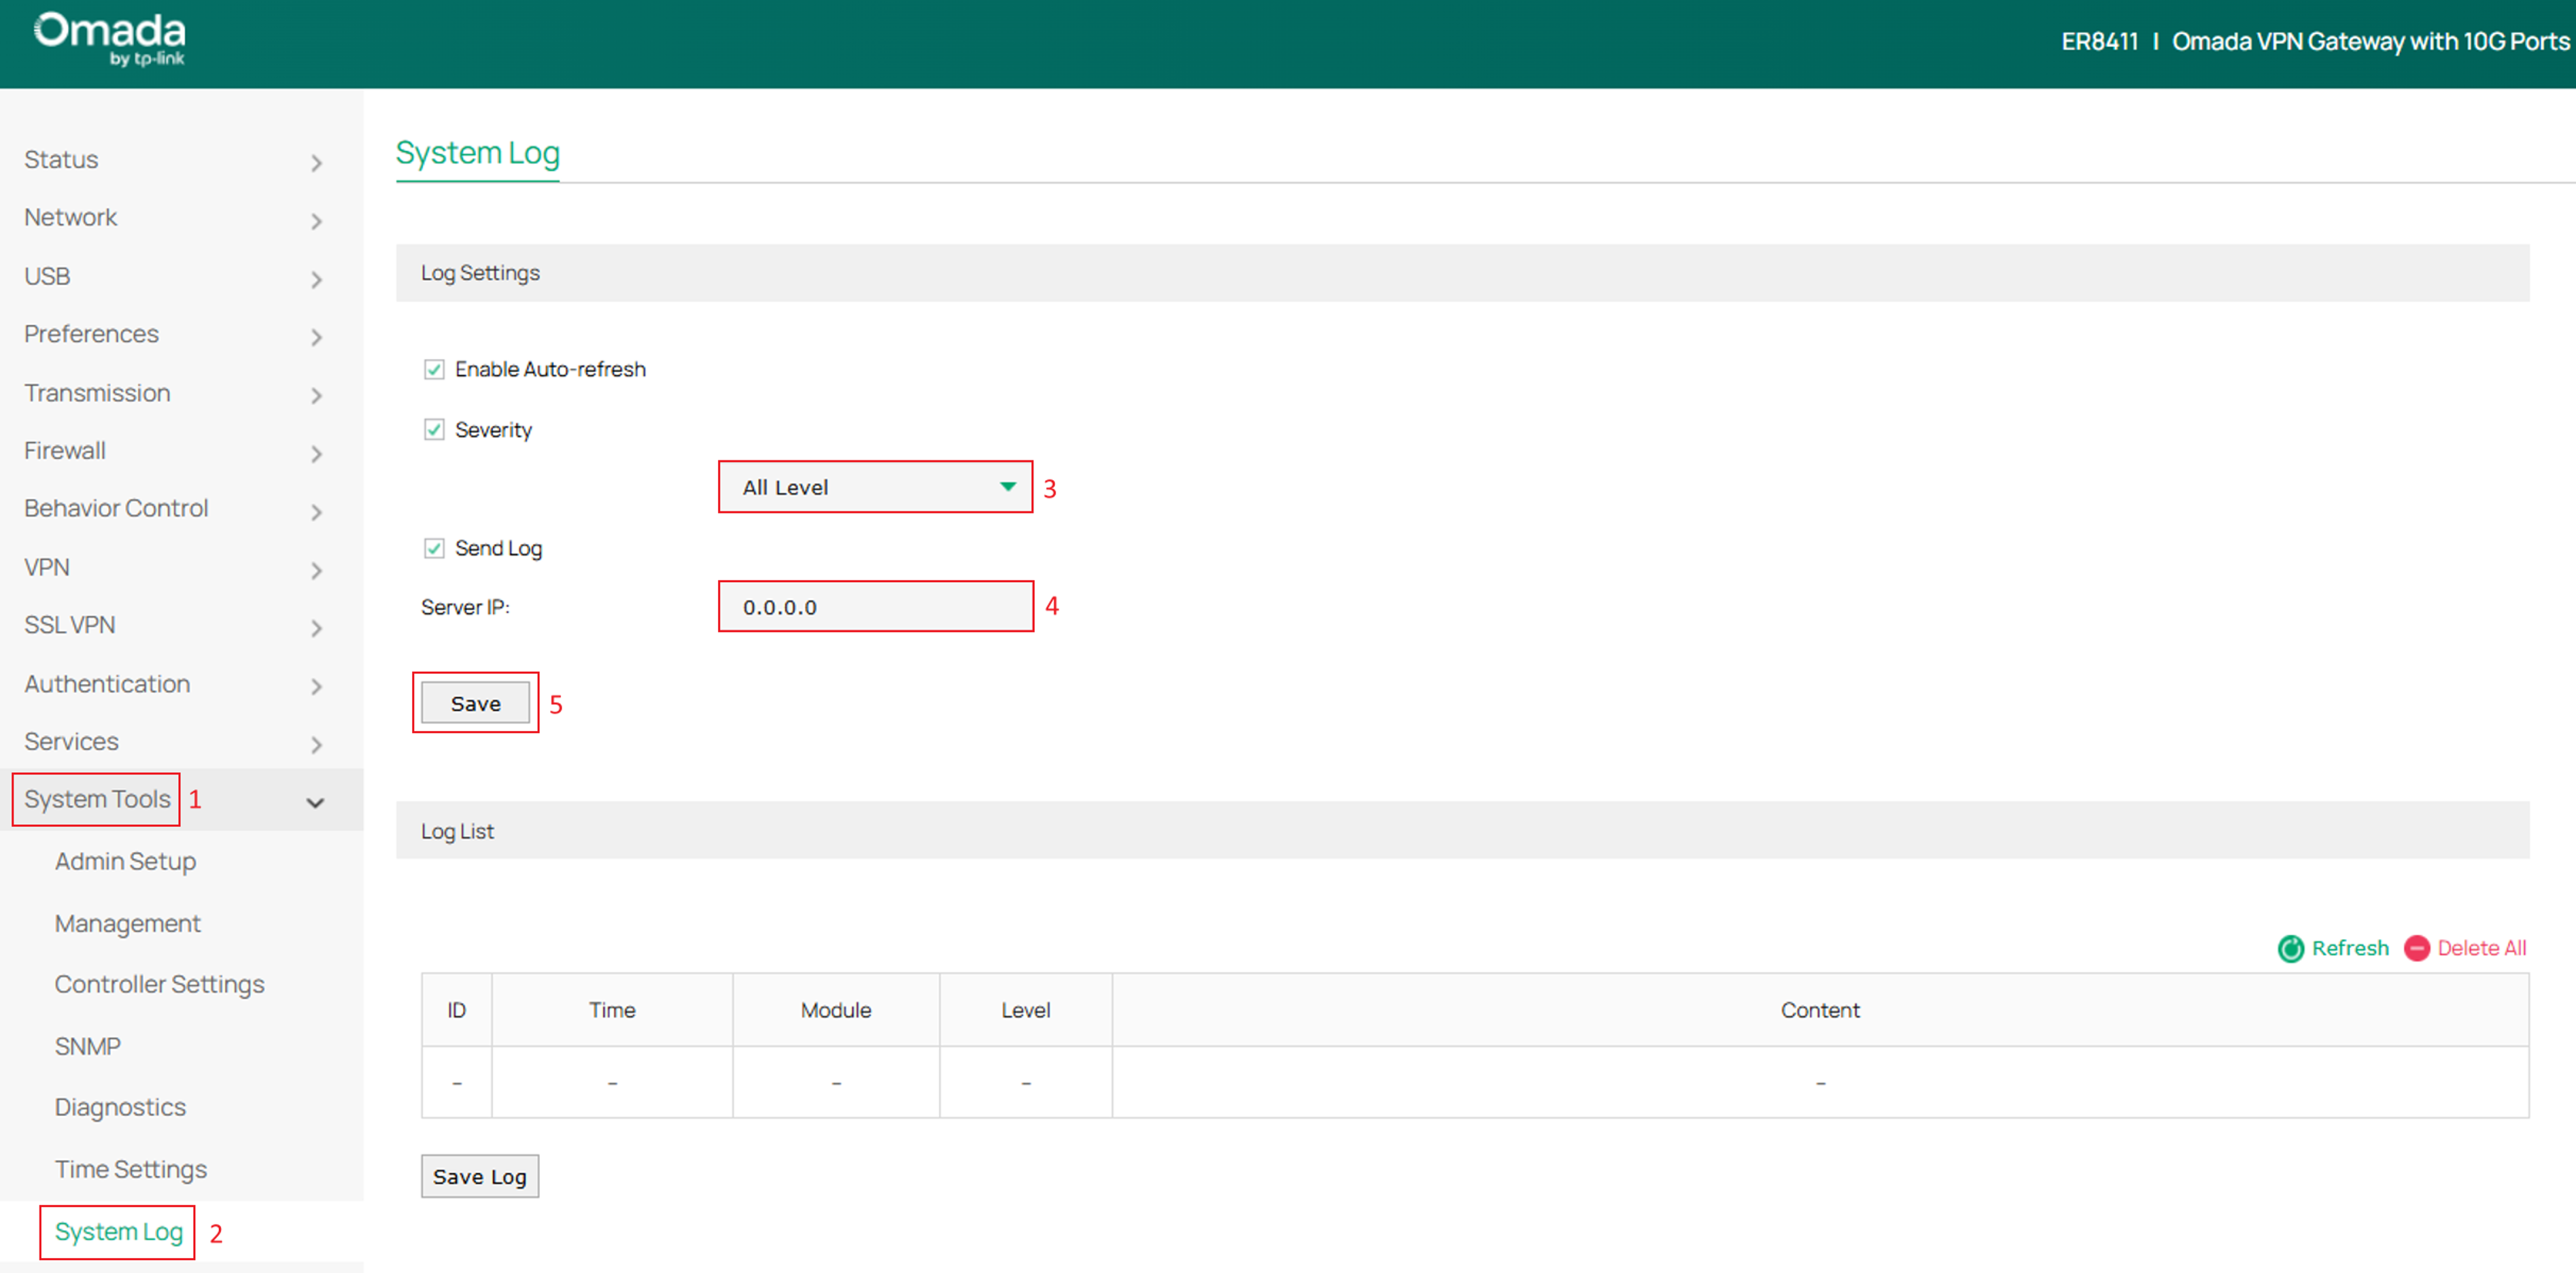
Step 5. Click Save to apply the configuration.
After the configuration is completed, the gateway will automatically send system logs to the specified Syslog Server.
Note: Standalone Gateways currently support forwarding logs only to a Syslog Server. The gateway uses UDP port 514 for Syslog transmission. The destination port cannot be customized in Standalone mode. The Syslog Server can be deployed in either the local network or a remote network, provided that the gateway can reach the server. For security and reliability considerations, deploying the Syslog Server within the internal network is recommended whenever possible.
Export local system logs
Step 1. Log in to the Gateway's standalone web management interface.
Step 2. Navigate to System Tools > System Log.
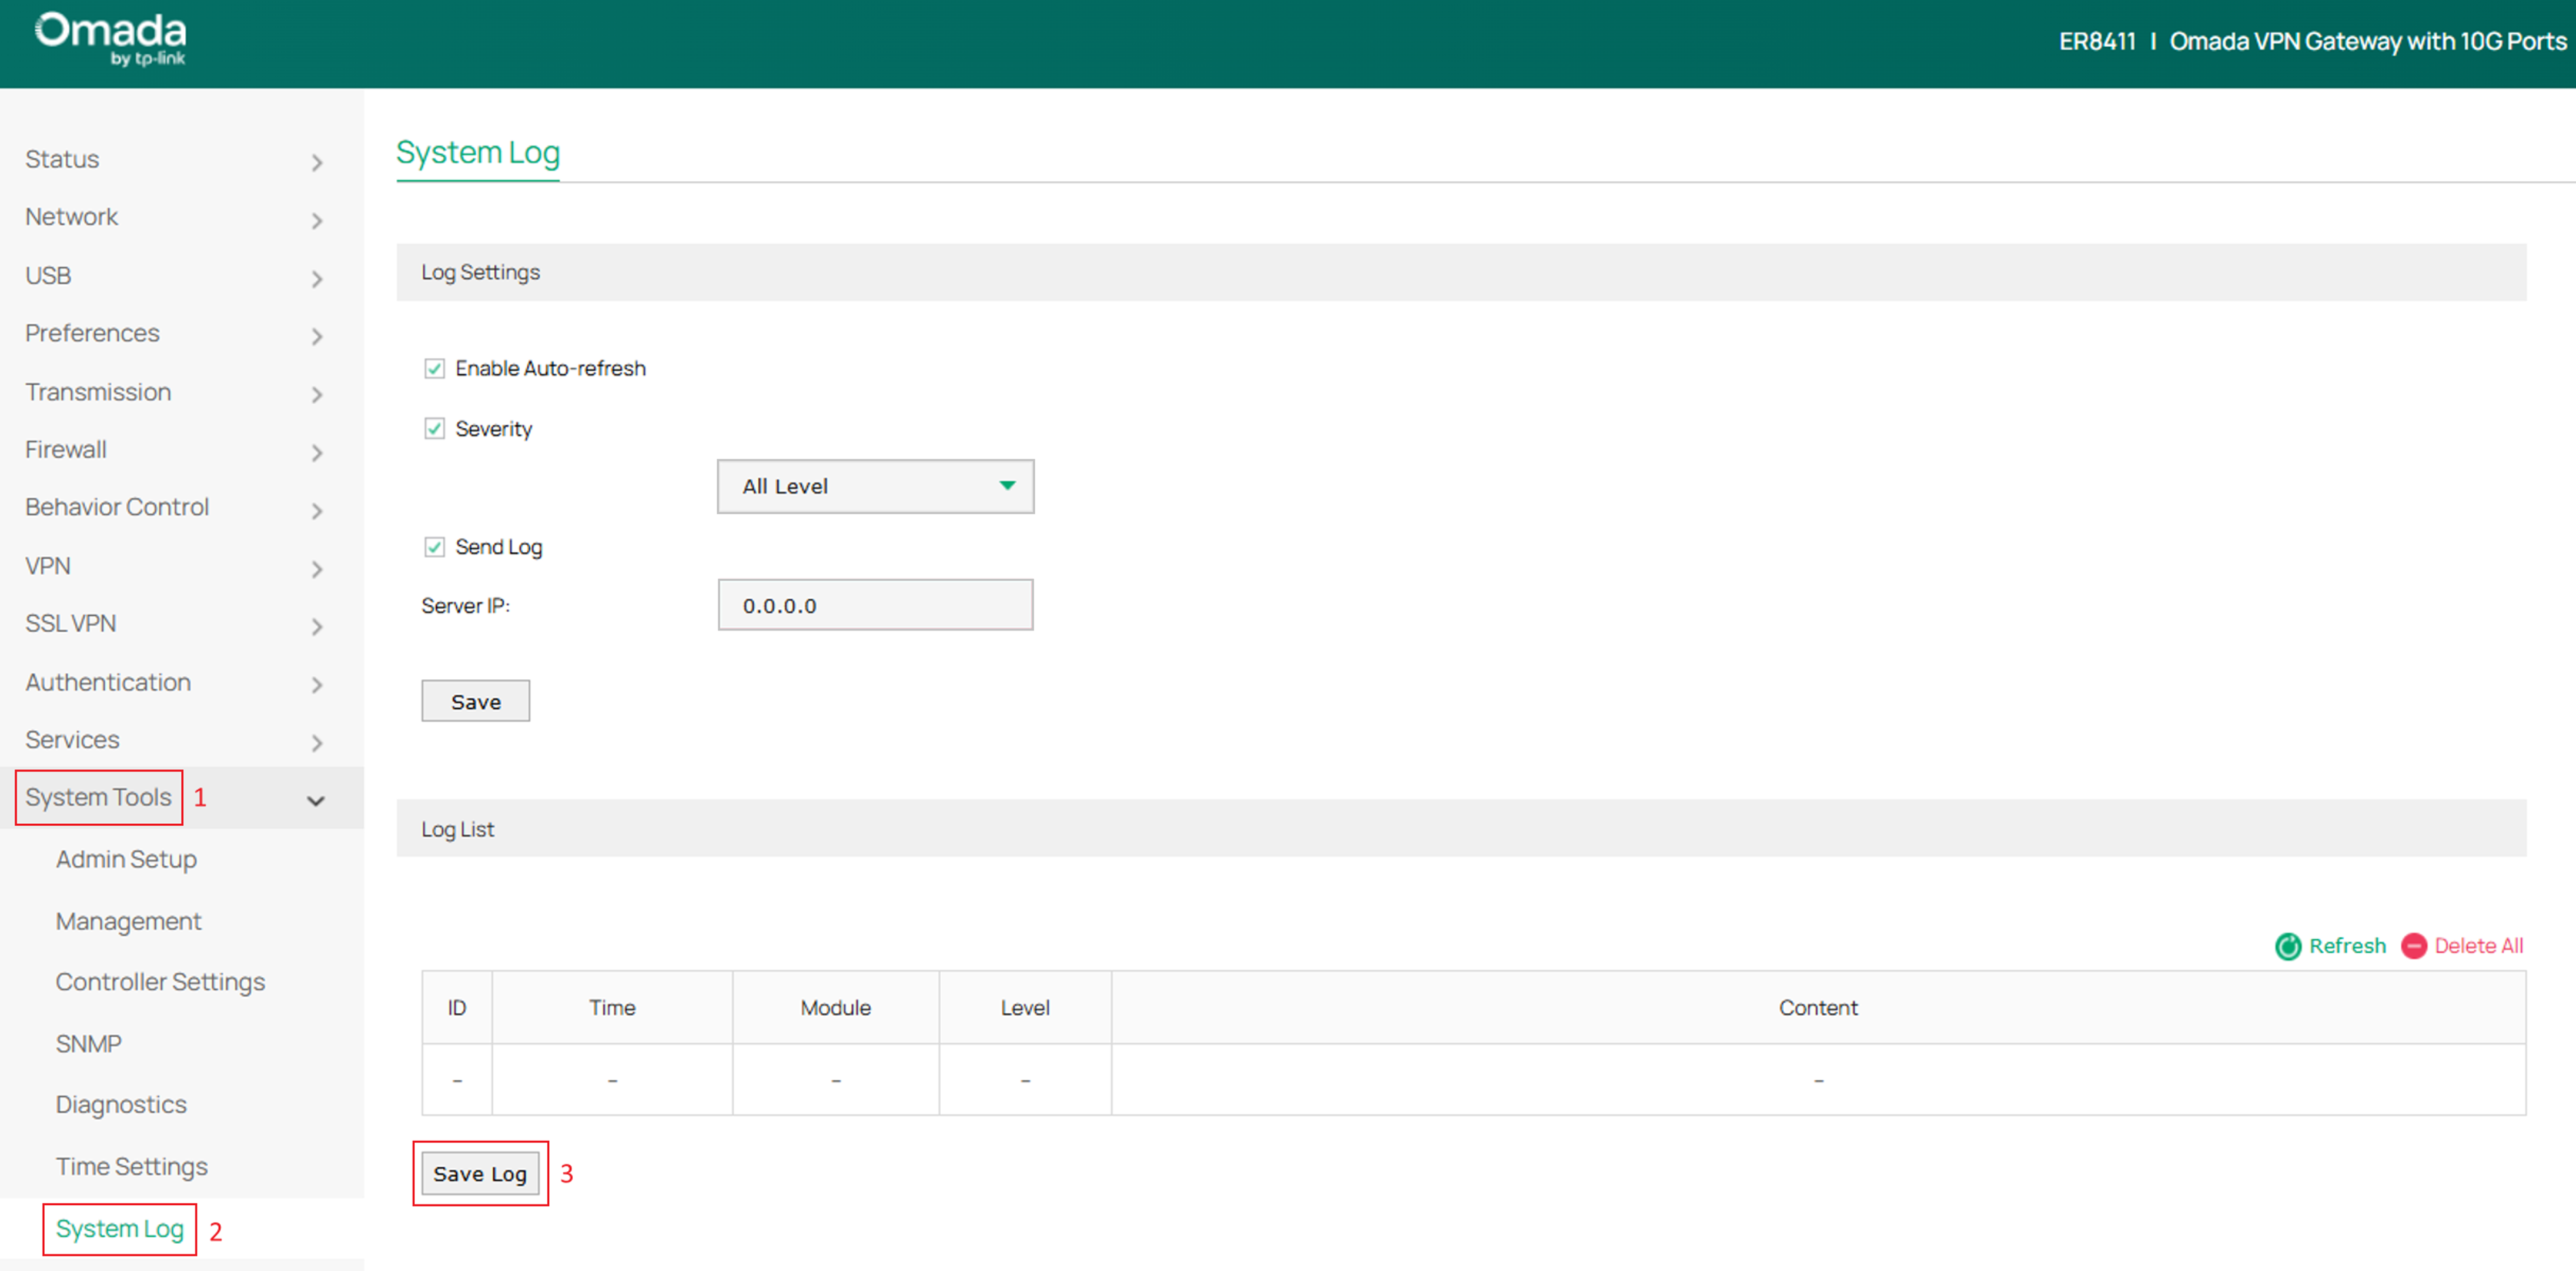
Step 3. Verify that the issue has been reproduced and that relevant log entries are displayed in the Log List.
Step 4. Click Save Log at the bottom of the page.
The gateway will export the currently cached system logs as a log file and save the exported file to your local computer.
Note: Save Log exports all system logs currently stored in the device log buffer rather than logs from a specific time range. The gateway stores up to 1 MB of the most recent system logs. When the log buffer reaches its capacity, older log entries are automatically overwritten by newer ones.
Export system logs from a standalone switch
Standalone switches support both remote logs forwarding through a Syslog Server and local log export. Administrators can configure the switch to send logs to an external Syslog Server for long-term storage and analysis or export the locally cached system logs.
Send logs to a Syslog server
If long-term log retention is required, you can configure the switch to forward logs to a Syslog Server.
Step 1. Log in to the Switch's standalone web management interface.
Step 2. Navigate to Maintenance > Logs > Remote Logs.
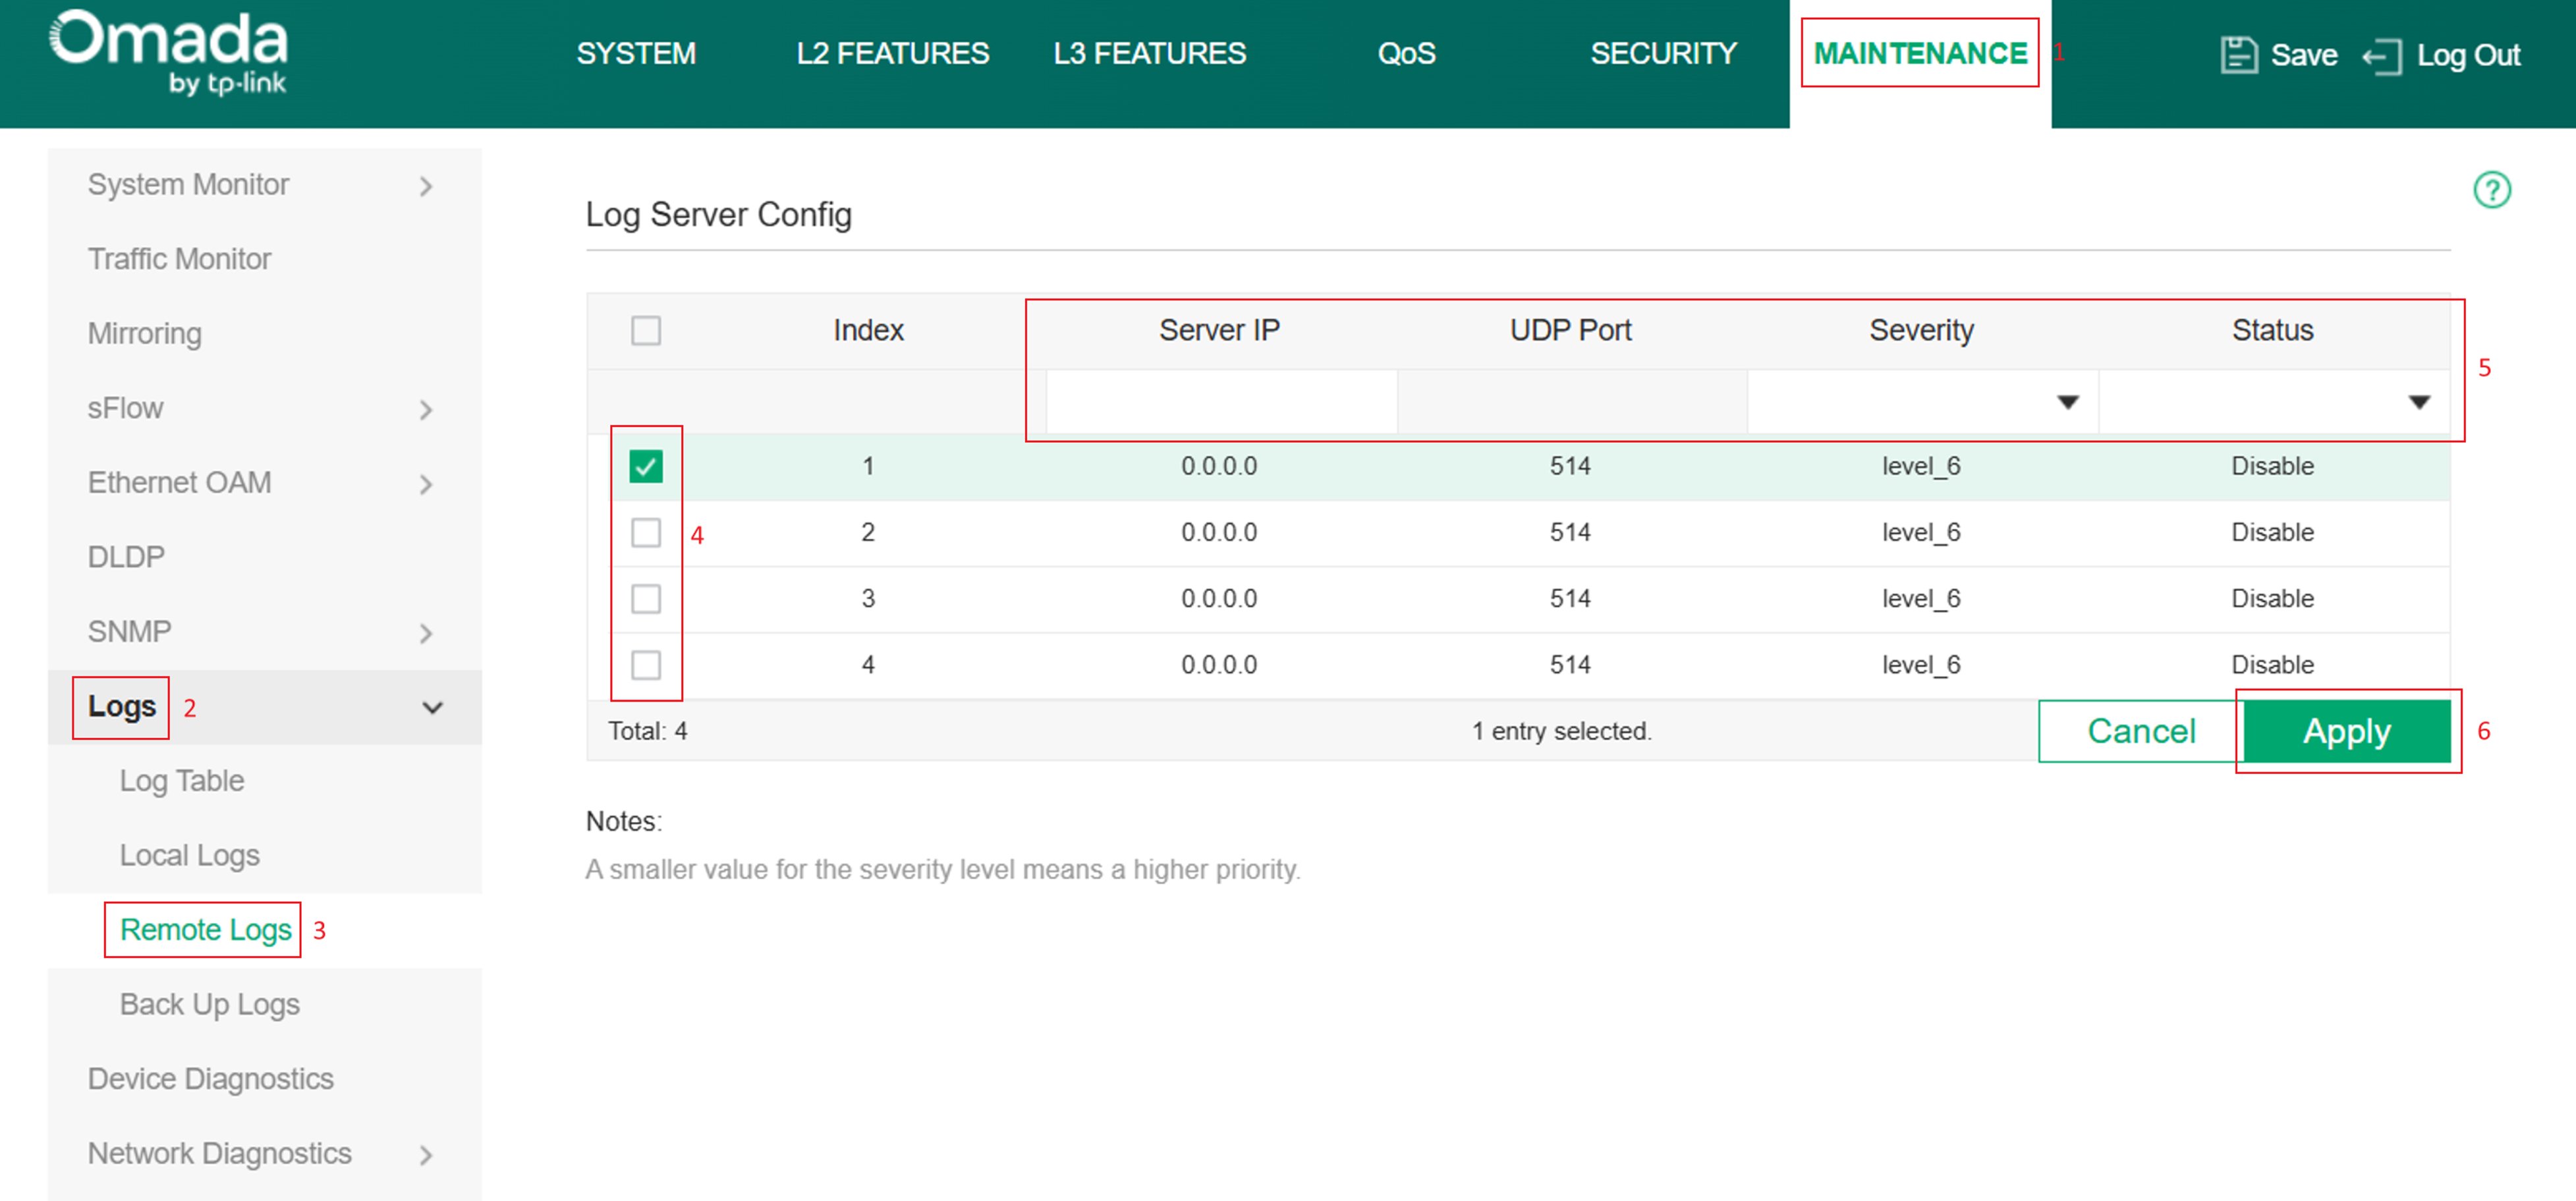
Step 3. Select an available log server entry.
Step 4. Configure the following parameters.
- Server IP: Enter the IP address of the Syslog Server.
- UDP Port: Specify the Syslog listening port. The default value is 514.
- Severity: Select the minimum severity level that will be sent to the Syslog Server.
- Status: Enable the log server entry
Note: Severity settings determine which log events are forwarded to the Syslog Server. Lower severity values represent higher-priority events.
Step 5. Click Apply to save the configuration.
After the configuration is completed, the switch will automatically forward matching log entries to the specified Syslog Server.
Note: The Syslog Server must be reachable from the switch. For security and management purposes, deploying the Syslog Server within the internal network is recommended.
Export local system logs
Step 1. Log in to the Switch's standalone web management interface.
Step 2. Navigate to Maintenance > Logs > Back Up Logs.
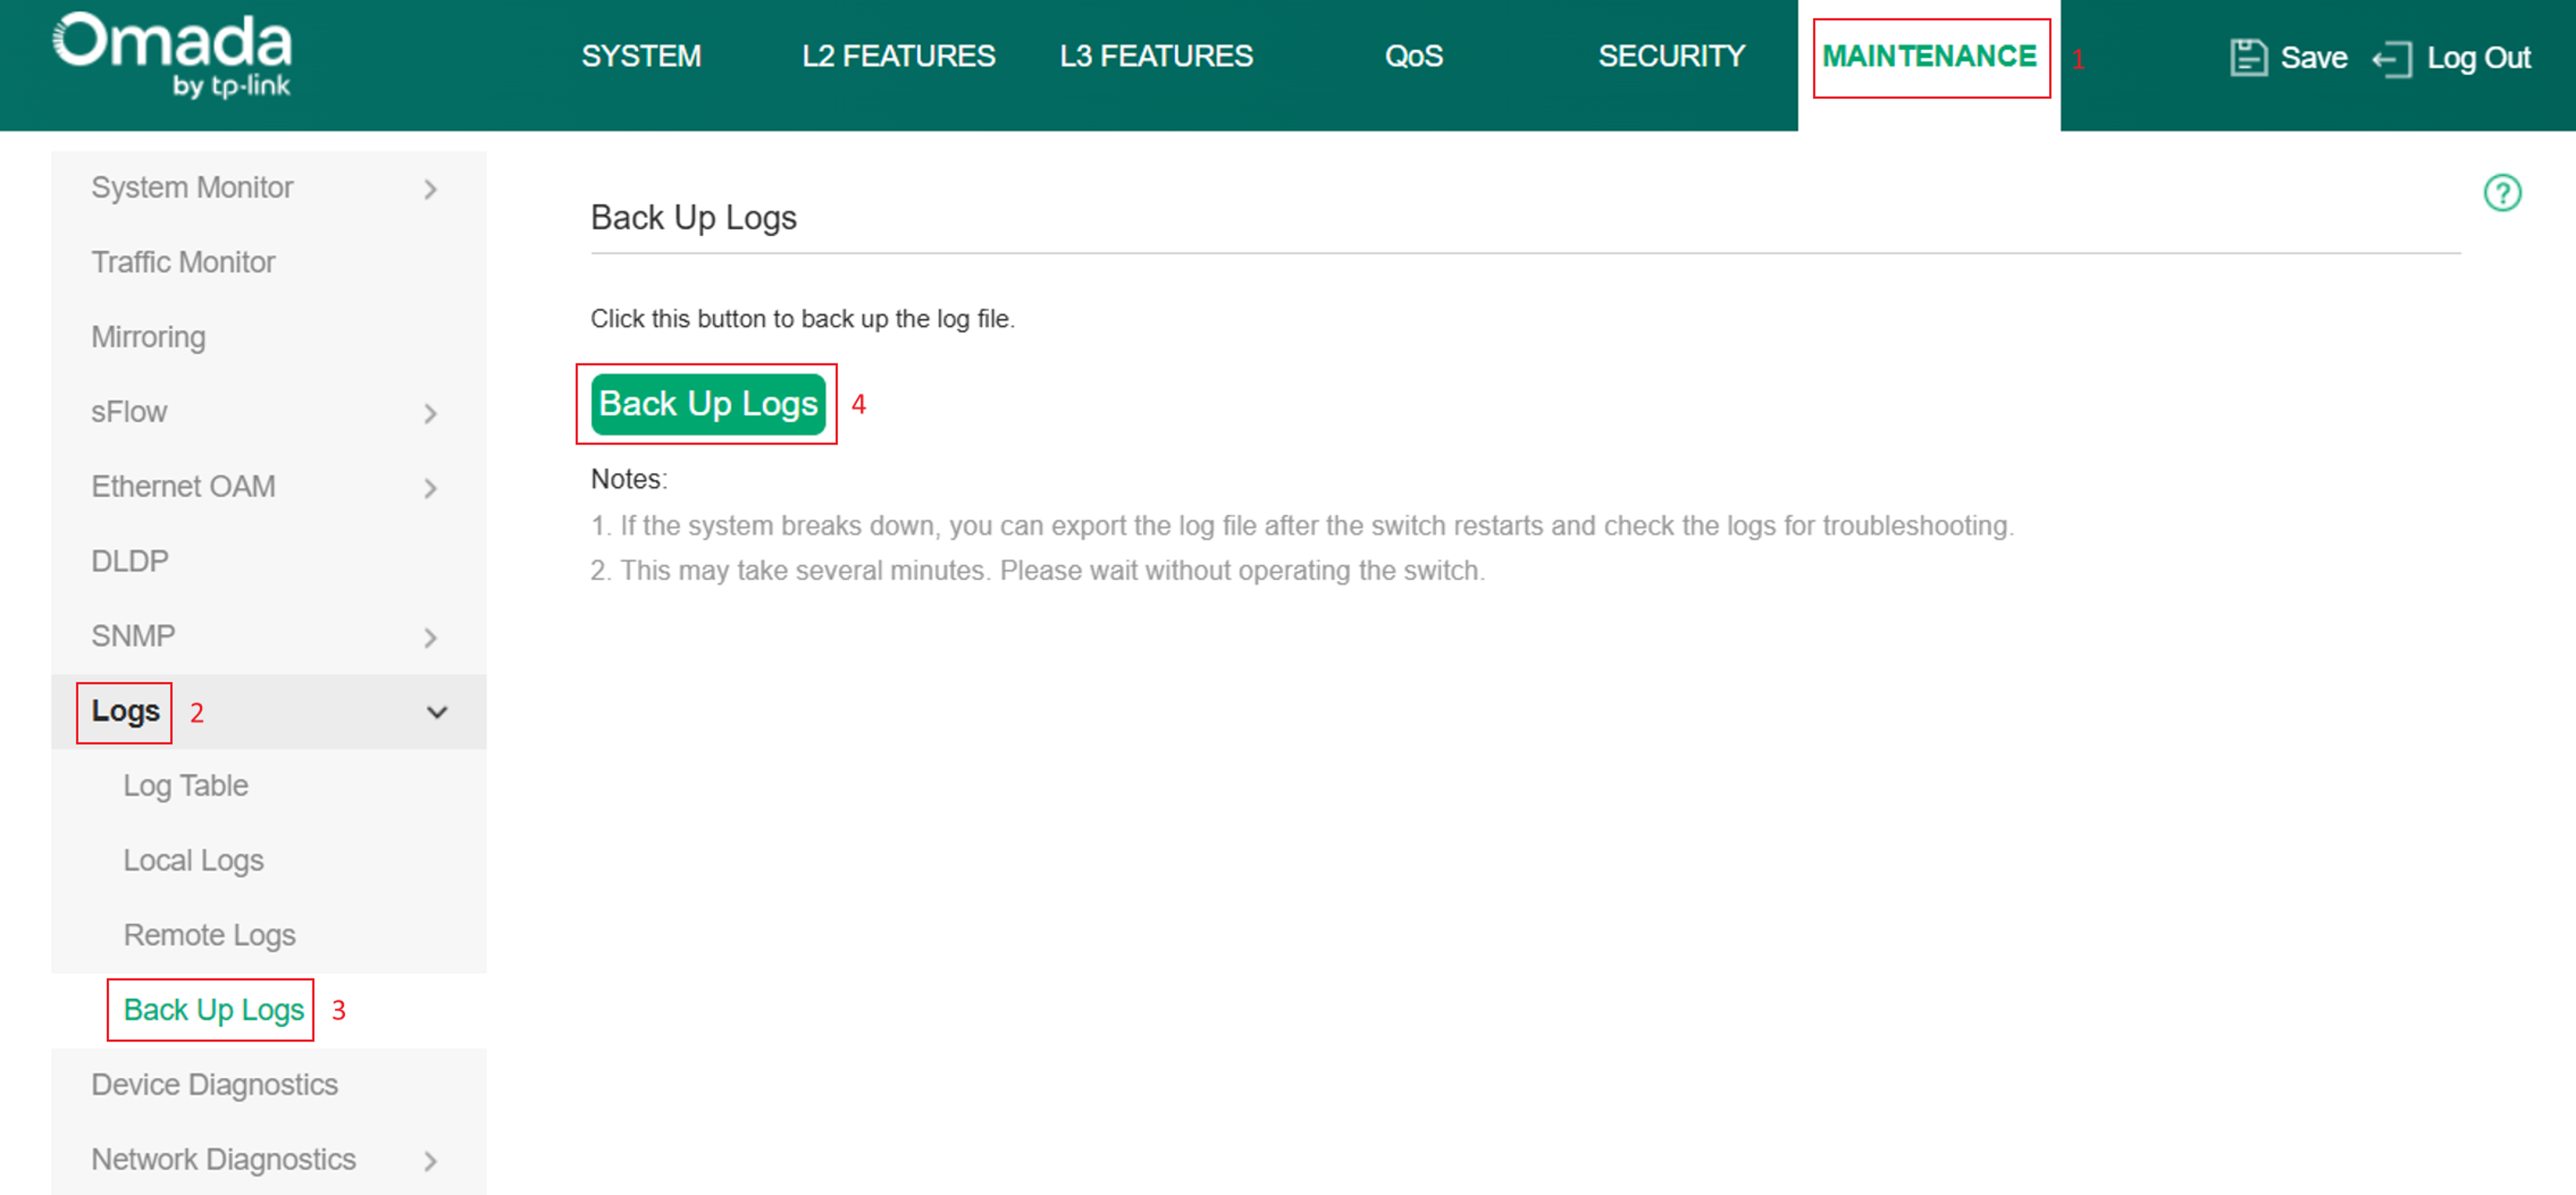
Step 3. Click Back Up Logs.
The switch will export the currently cached system logs as a log file and save the exported file to your local computer.
Note: It is recommended to export logs as soon as possible after the issue occurs to ensure that the relevant log entries are included in the exported file.
Export system logs from a standalone EAP
Standalone EAPs support forwarding system logs through email notifications or an external Syslog Server. Administrators can configure one or both methods according to their logging and troubleshooting requirements.
Note: Unlike some Omada Gateways and Switches, Standalone EAPs do not provide a local log export function through the web management interface.
If long-term log retention or remote log collection is required, you can configure the EAP to send logs through email notifications or forward them to a Syslog Server.
Step 1. Log in to the EAP's standalone web management interface.
Step 2. Navigate to Management > System Log.
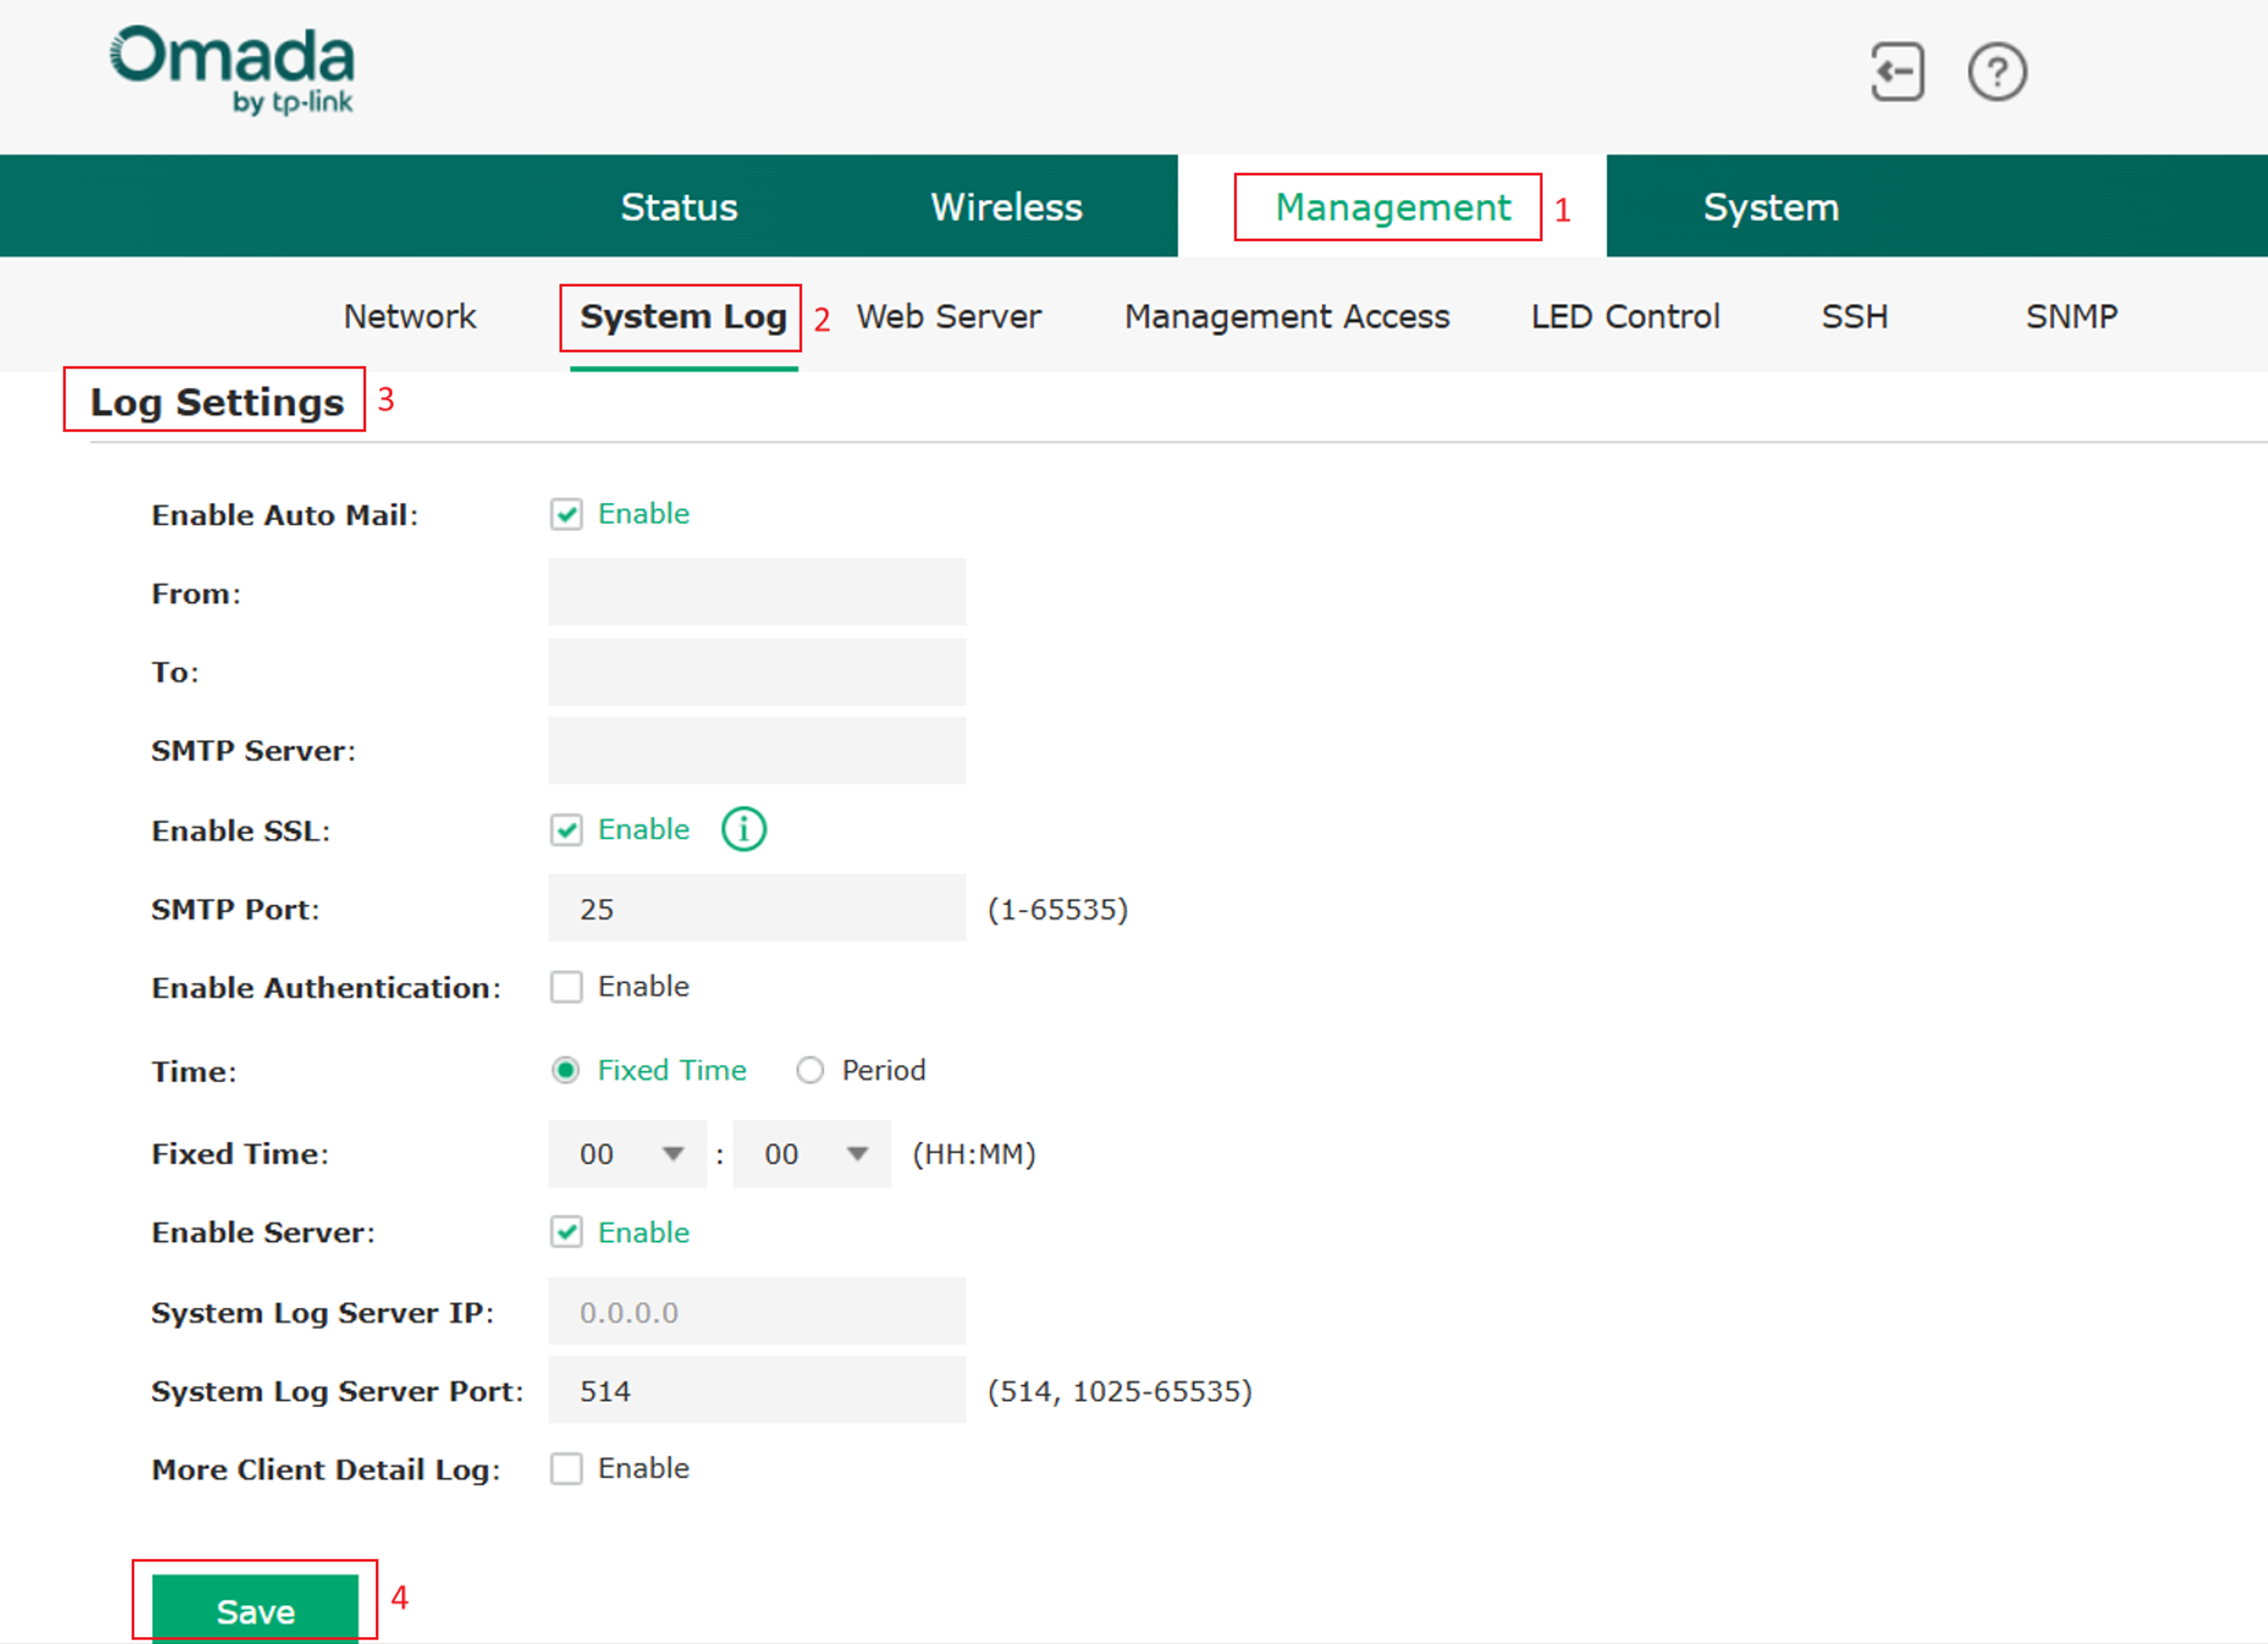
Configure email log delivery
Step 3. Enable Auto Mail.
Step 4. Configure the email parameters.
- From: Sender email address.
- To: Recipient email address.
- SMTP Server: SMTP server address.
- SMTP Port: SMTP service port.
- SSL: Enable SSL if required by the mail server.
- Authentication: Enable authentication if required by the SMTP server.
Note: Ensure that the SMTP server settings are configured correctly and that the EAP can reach the SMTP server. Otherwise, log emails may not be delivered successfully.
Step 5. Configure when logs should be sent.
You can choose:
- Fixed Time to send logs at a specific time every day.
- Period to send logs at regular intervals.
Configure a Syslog server
Step 6. Enable Server.
Step 7. Configure the Syslog Server settings.
- System Log Server IP: IP address of the Syslog Server.
- System Log Server Port: Syslog listening port. The default value is 514.
Note: Ensure that the Syslog Server is reachable from the EAP. The default Syslog port is 514 unless otherwise configured.
Step 8. Click Save to apply the configuration.
After the configuration is completed, the EAP will automatically send logs to the configured email recipient, Syslog Server, or both depending on the selected settings.
Conclusion
Exporting system logs is a key step in diagnosing and resolving issues in Omada networks. Whether devices are managed through an Omada Controller or operate in Standalone Mode, collecting logs provides essential information for troubleshooting connectivity issues, configuration problems, authentication failures, and other network events.
For advanced troubleshooting, Debug Log can be enabled on the Omada Controller to capture more detailed diagnostic information. Combining timely log collection with accurate issue reproduction can significantly improve troubleshooting efficiency and accelerate problem resolution.
To learn more about each function and configuration, please visit Support Home to download or check the manual for your product.
QA
Q1: When should I enable Debug Log?
A1: Debug Log should be enabled when troubleshooting issues that require detailed diagnostic information. It is recommended to enable Debug Log before reproducing the issue and then export the logs immediately afterward.
Q2: Do I need to collect logs from individual devices if they are managed by an Omada Controller?
A2: In most cases, no. Logs can normally be collected directly from the Controller. Additional device logs are only required if specifically requested by technical support.
Q3: Why are some older log entries missing from the exported log file?
A3: Omada devices maintain logs using a limited storage buffer. Older entries may be automatically overwritten when the log capacity limit is reached.
