


Contents
Configuration based on the Web UI
RRM, also known as Adaptive WLAN Optimization
Advanced Optimization Settings
Configuration based on the Omada app
RRM, also known as Adaptive WLAN Optimization
Advanced Optimization Settings
Introduction
The wireless optimization feature intelligently analyzes and automatically adjusts parameters such as channels and bandwidth, thereby reducing overall wireless interference and enhancing the stability and speed of the network.
RRM (Radio Resource Management) is a kind of wireless optimization feature that automatically improves Wi‑Fi performance by intelligently managing radio resources in the network.
RRM continuously analyzes the wireless environment and dynamically adjusts key parameters—such as channels, transmit power, and bandwidth—to reduce interference, improve coverage, and deliver a more stable and efficient Wi‑Fi experience.
Wireless connection is susceptible to environmental interference, which may cause an unstable connection. In this case, we need to do optimization to make Omada EAPs work with less interference and a clearer channel, or adjust transmission power and bandwidth to get better performance. RRM (Adaptive WLAN Optimization feature in Omada Network Application) is a function that can intelligently optimize WLAN performance based on real-time interference detection. In this article, we will introduce how to configure WLAN Optimization based on the Omada Network Application web UI and the Omada App, respectively.
Requirements
- Omada Network v6.2.10 or above
- Omada EAP devices that support RRM
- Omada App v5.2.1 or above
Configuration
Manual WLAN Optimization
Step 1. After completing the SSID configuration, go to Network Config > Network Settings > WLAN > WLAN Optimization.
Step 2. Configure WLAN Optimization.
Once the Optimization button is clicked and confirmed, wireless optimization starts immediately. The process typically takes a few minutes, during which the wireless network may be interrupted.
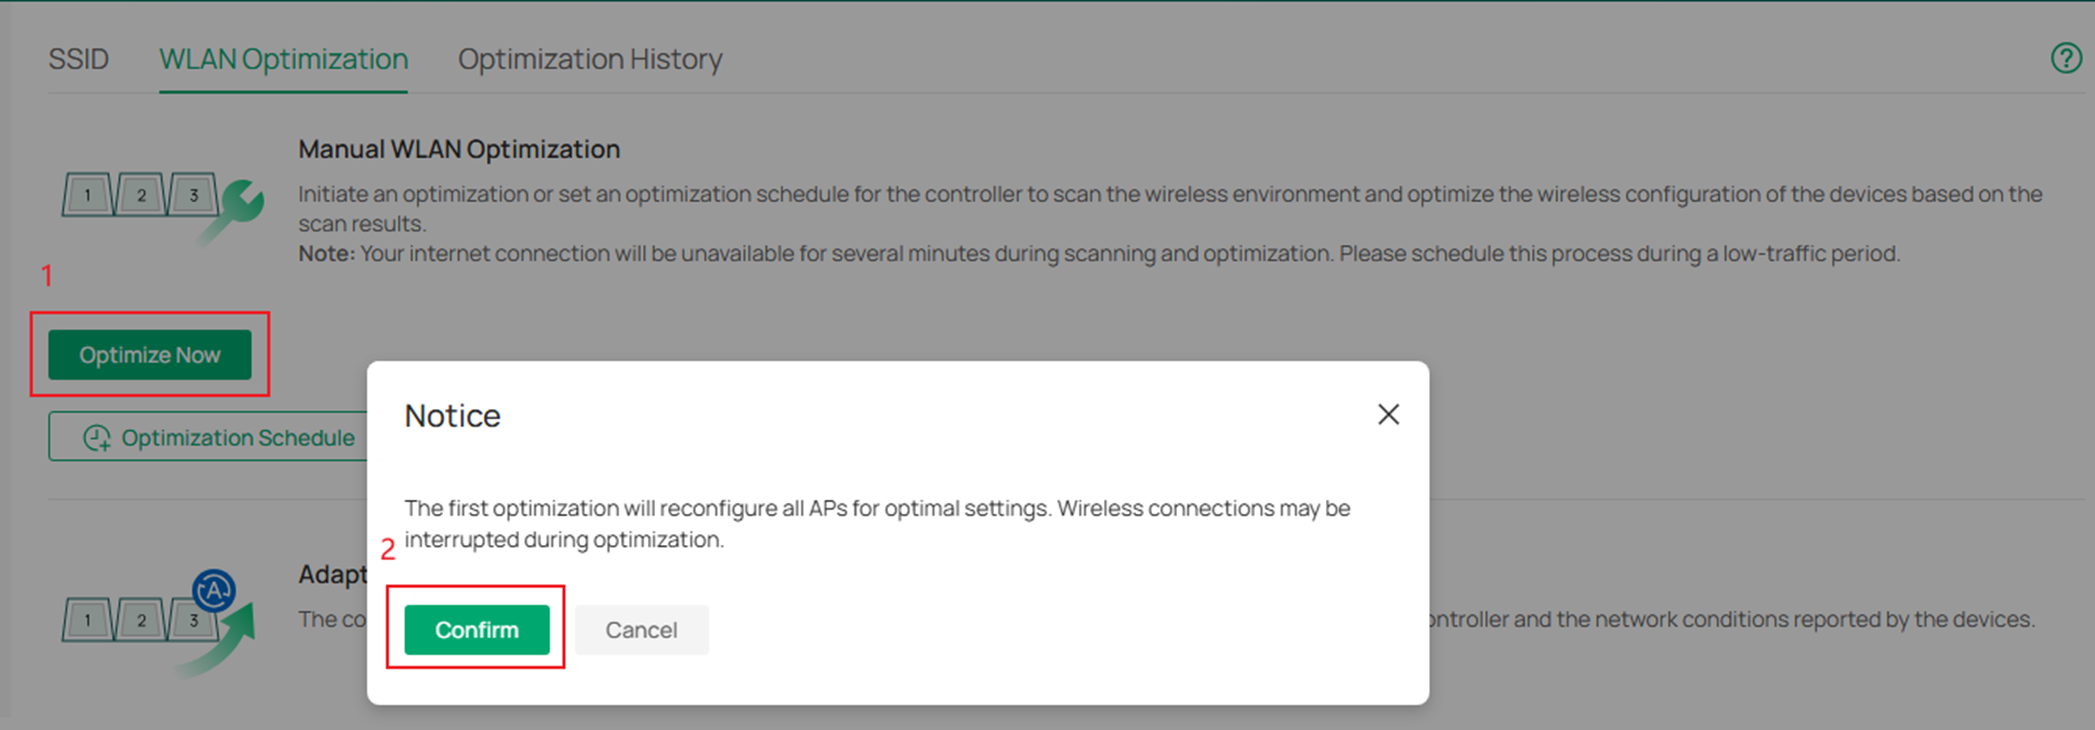
Note: The APs in the MESH network cannot perform wireless optimization.
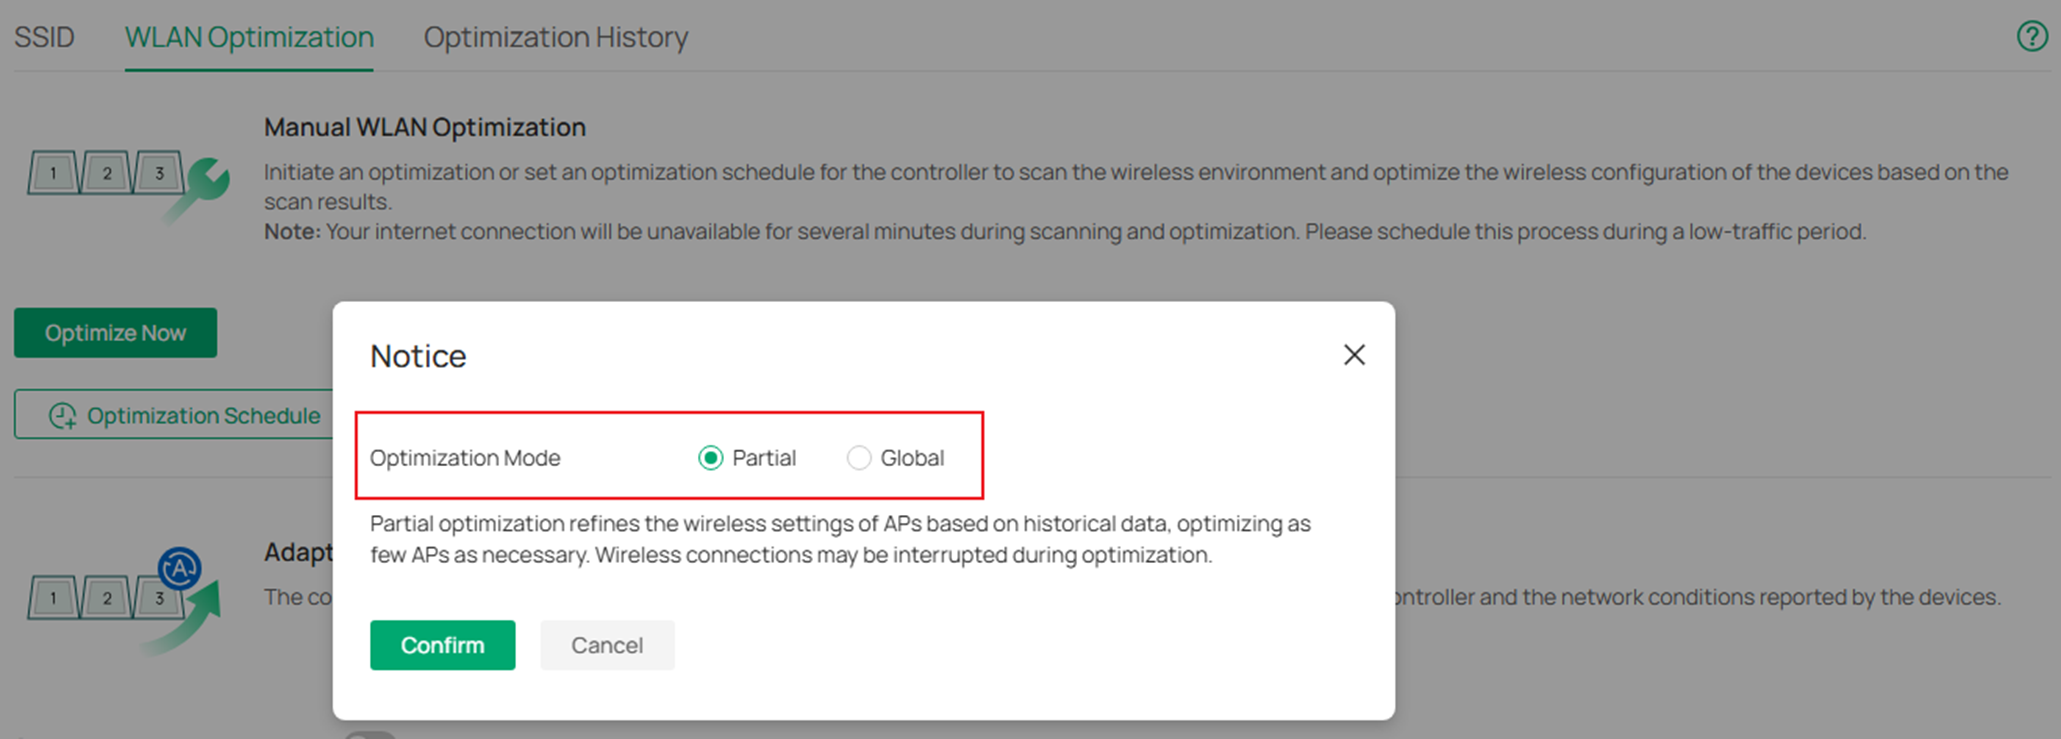
When manually performing optimization operations later, you can choose between partial or global optimization modes.
To optimize the wireless network on a scheduled basis, you can configure a schedule by selecting the optimization time and frequency. The schedule follows the site’s configured time zone.
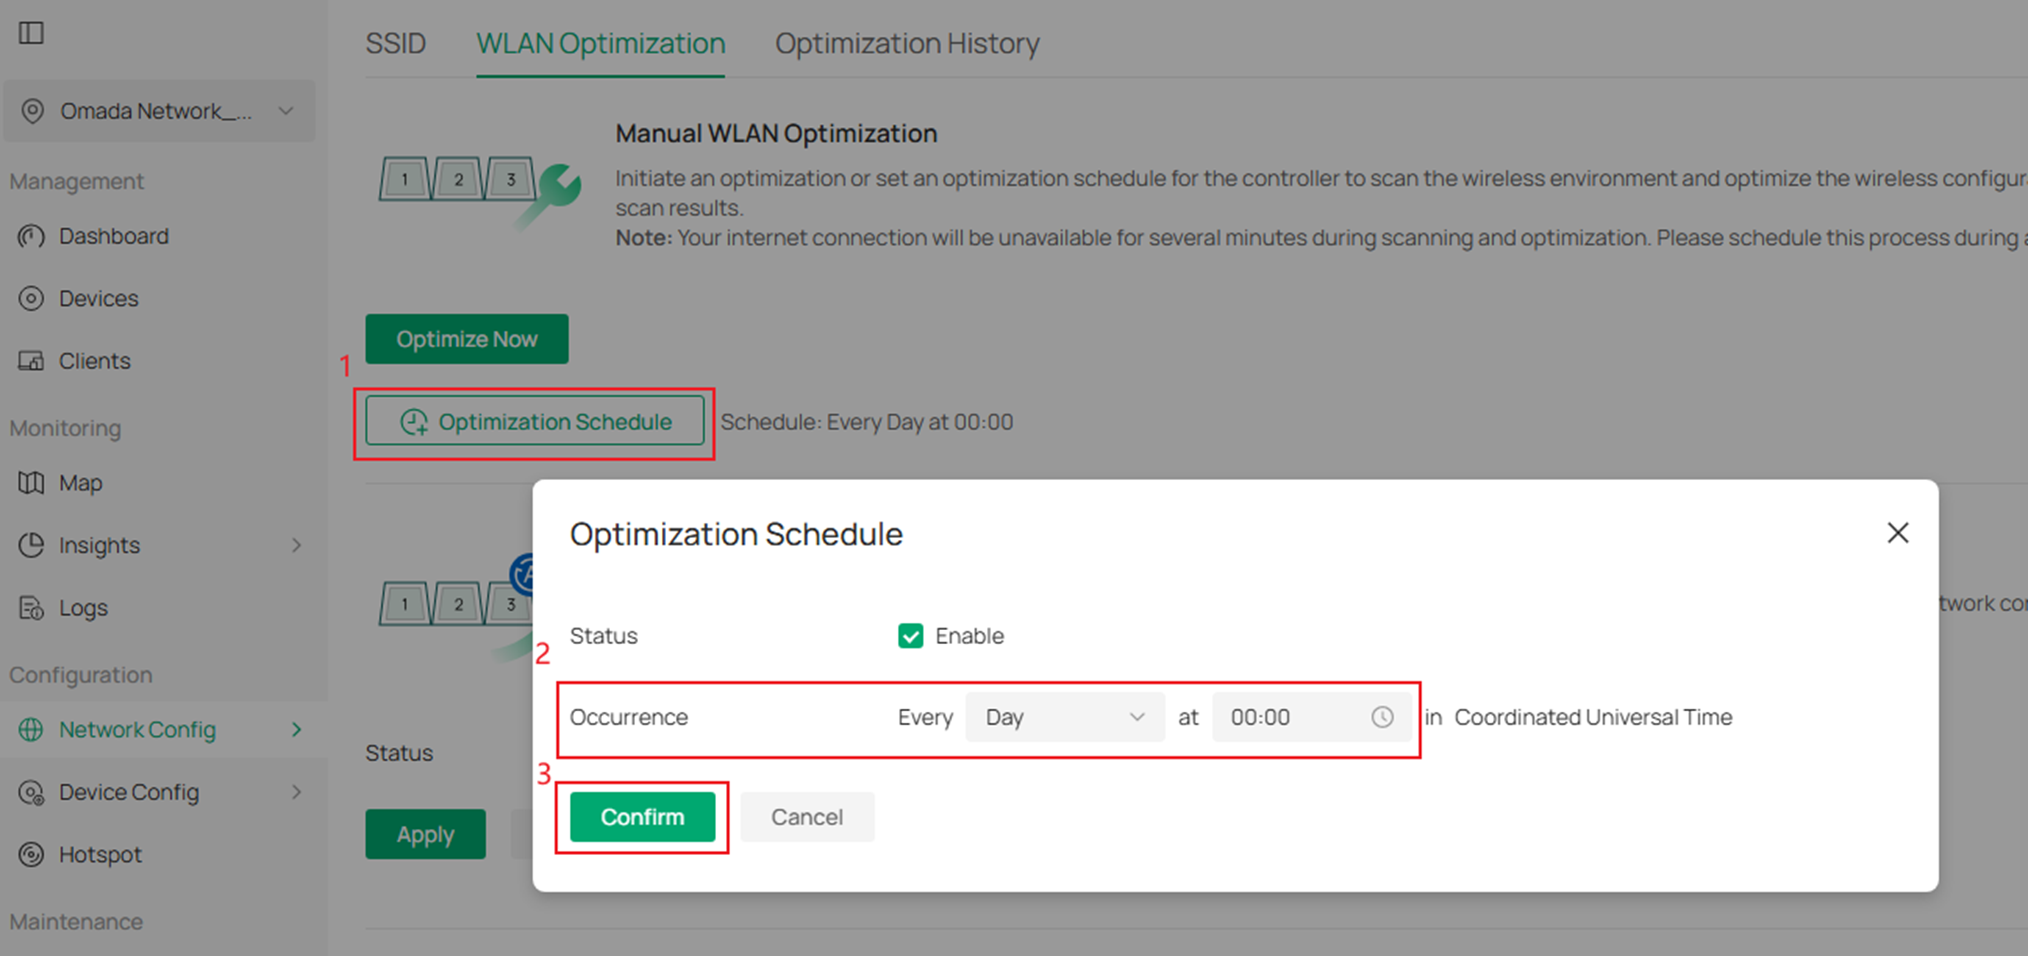
Note: It is recommended to schedule wireless optimization during periods that have minimal impact on users, such as late at night or early morning.
RRM, also known as Adaptive WLAN Optimization
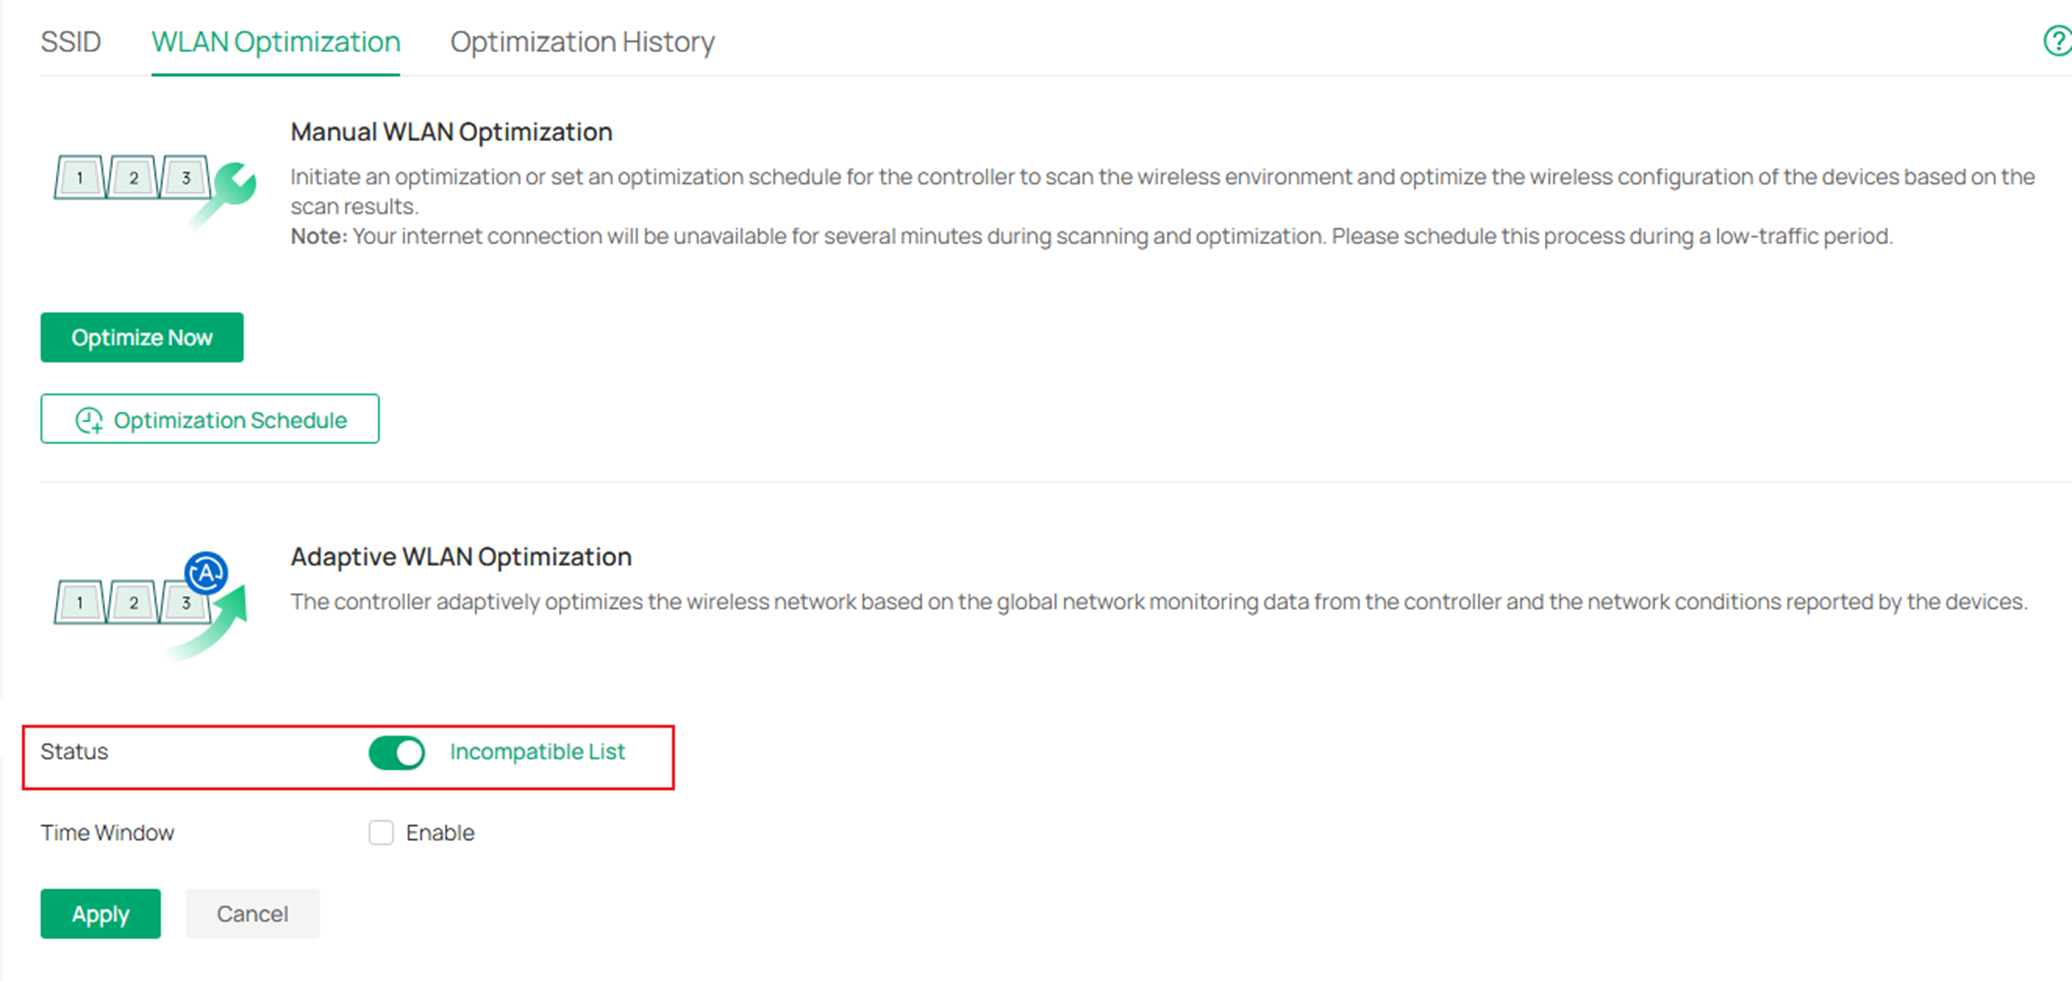
Step 1. After completing the SSID configuration, go to Network Config > Network Settings > WLAN > WLAN Optimization, enable the Status button under Adaptive WLAN Optimization.
If there are some APs in your site that are not compatible with WLAN optimization features, they will be displayed in the Incompatible List.
Note: After you apply, a manual WLAN Optimization will be executed immediately.
Note: To enable your Omada EAP to support RRM, you need to upgrade the firmware of Omada EAP to the version that supports RRM. For details, please refer to the release notes on the Omada website.
For updating your Omada EAP firmware, please refer to How to Upgrade EAP Firmware in Different Management Modes.
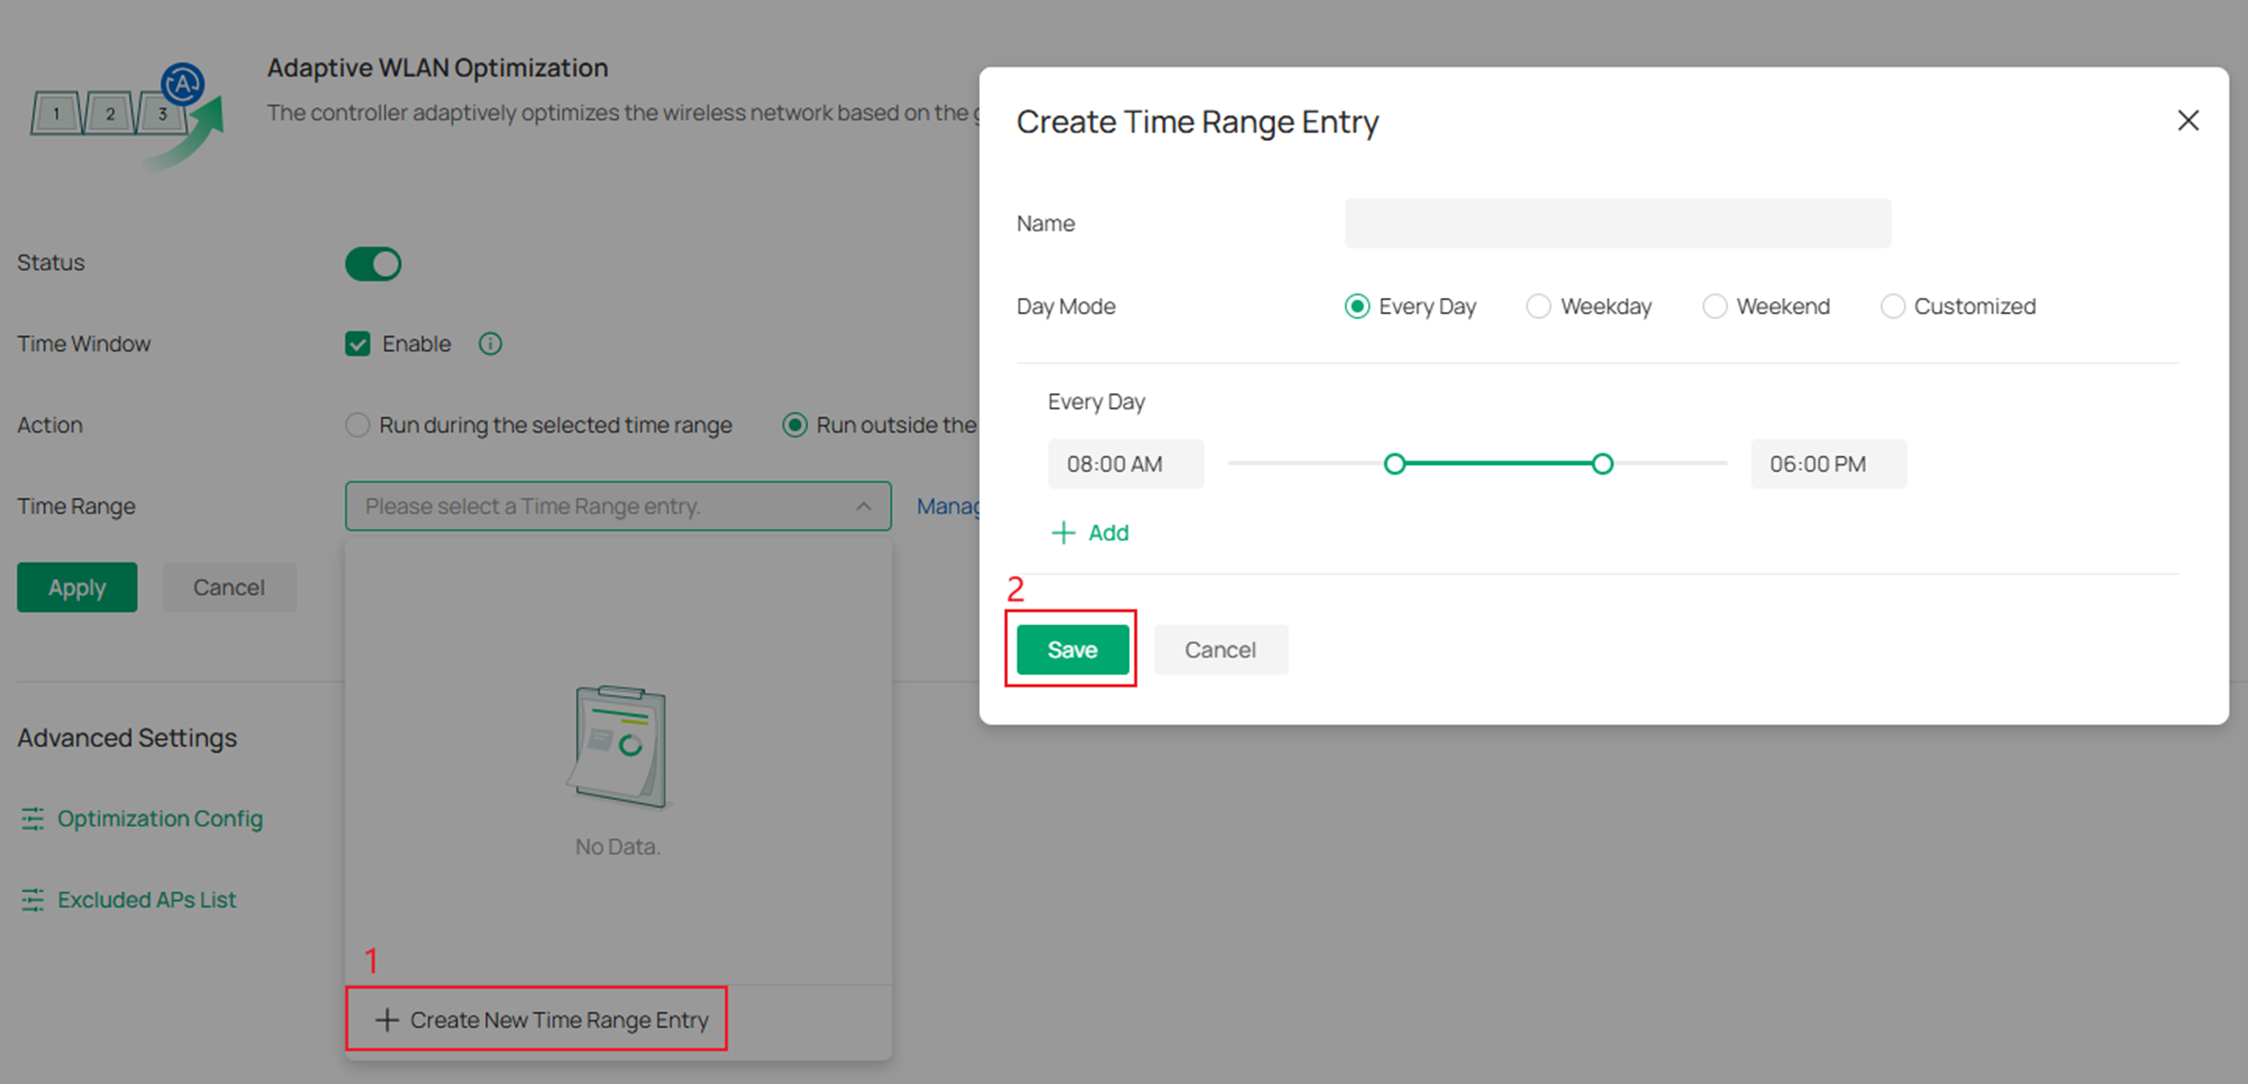
Step 2. Configure the Time Range during which the WLAN Optimization will be executed.
Advanced Optimization Settings
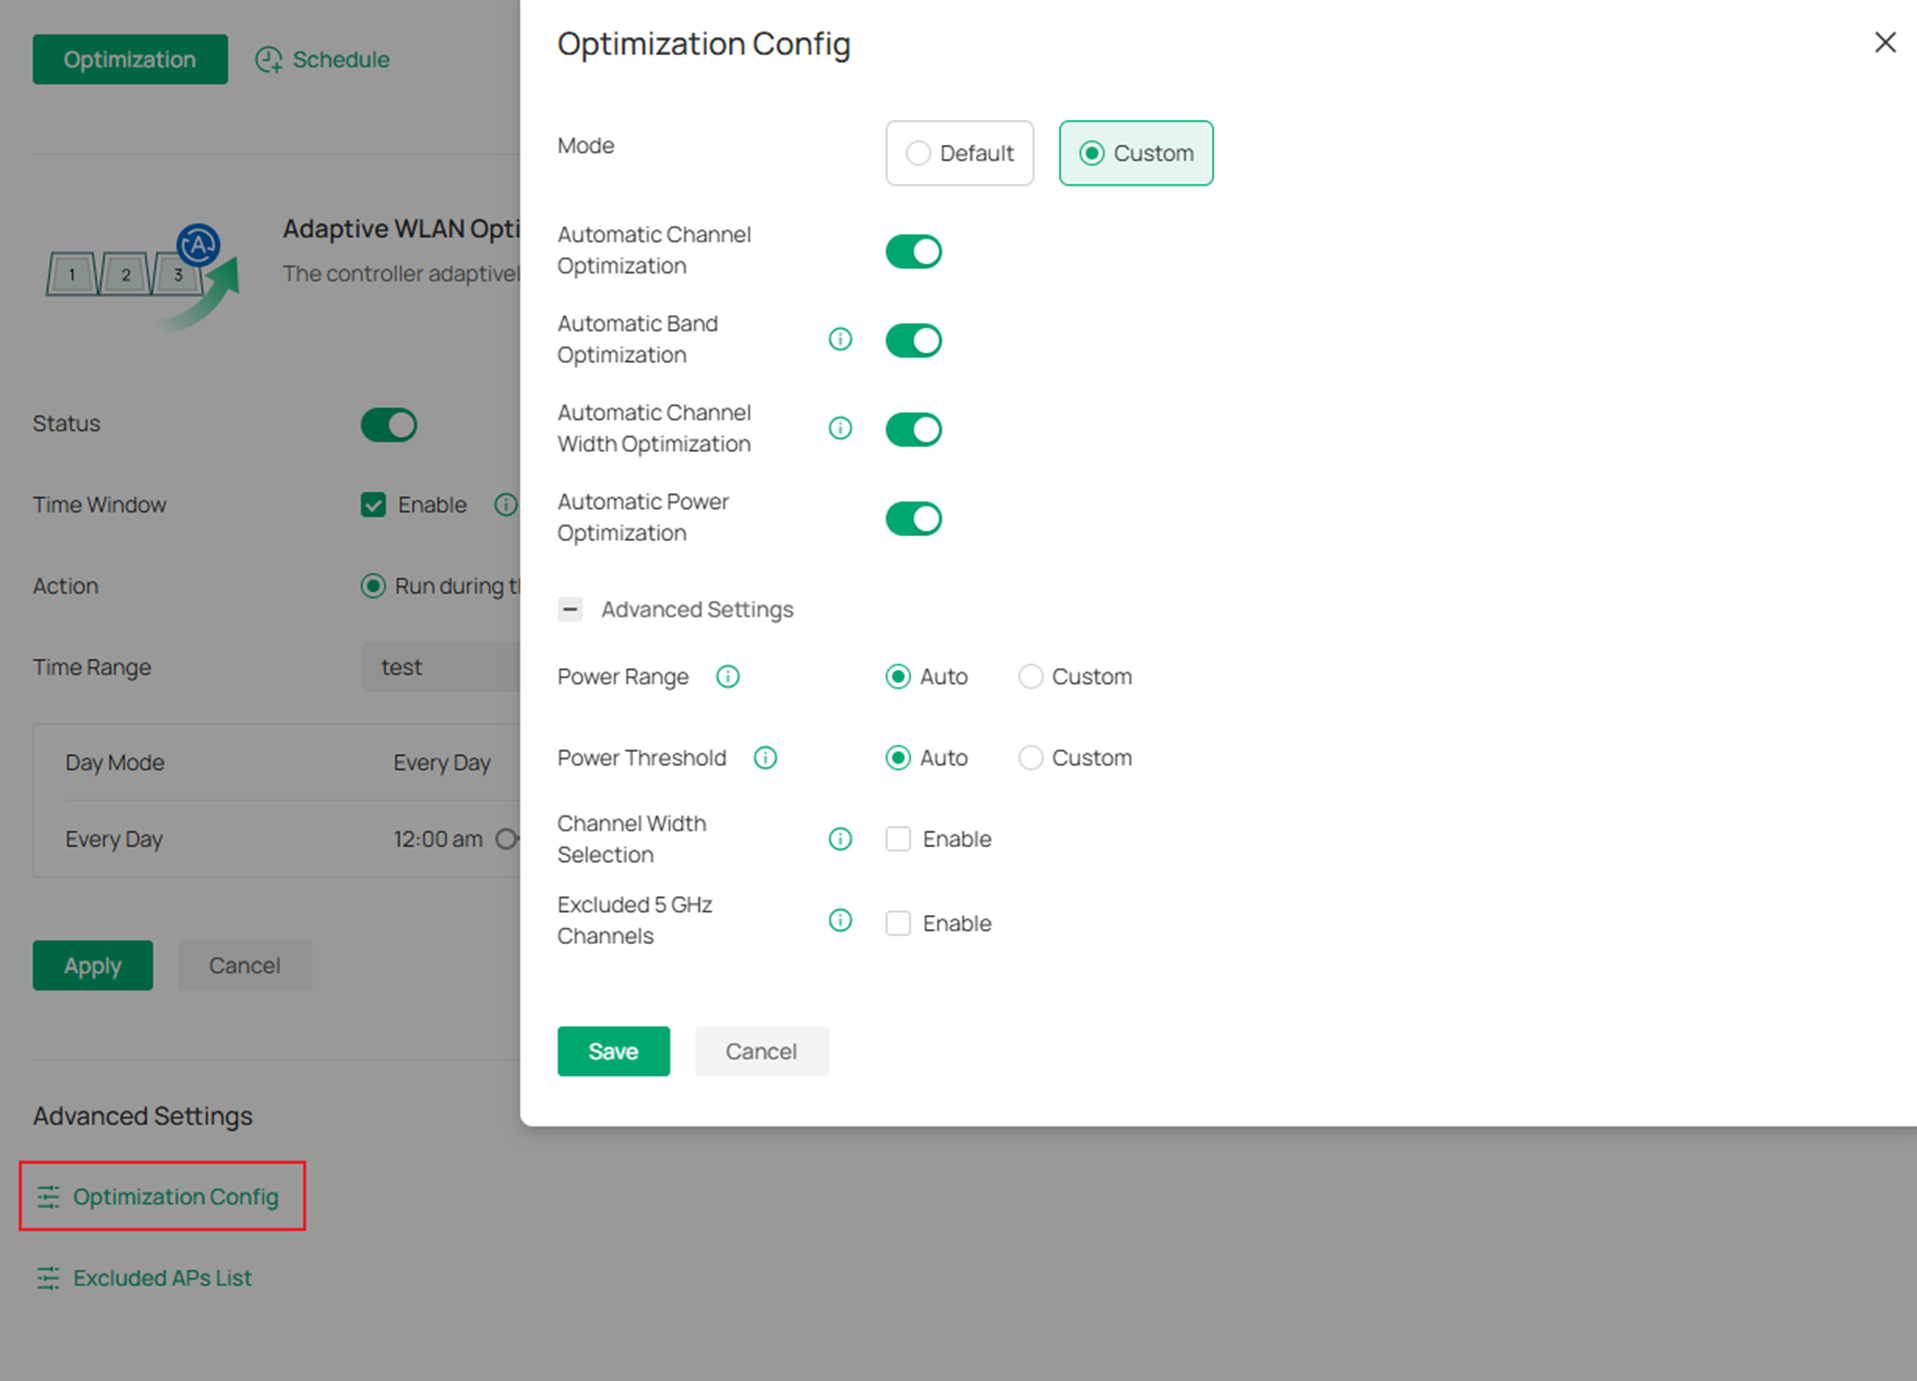
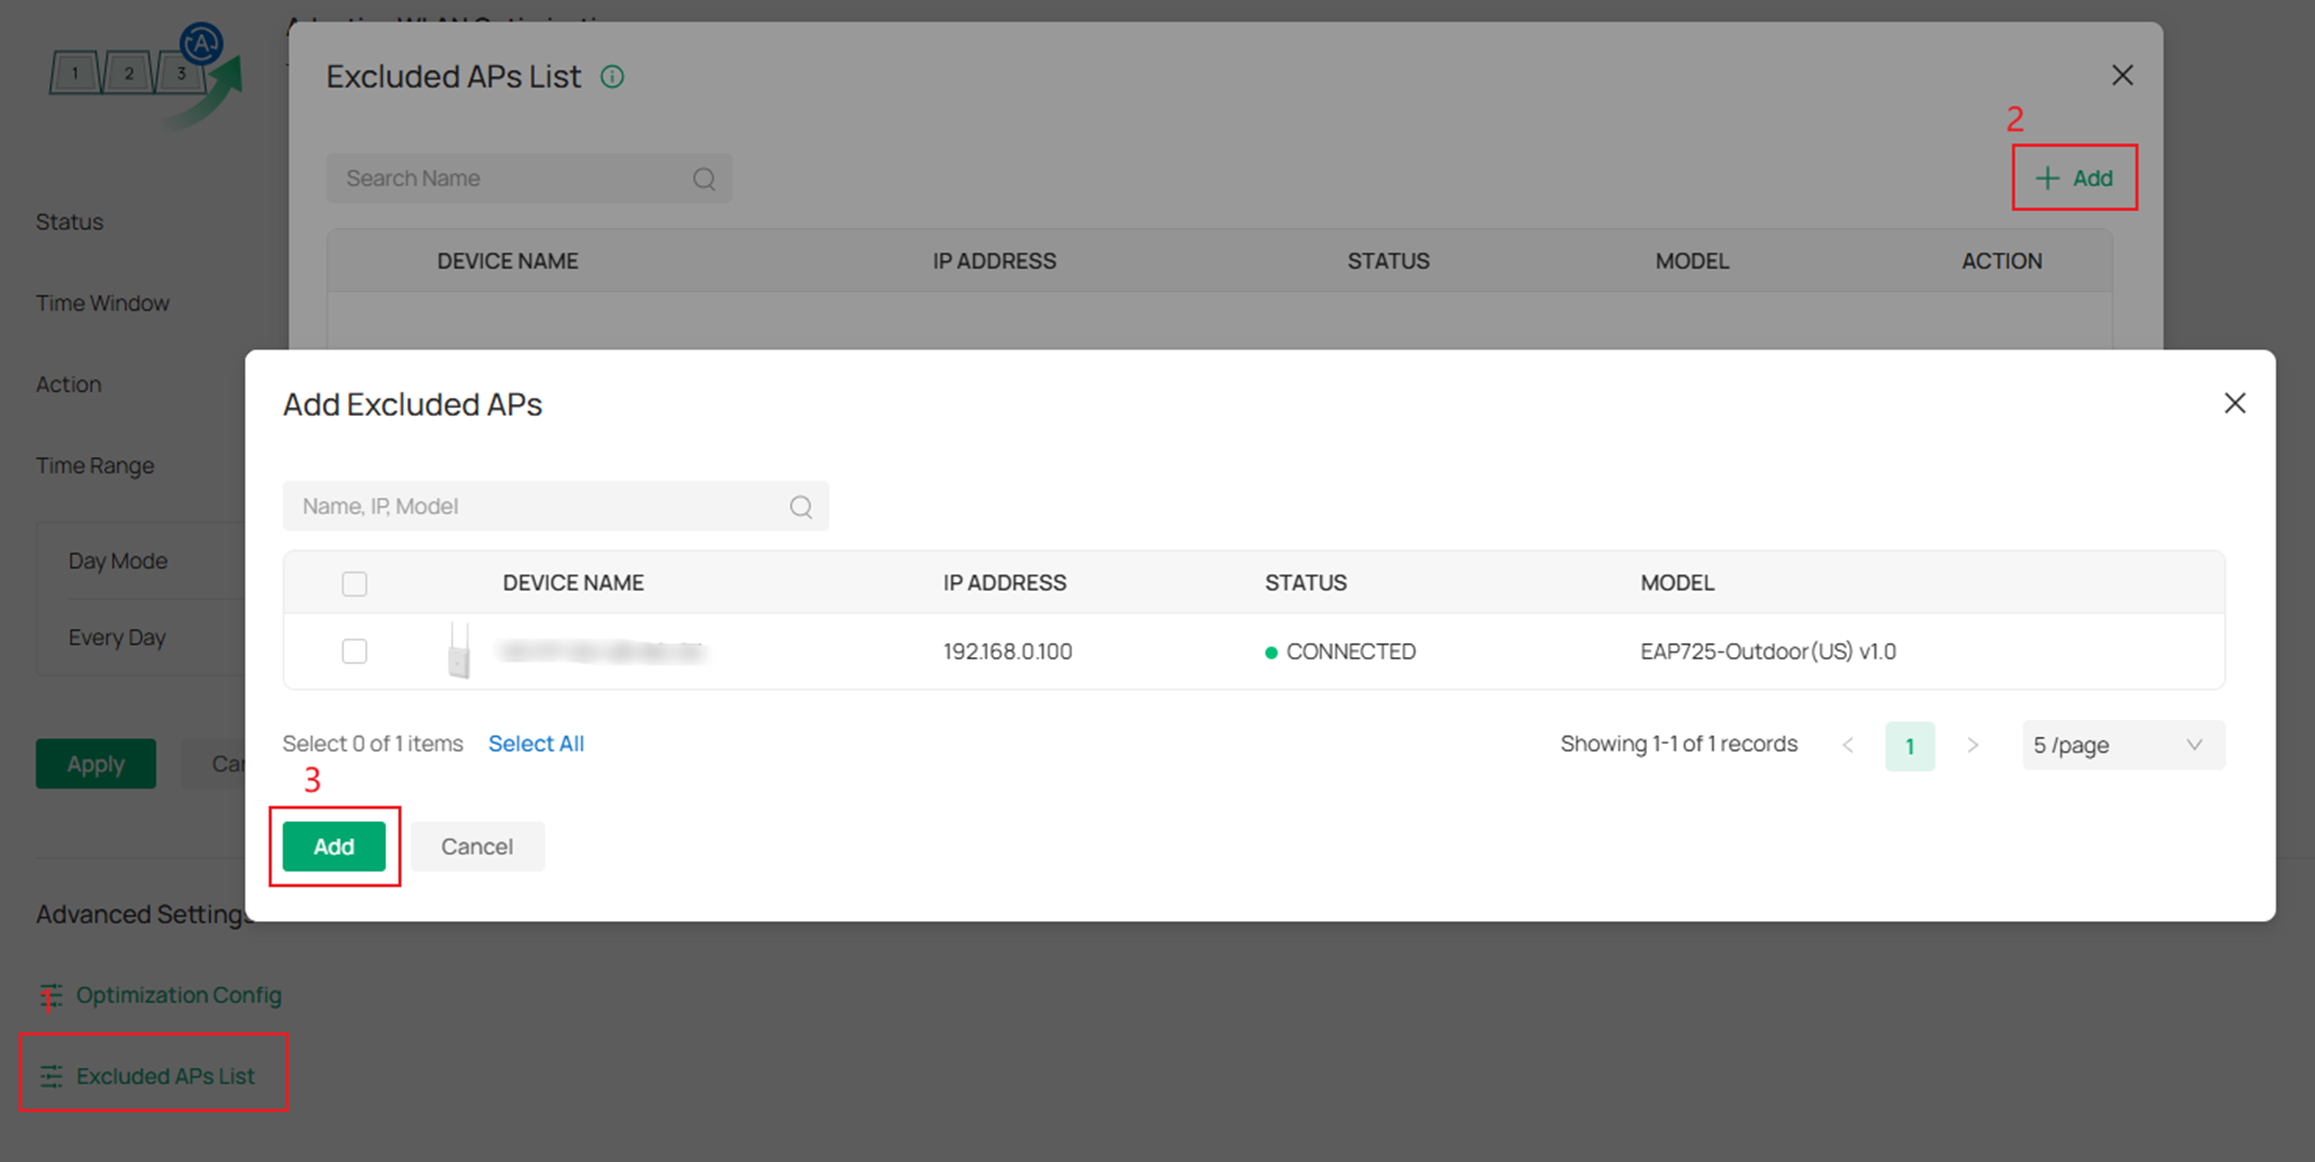
Step 1. You can customize optimization parameters in Advanced Settings>Optimization Config or prevent certain APs from participating in wireless optimization in Advanced Settings>Excluded APs List. These settings apply to both Manual and Adaptive WLAN Optimization.
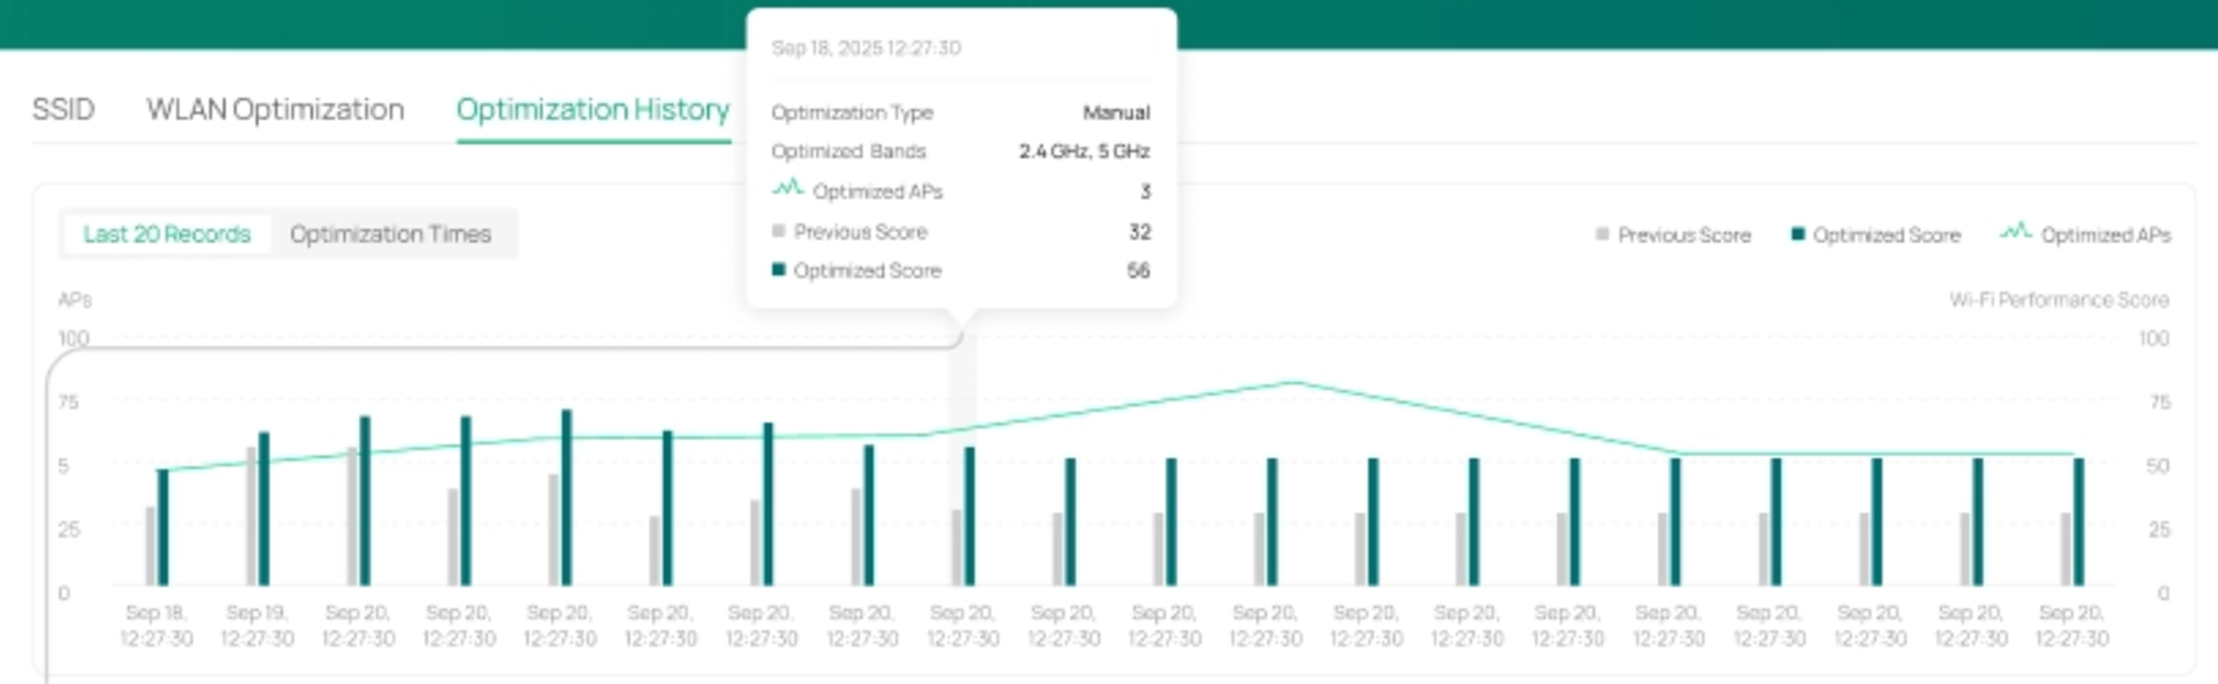
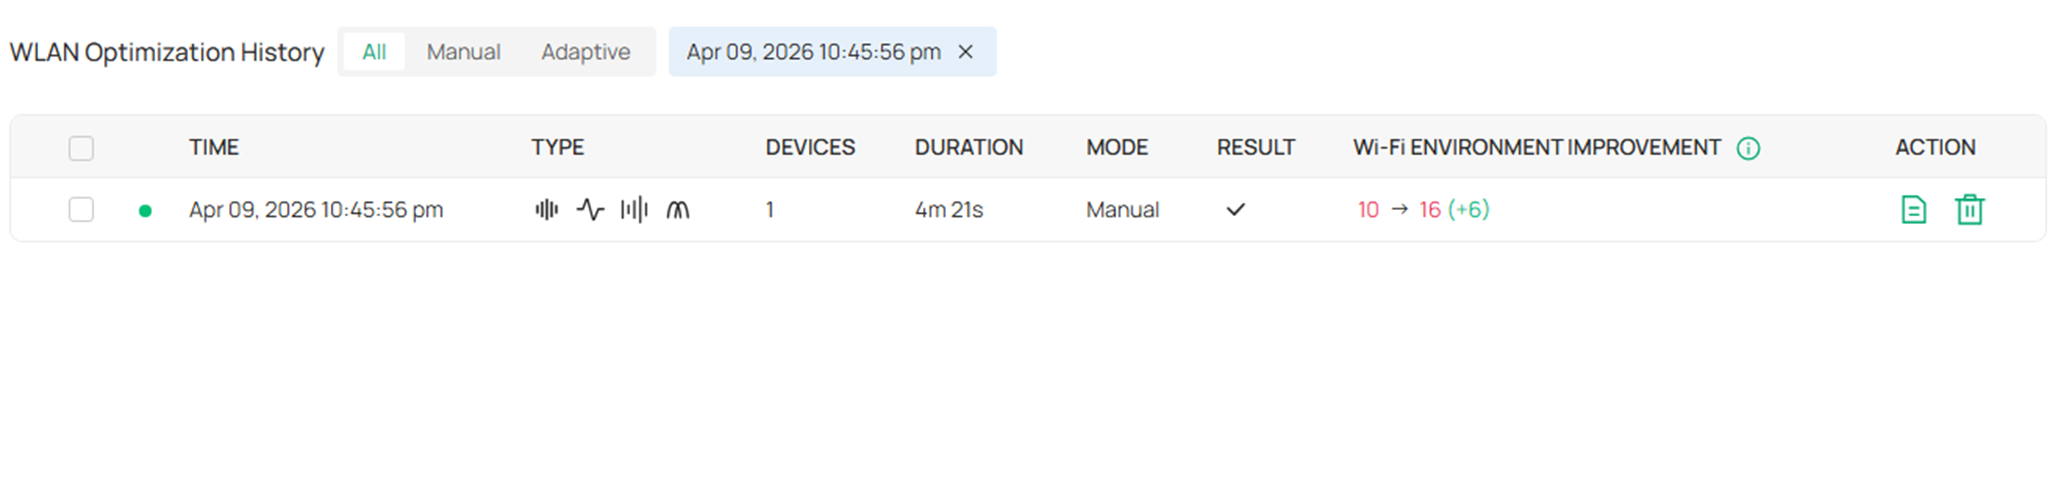
Step 2. Click Optimization History at the top, you can see all optimization records here, you can see details of successful records, and choose to delete all records.
When the device detects strong interference or Radar waves and triggers automatic optimization, as well as when you perform manual optimization, all of these actions are recorded and displayed in the charts.
In Last 20 Records chart, the horizontal axis represents the time when WLAN optimization occurred. The vertical axis shows the number of APs affected by each WLAN optimization event and the network status scores before and after the optimization. The left vertical axis corresponds to the AP count, while the right vertical axis corresponds to the Wi-Fi Performance Score. The line chart represents the AP count. There are two bar charts, representing the scores before and after WLAN optimization. When clicking on a data point, the history record table below displays only the corresponding record.
In Optimization Times chart, the horizontal axis represents data aggregated over a period of time, and you can switch the time range to 1 day or 1 week. The vertical shows the number of wireless optimization events that occurred during the selected period. The line charts at the top represent manual and adaptive optimizations respectively. When you hover over the line chart, the specific timestamp and the number of optimization events are displayed. Clicking on a data point in the line chart filters the wireless optimization entries in the WLAN optimization history list below to those that occurred within the selected sampling period.
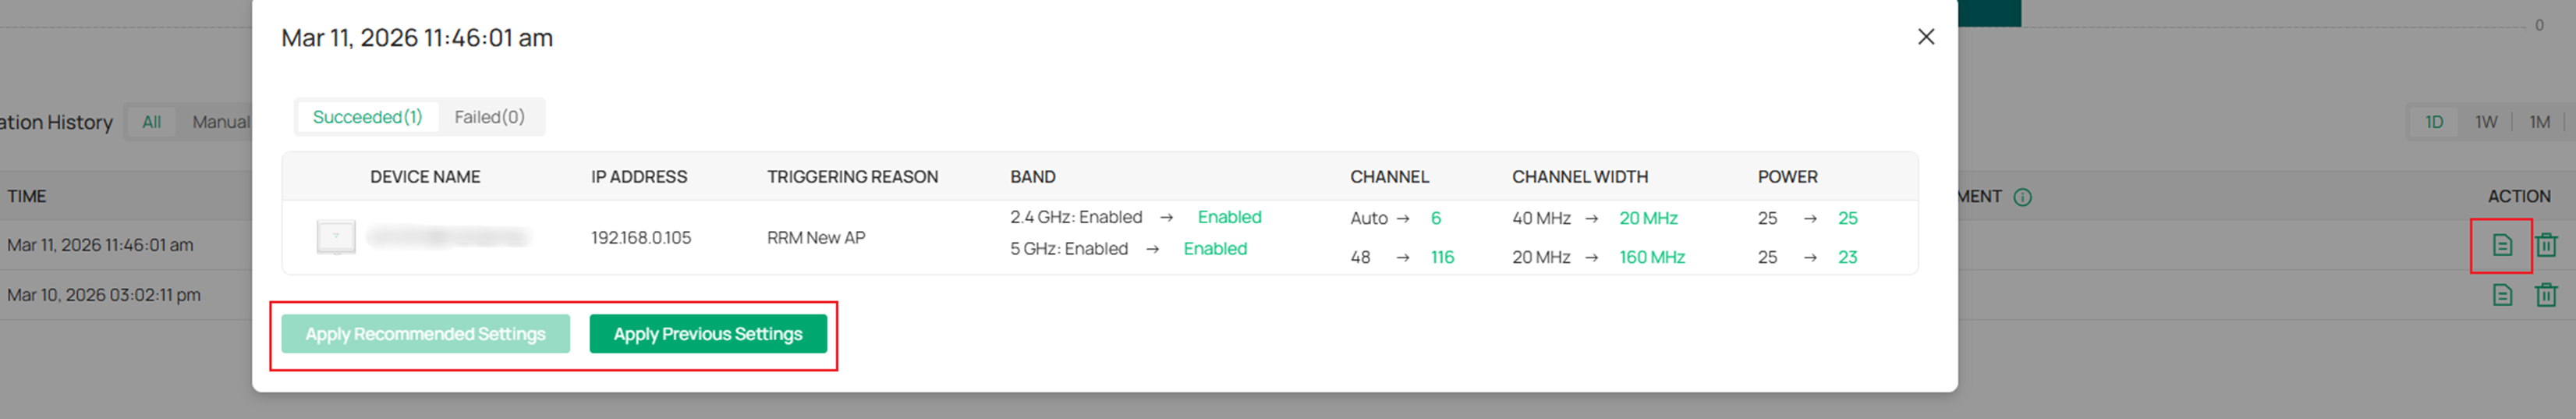
Click the Detail button on the right, and you'll see what operations are taken to make your network work better.
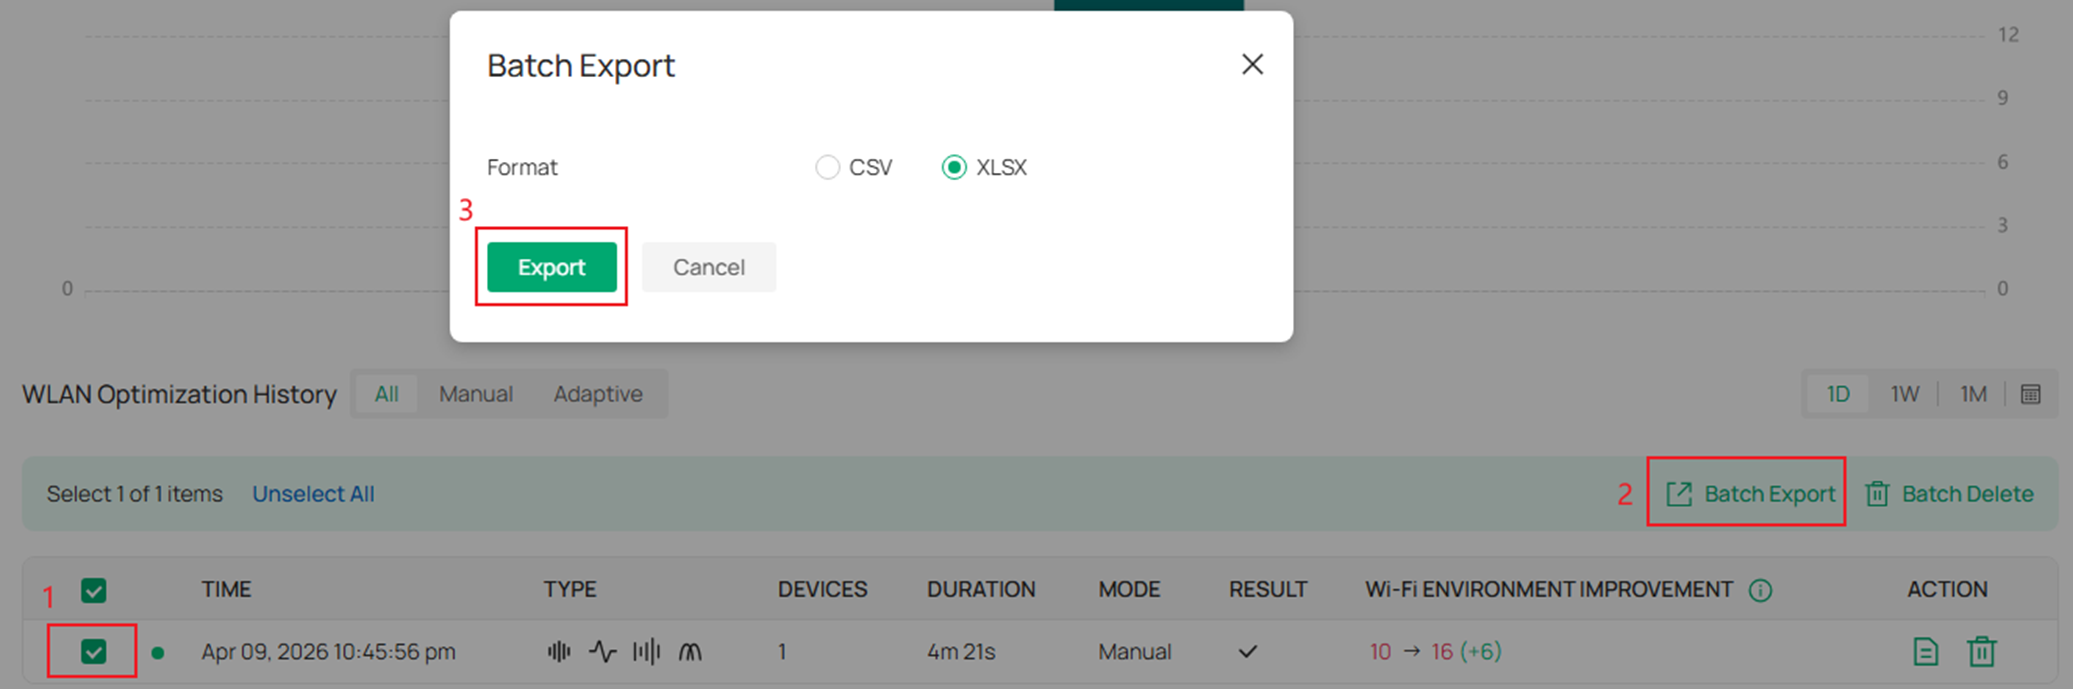
After selecting the corresponding historical records, they can be exported in the form of CSV or XLSX files.
Network Monitoring
The statistical data on wireless optimization can be viewed on the Dashboard>WiFi page, including CCI and AP Density.
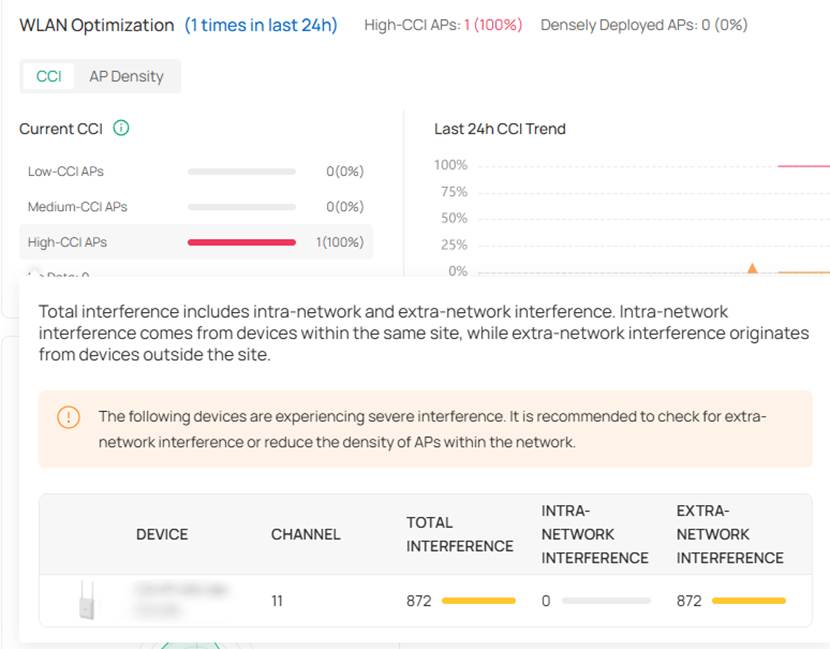
Co-channel interference (CCI) indicates the degree of interference experienced by APs on the same channel.
CCI ≥ 70: Strong interference.
40 ≤ CCI < 70: Moderate interference.
CCI < 40: Weak interference.
The CCI interface is divided into a bar chart on the left and a line chart on the right. The bar chart displays the data from the latest sampling, showing the proportion of AP devices in three levels, as well as the proportion and device count. When you hover over the corresponding entry, specific device information can be displayed.
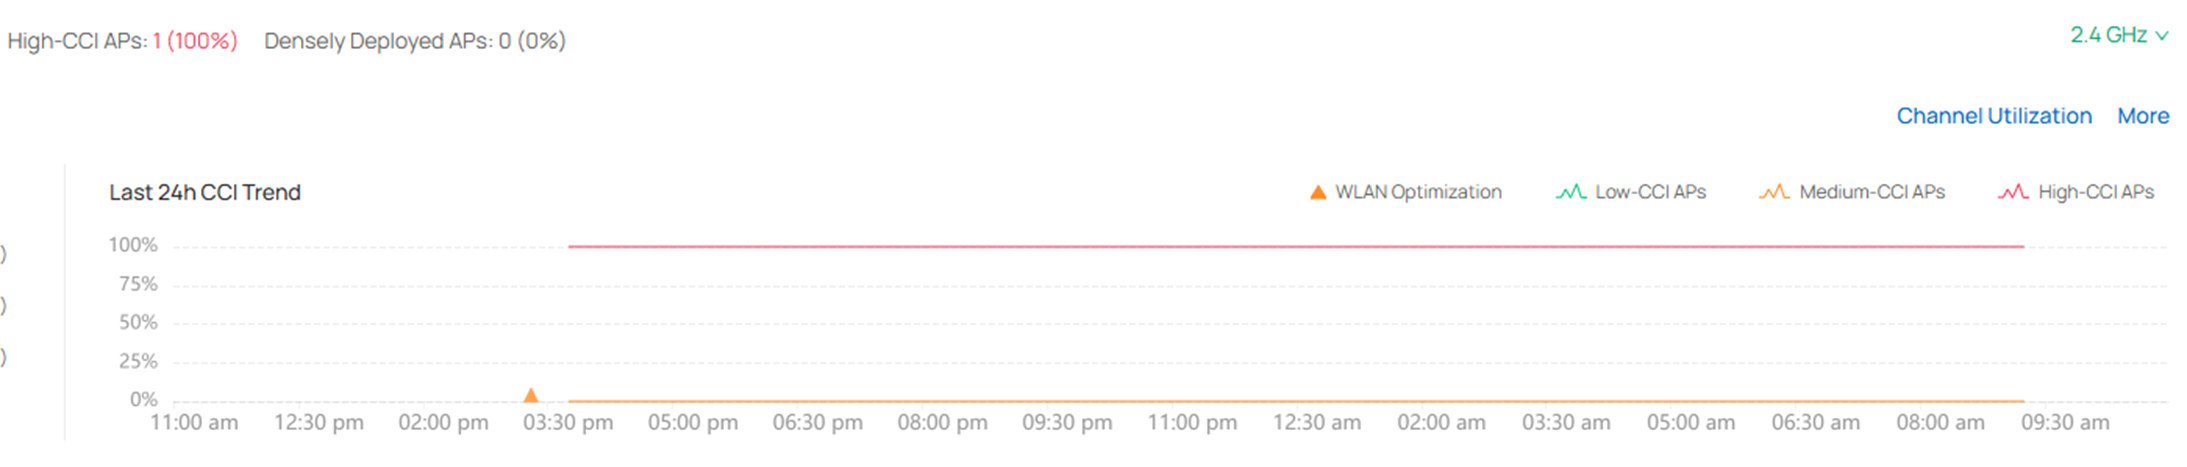
The line chart on the right shows the trend of APs’ CCI with different levels of interference, with data recorded every 30 minutes.
You can switch to 2.4G/5G/6G band in the upper right corner.
There are two key pieces of information about CCI: intra-network interference and extra-network interference. Intra-network interference comes from devices within the same site, while extra-network interference originates from devices outside the site. Some optimization suggestions are as follows.
For high intra-network interference:
Optimize channel allocation.
Perform manual WLAN optimization.
Adjust transmit power.
Optimize AP deployment density
For high extra-network interference:
Prefer less congested frequency bands.
Optimize transmit power and coverage range
Improve deployment environment, place APs away from potential interference sources and use physical barriers (walls or partitions) to attenuate external signals if possible.
AP density is represented by the number of neighboring APs that a single AP can scan, reflecting the deployment status of APs.
Neighboring APs ≥ 10: Dense deployment
5 ≤ Neighboring APs < 10: Normal deployment
Neighboring APs < 5: Sparse deployment
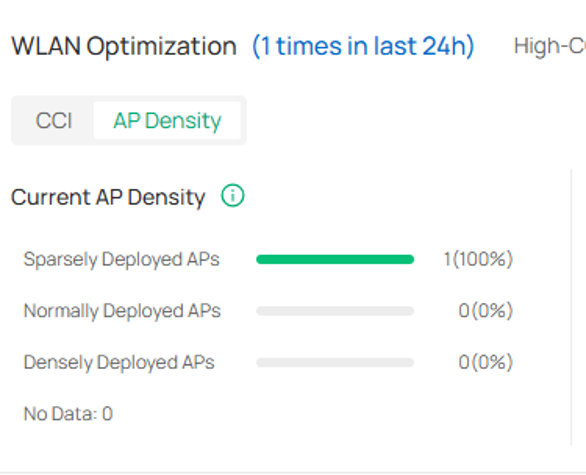
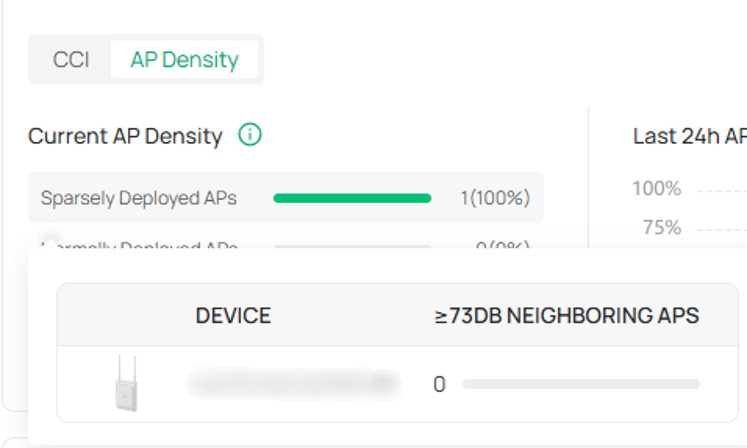
The AP Density interface is also divided into a bar chart on the left and a line chart on the right. The bar chart displays the data from the latest sampling, showing the proportion of AP Density in three levels. When you hover over the corresponding entry, specific device information can be displayed;
The line chart on the right shows the trend of changes in the three types of deployment densities, with data recorded every 30 minutes.
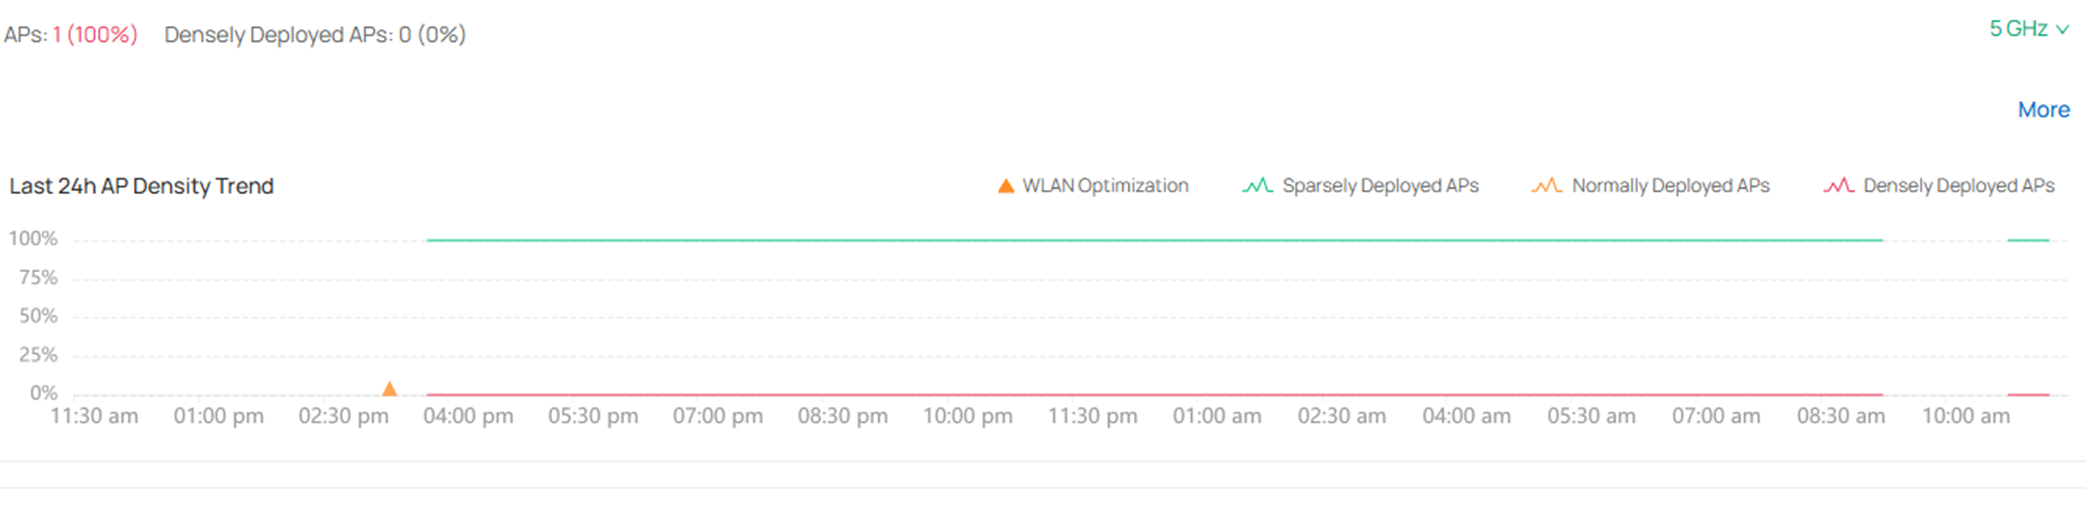
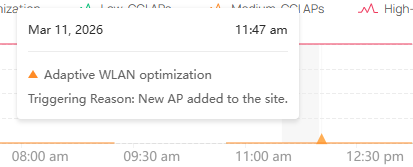
In addition, the triangular markers on the line chart indicate the times when wireless optimization was executed. Hovering over them reveals the type of optimization performed and the reason it was triggered.
Configuration based on the Omada App
Manual WLAN Optimization
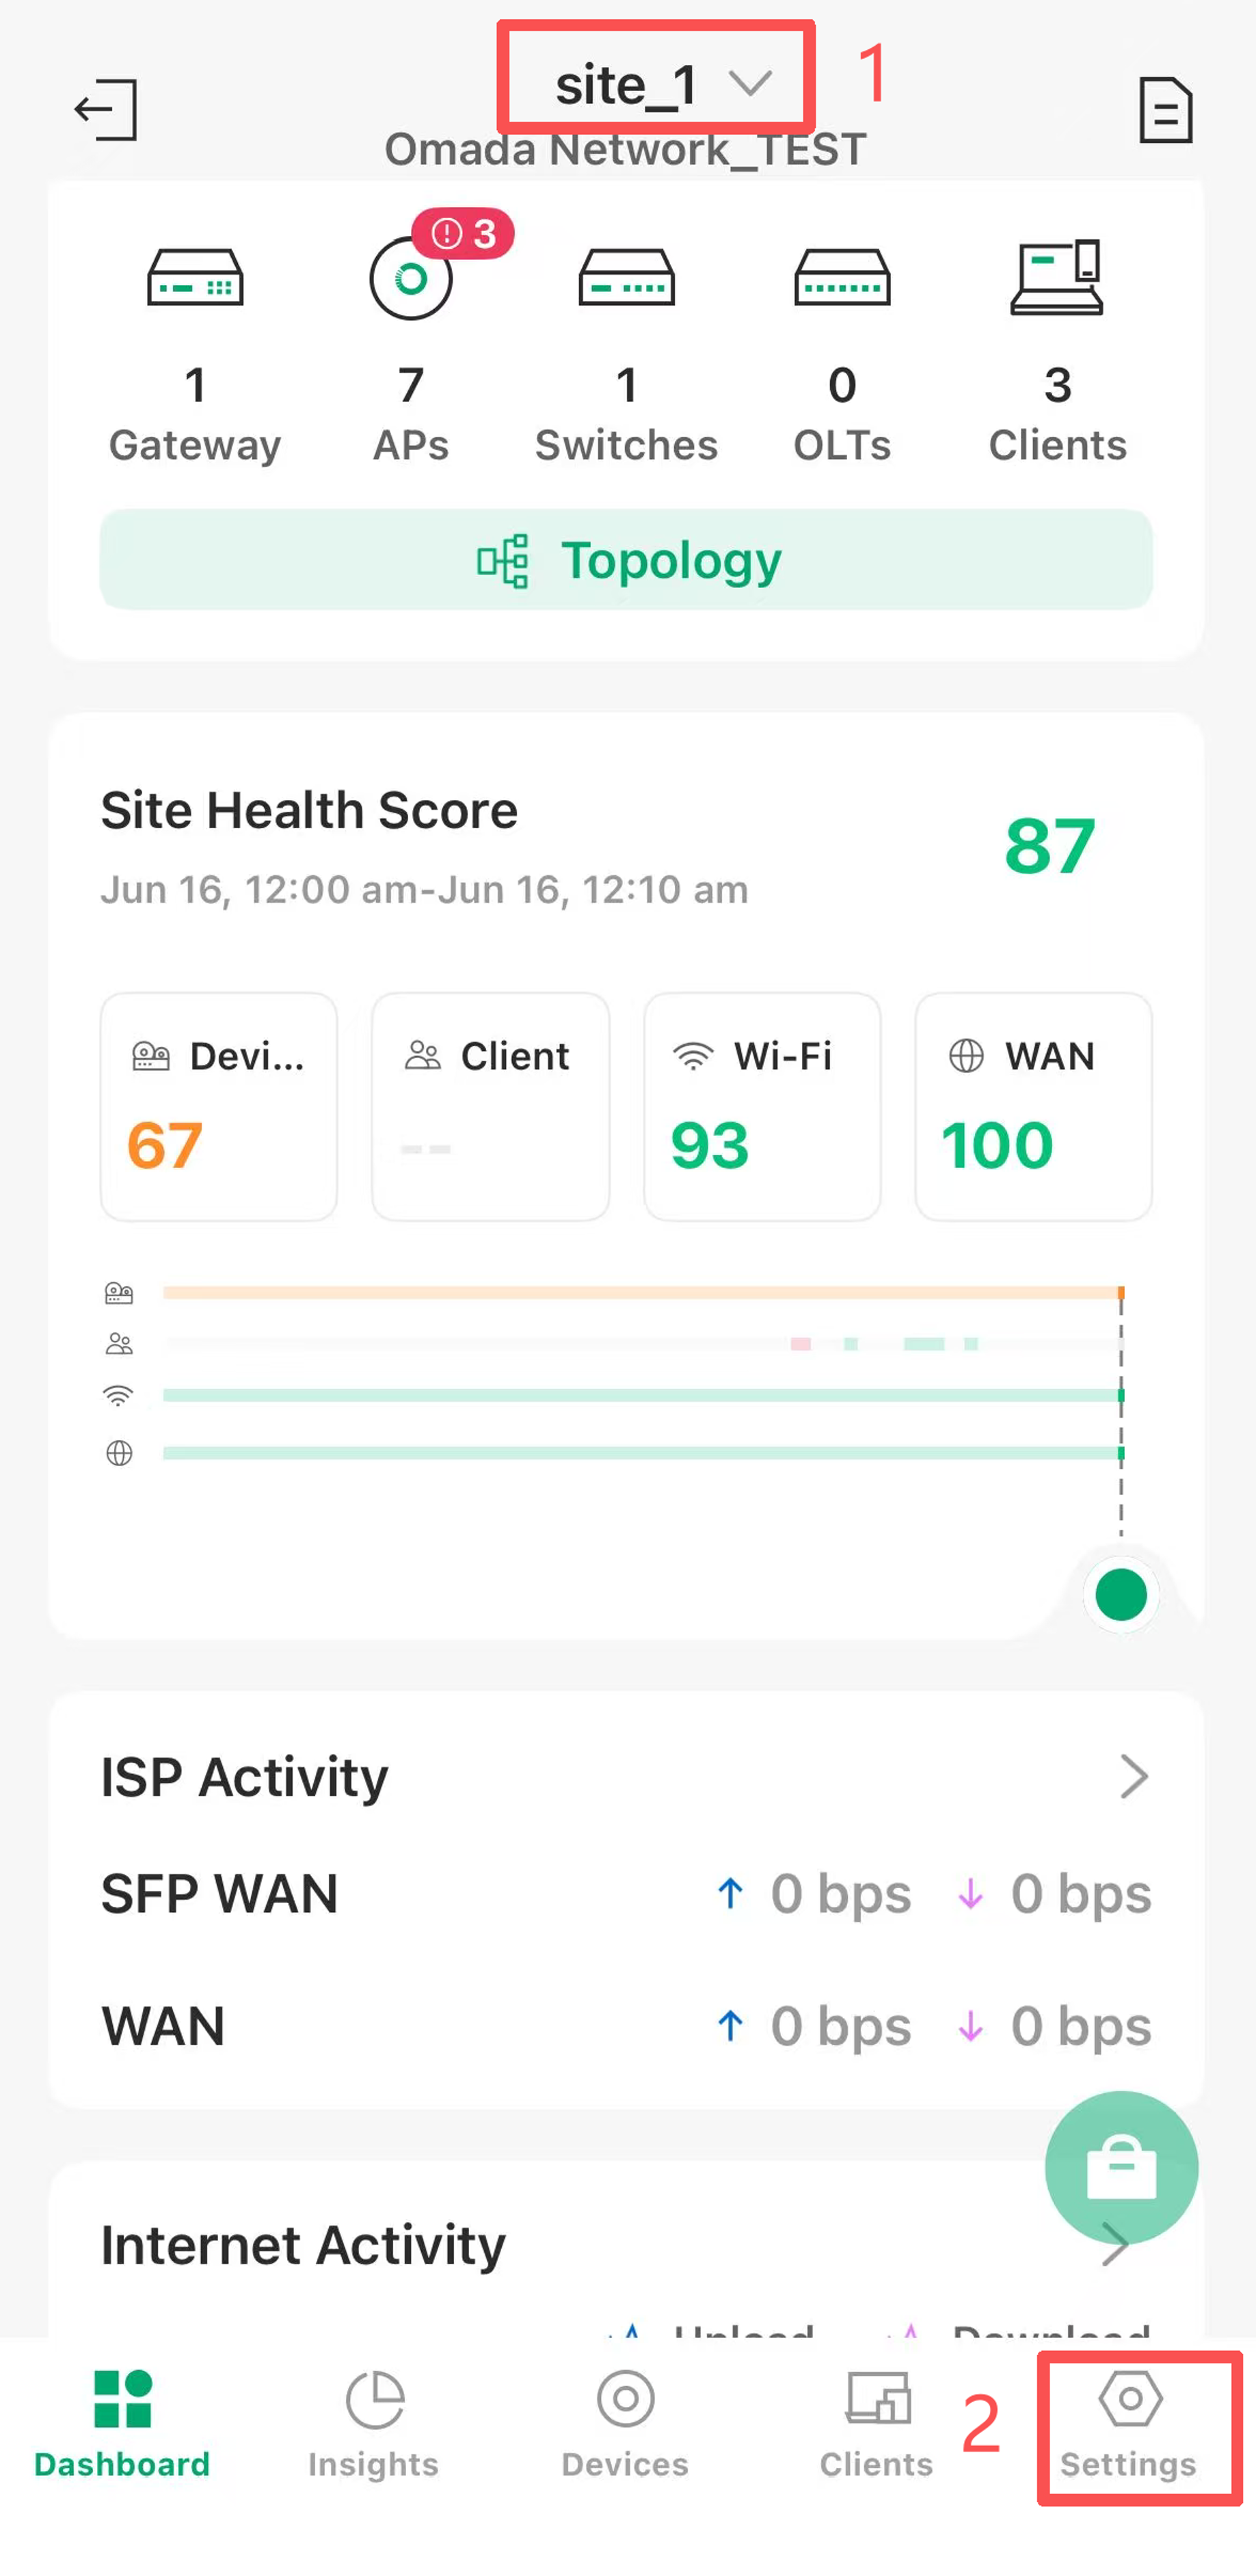
Step 1. Open the Omada App, switch to the Controller mode, and launch the targeted controller. After completing the SSID configuration, then select the site for which you want to perform wireless optimization, if the current Site has never undergone WLAN optimization, you can enter through the entry point at the bottom of the Dashboard page.
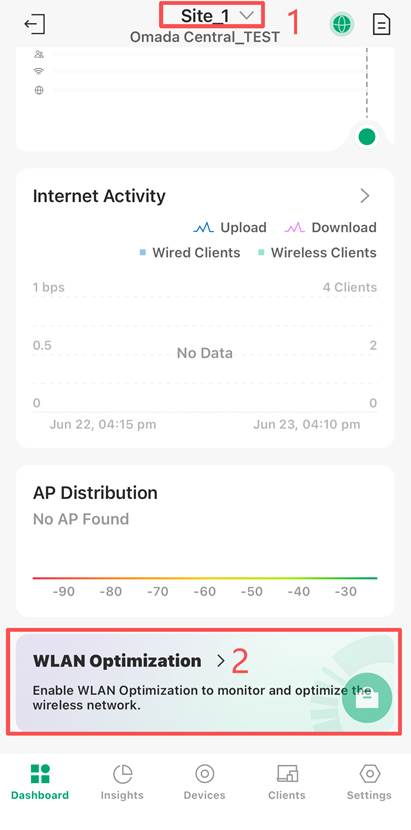
Another entrance: You can still go to Site View > Settings > Wireless Networks > WLAN Optimization.
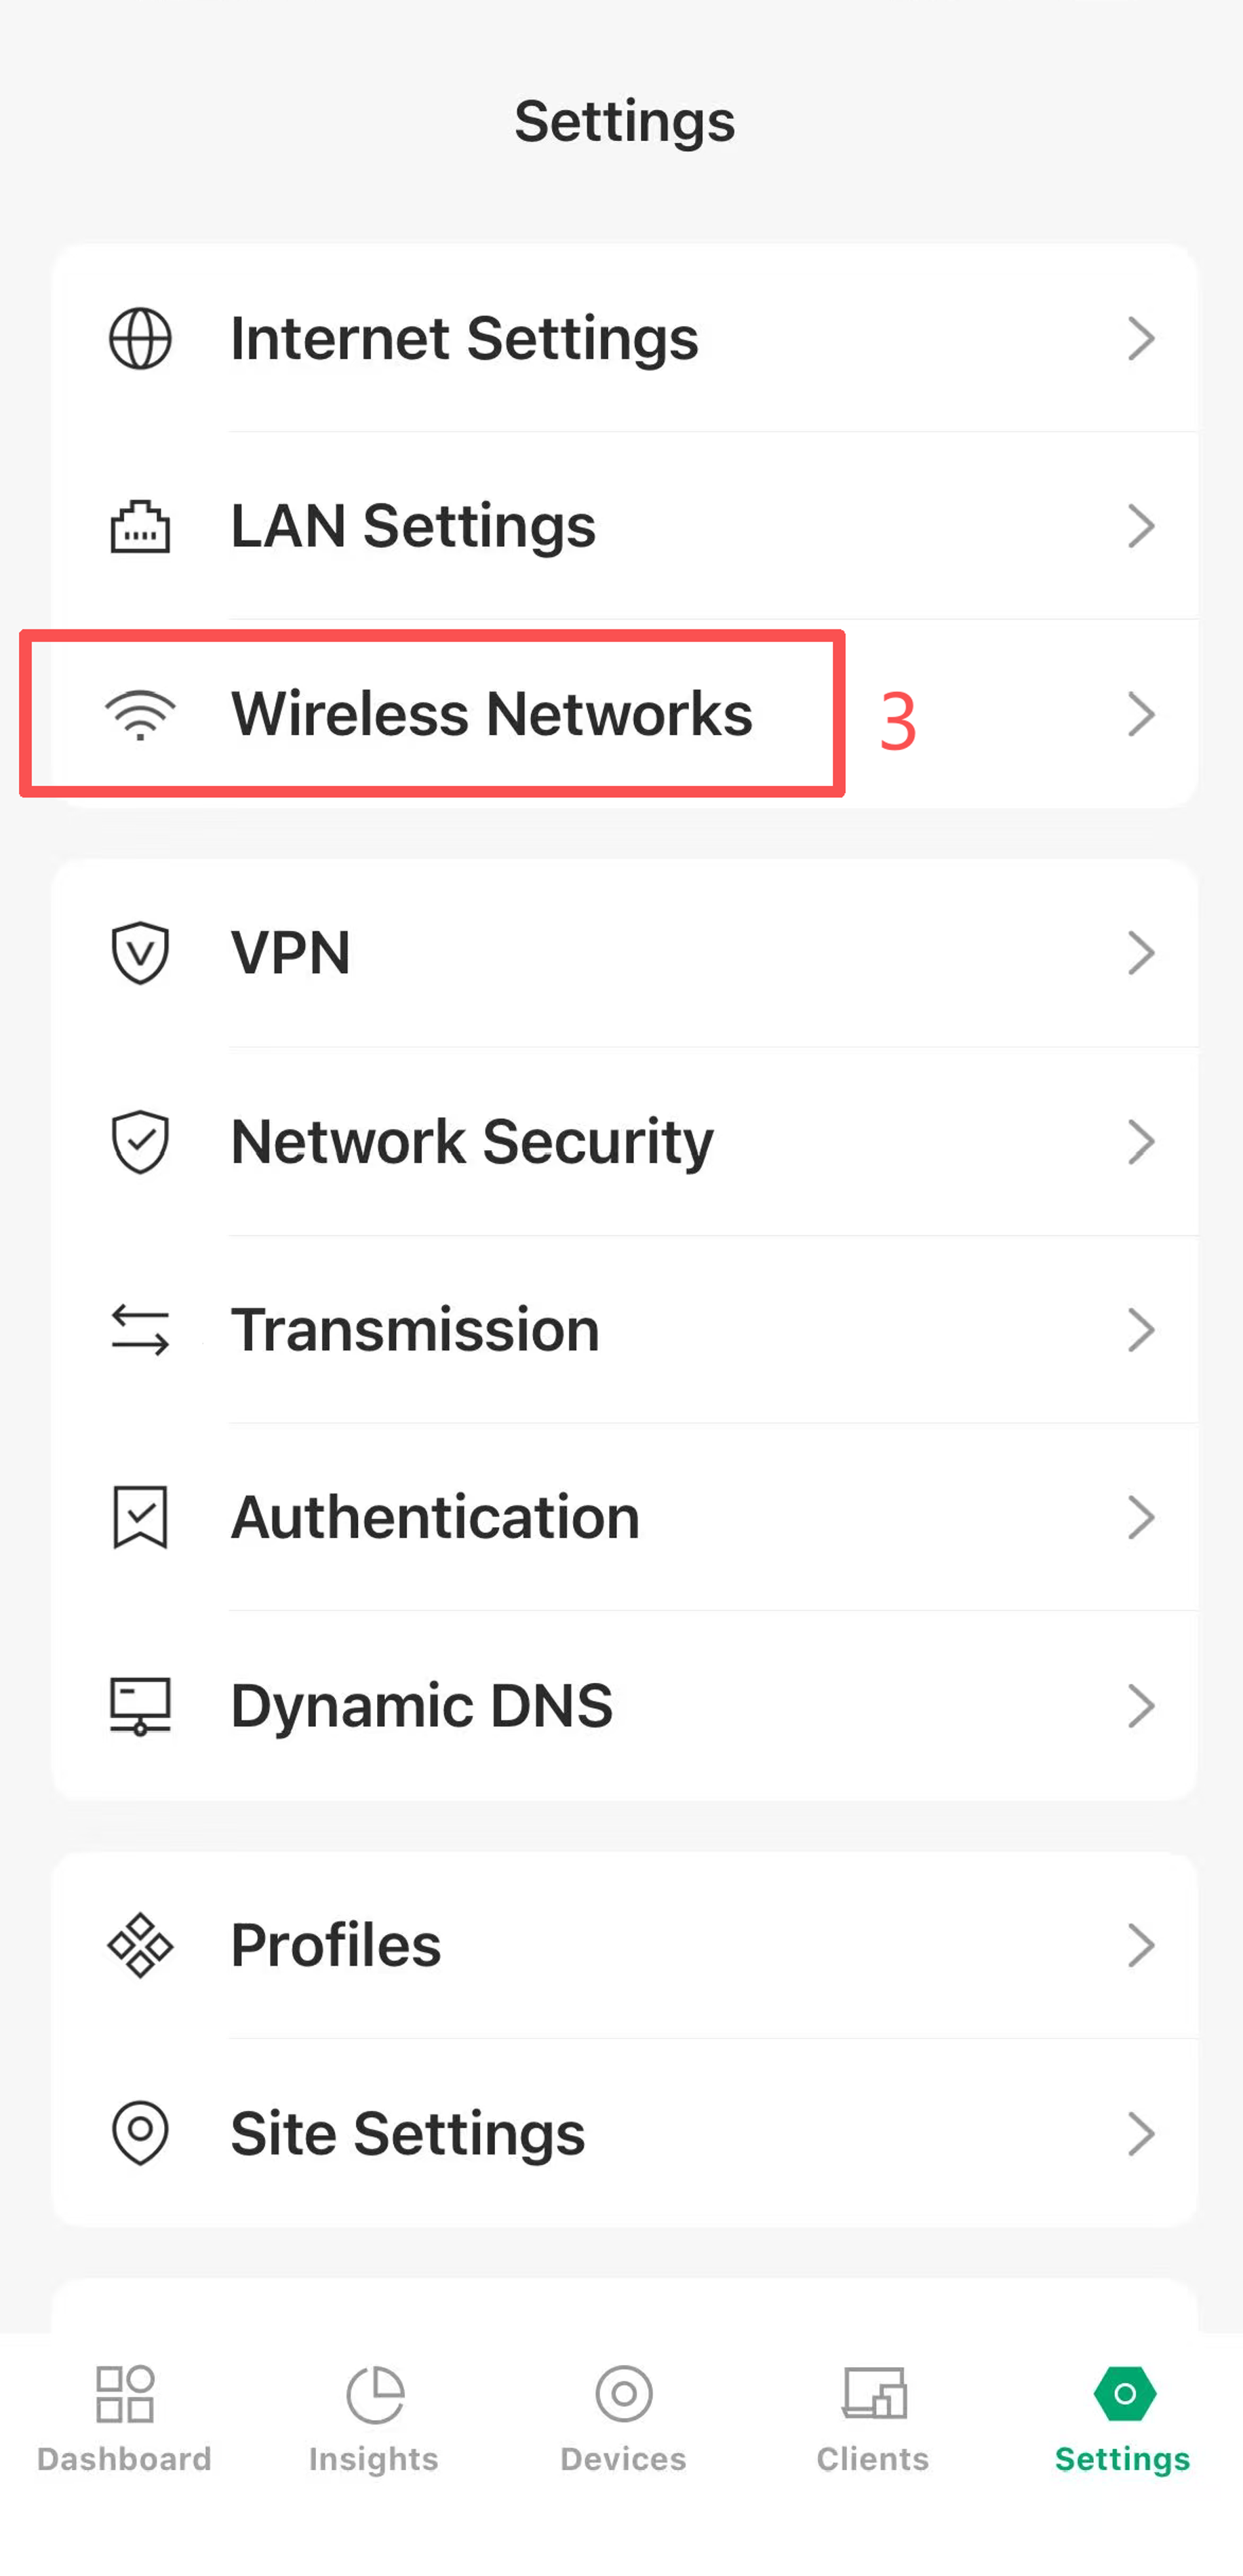
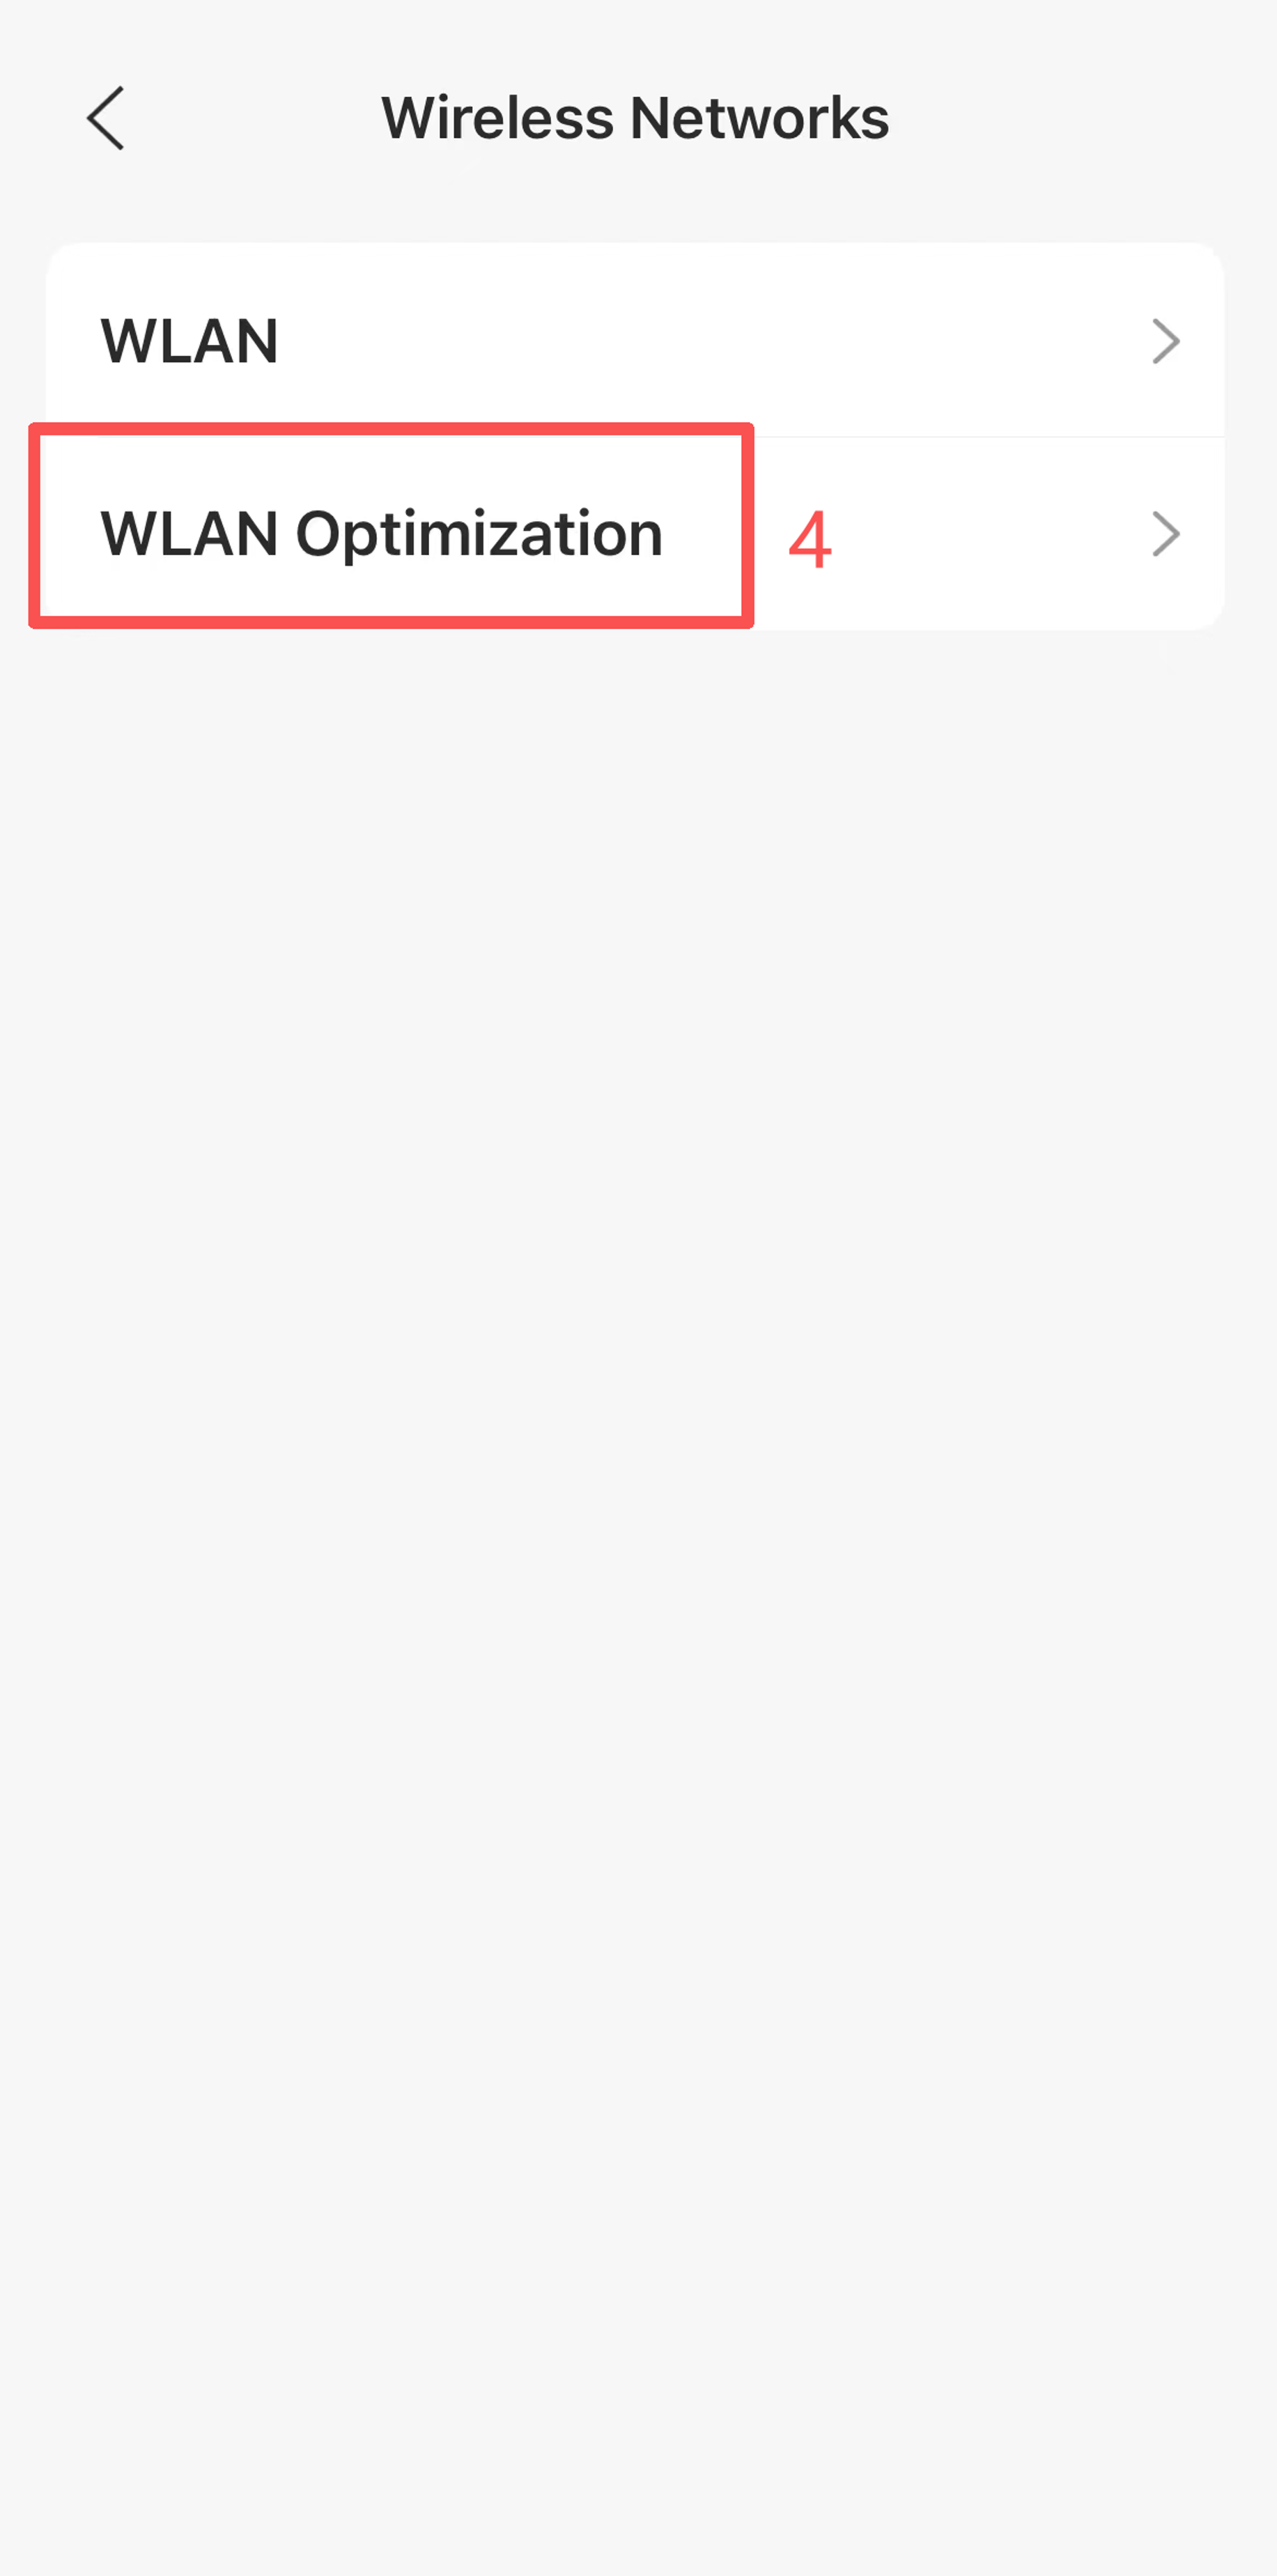
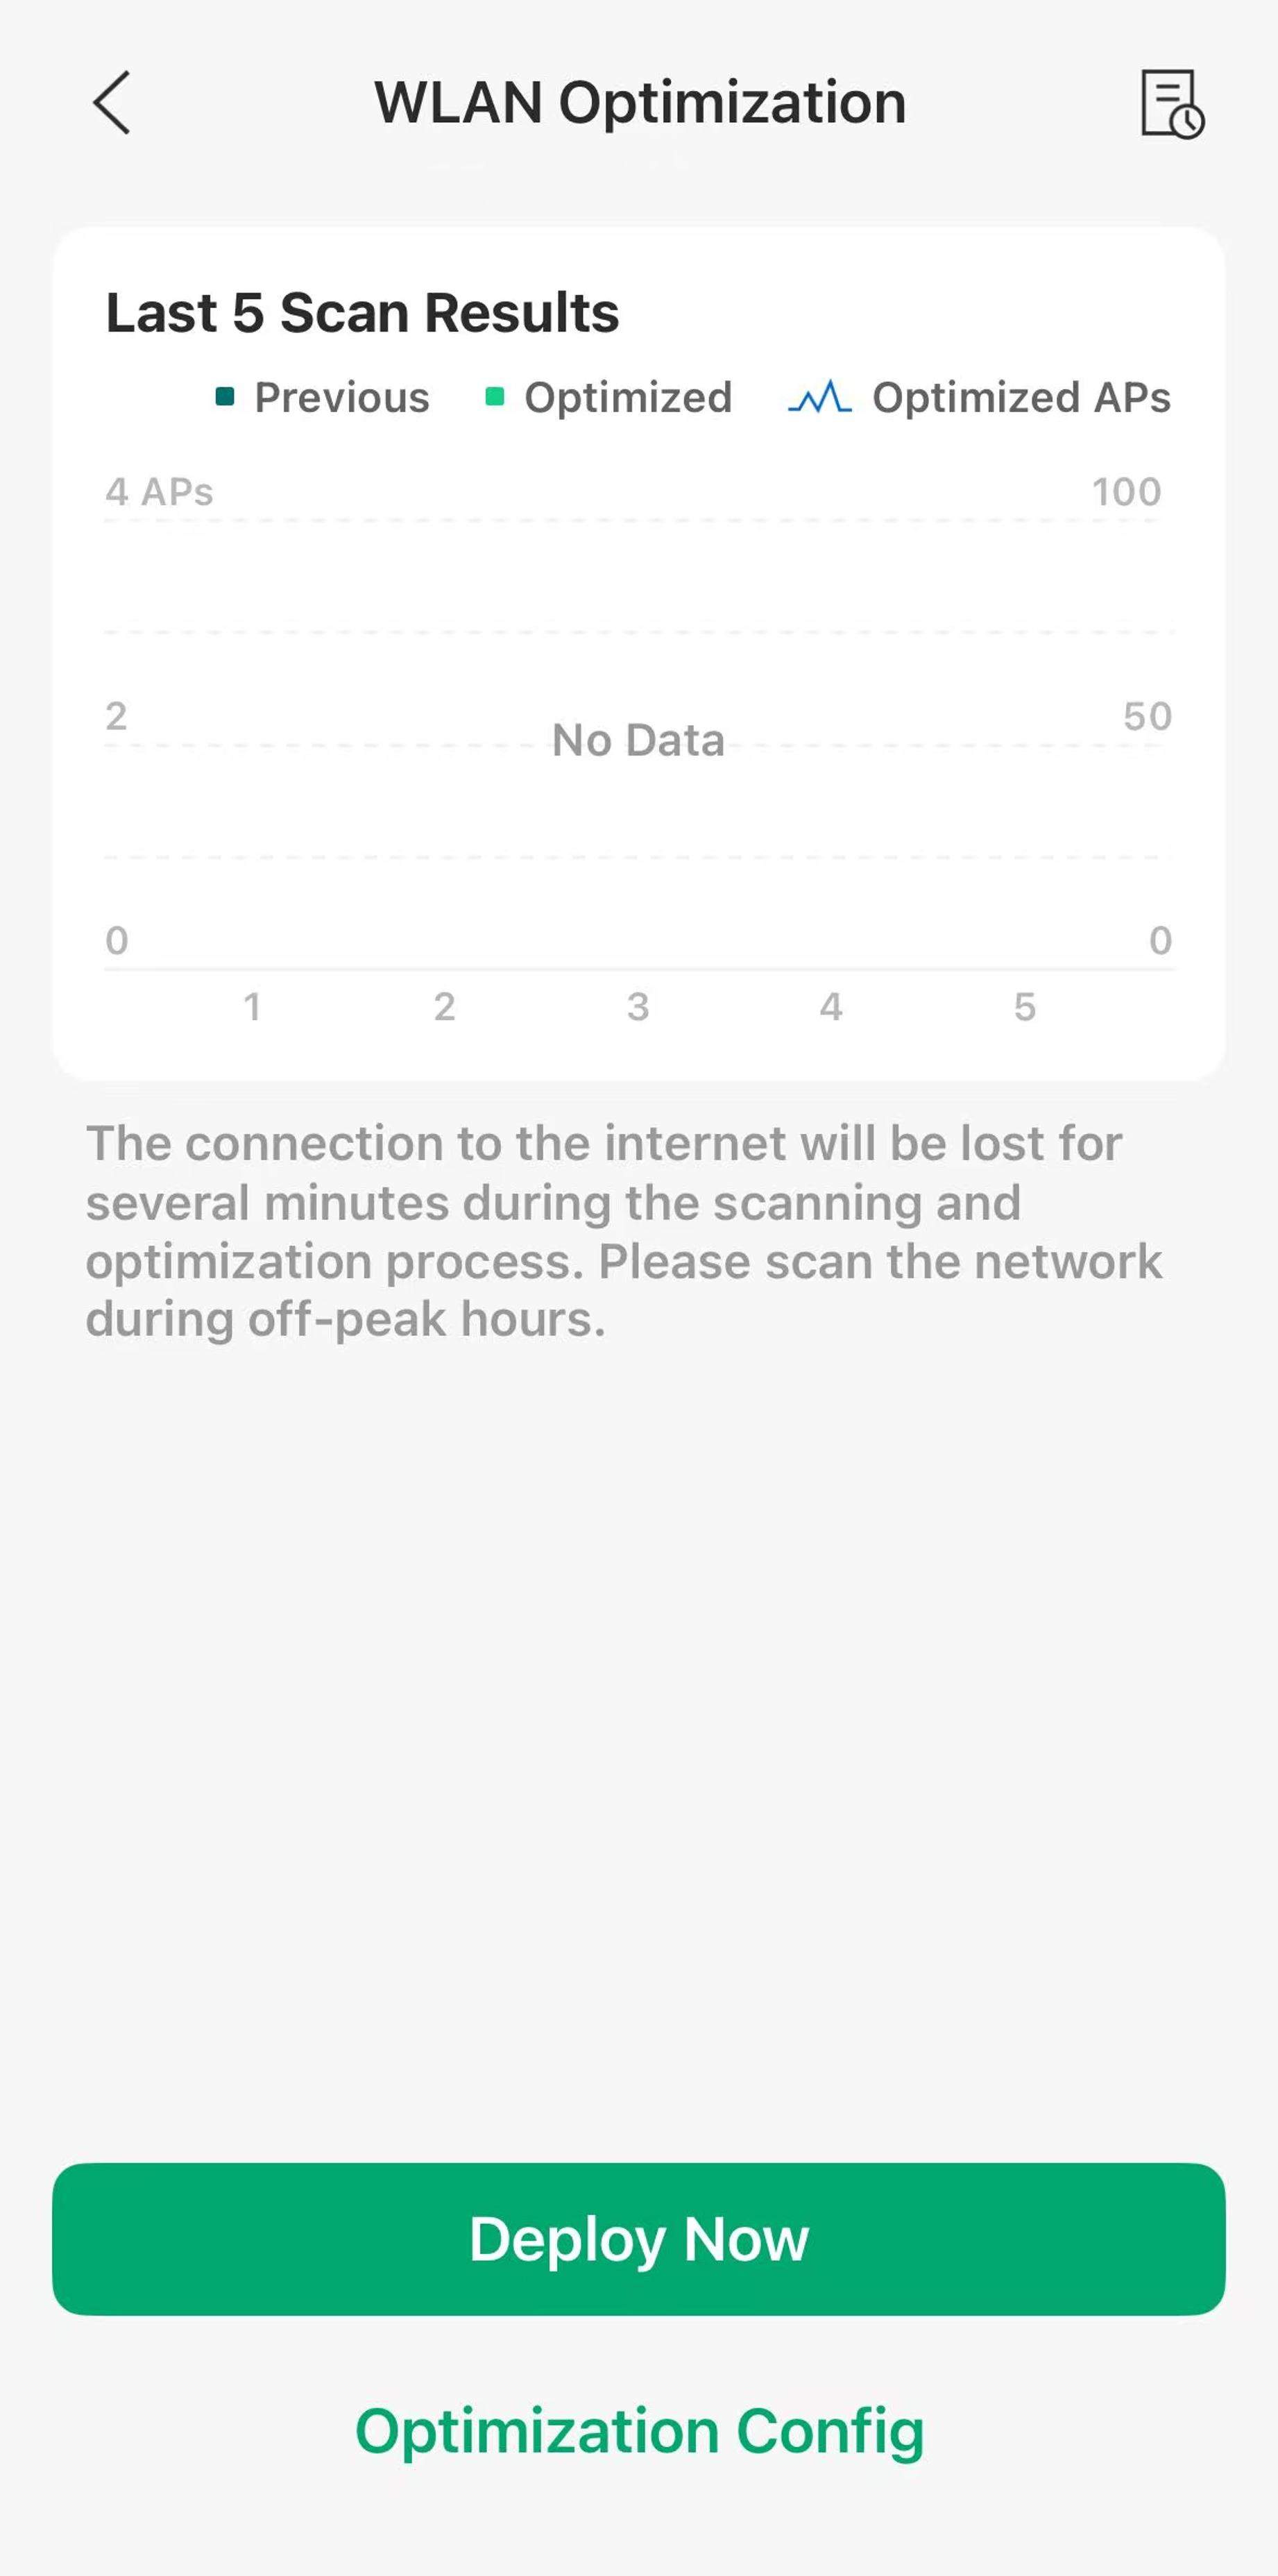
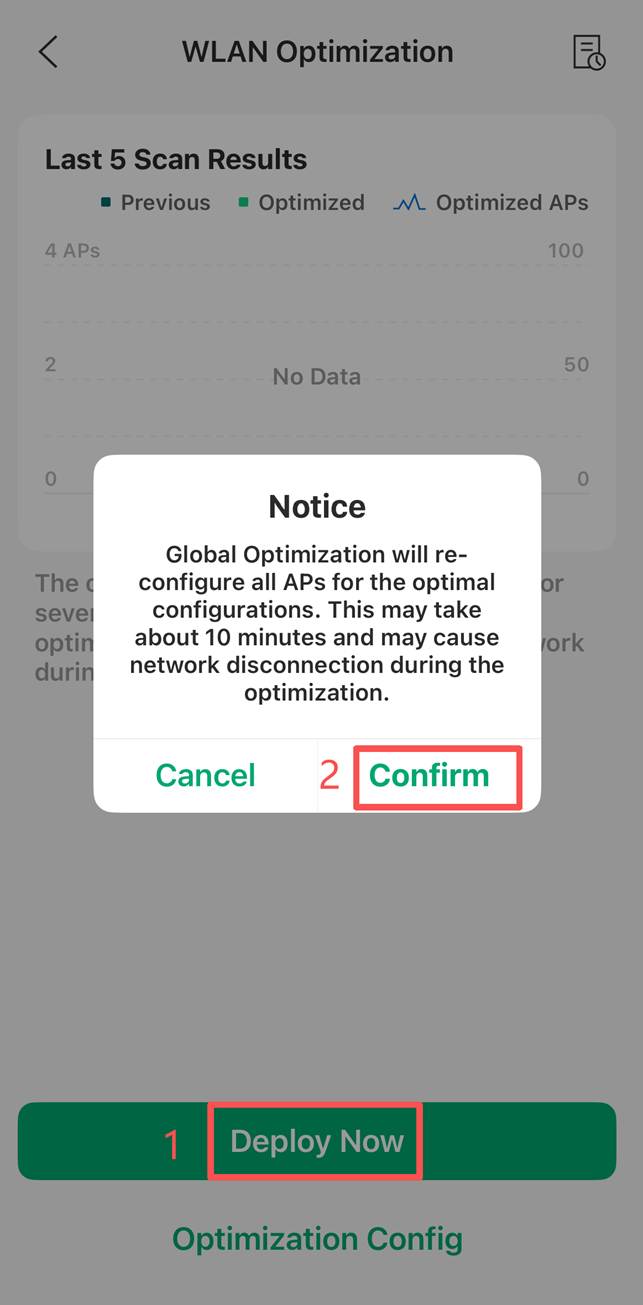
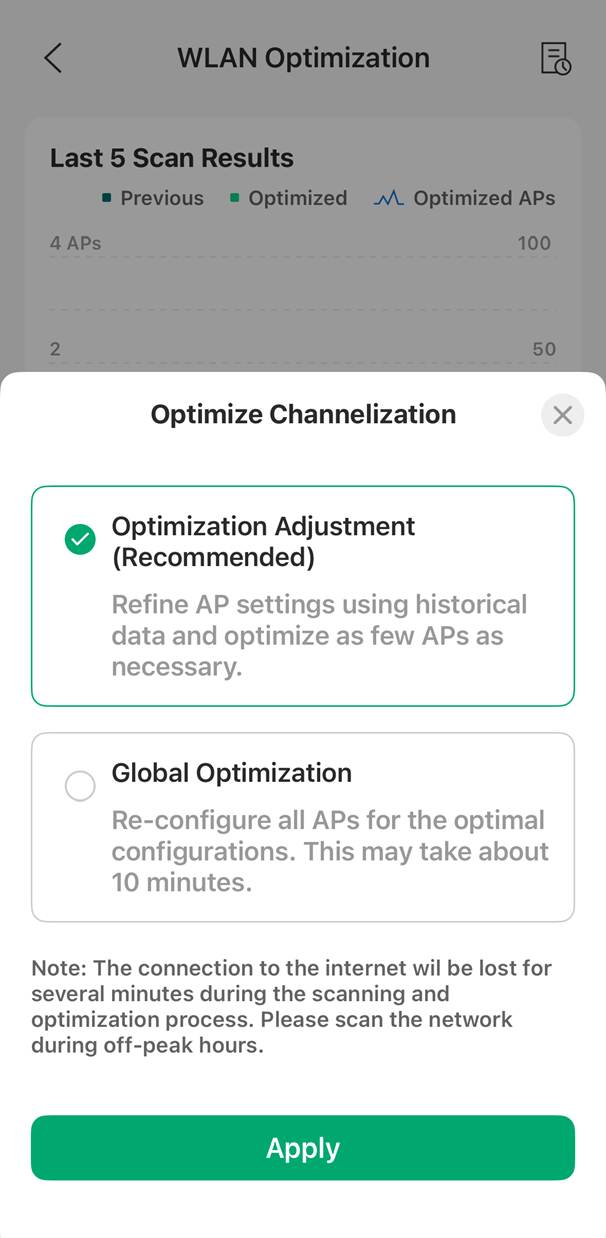
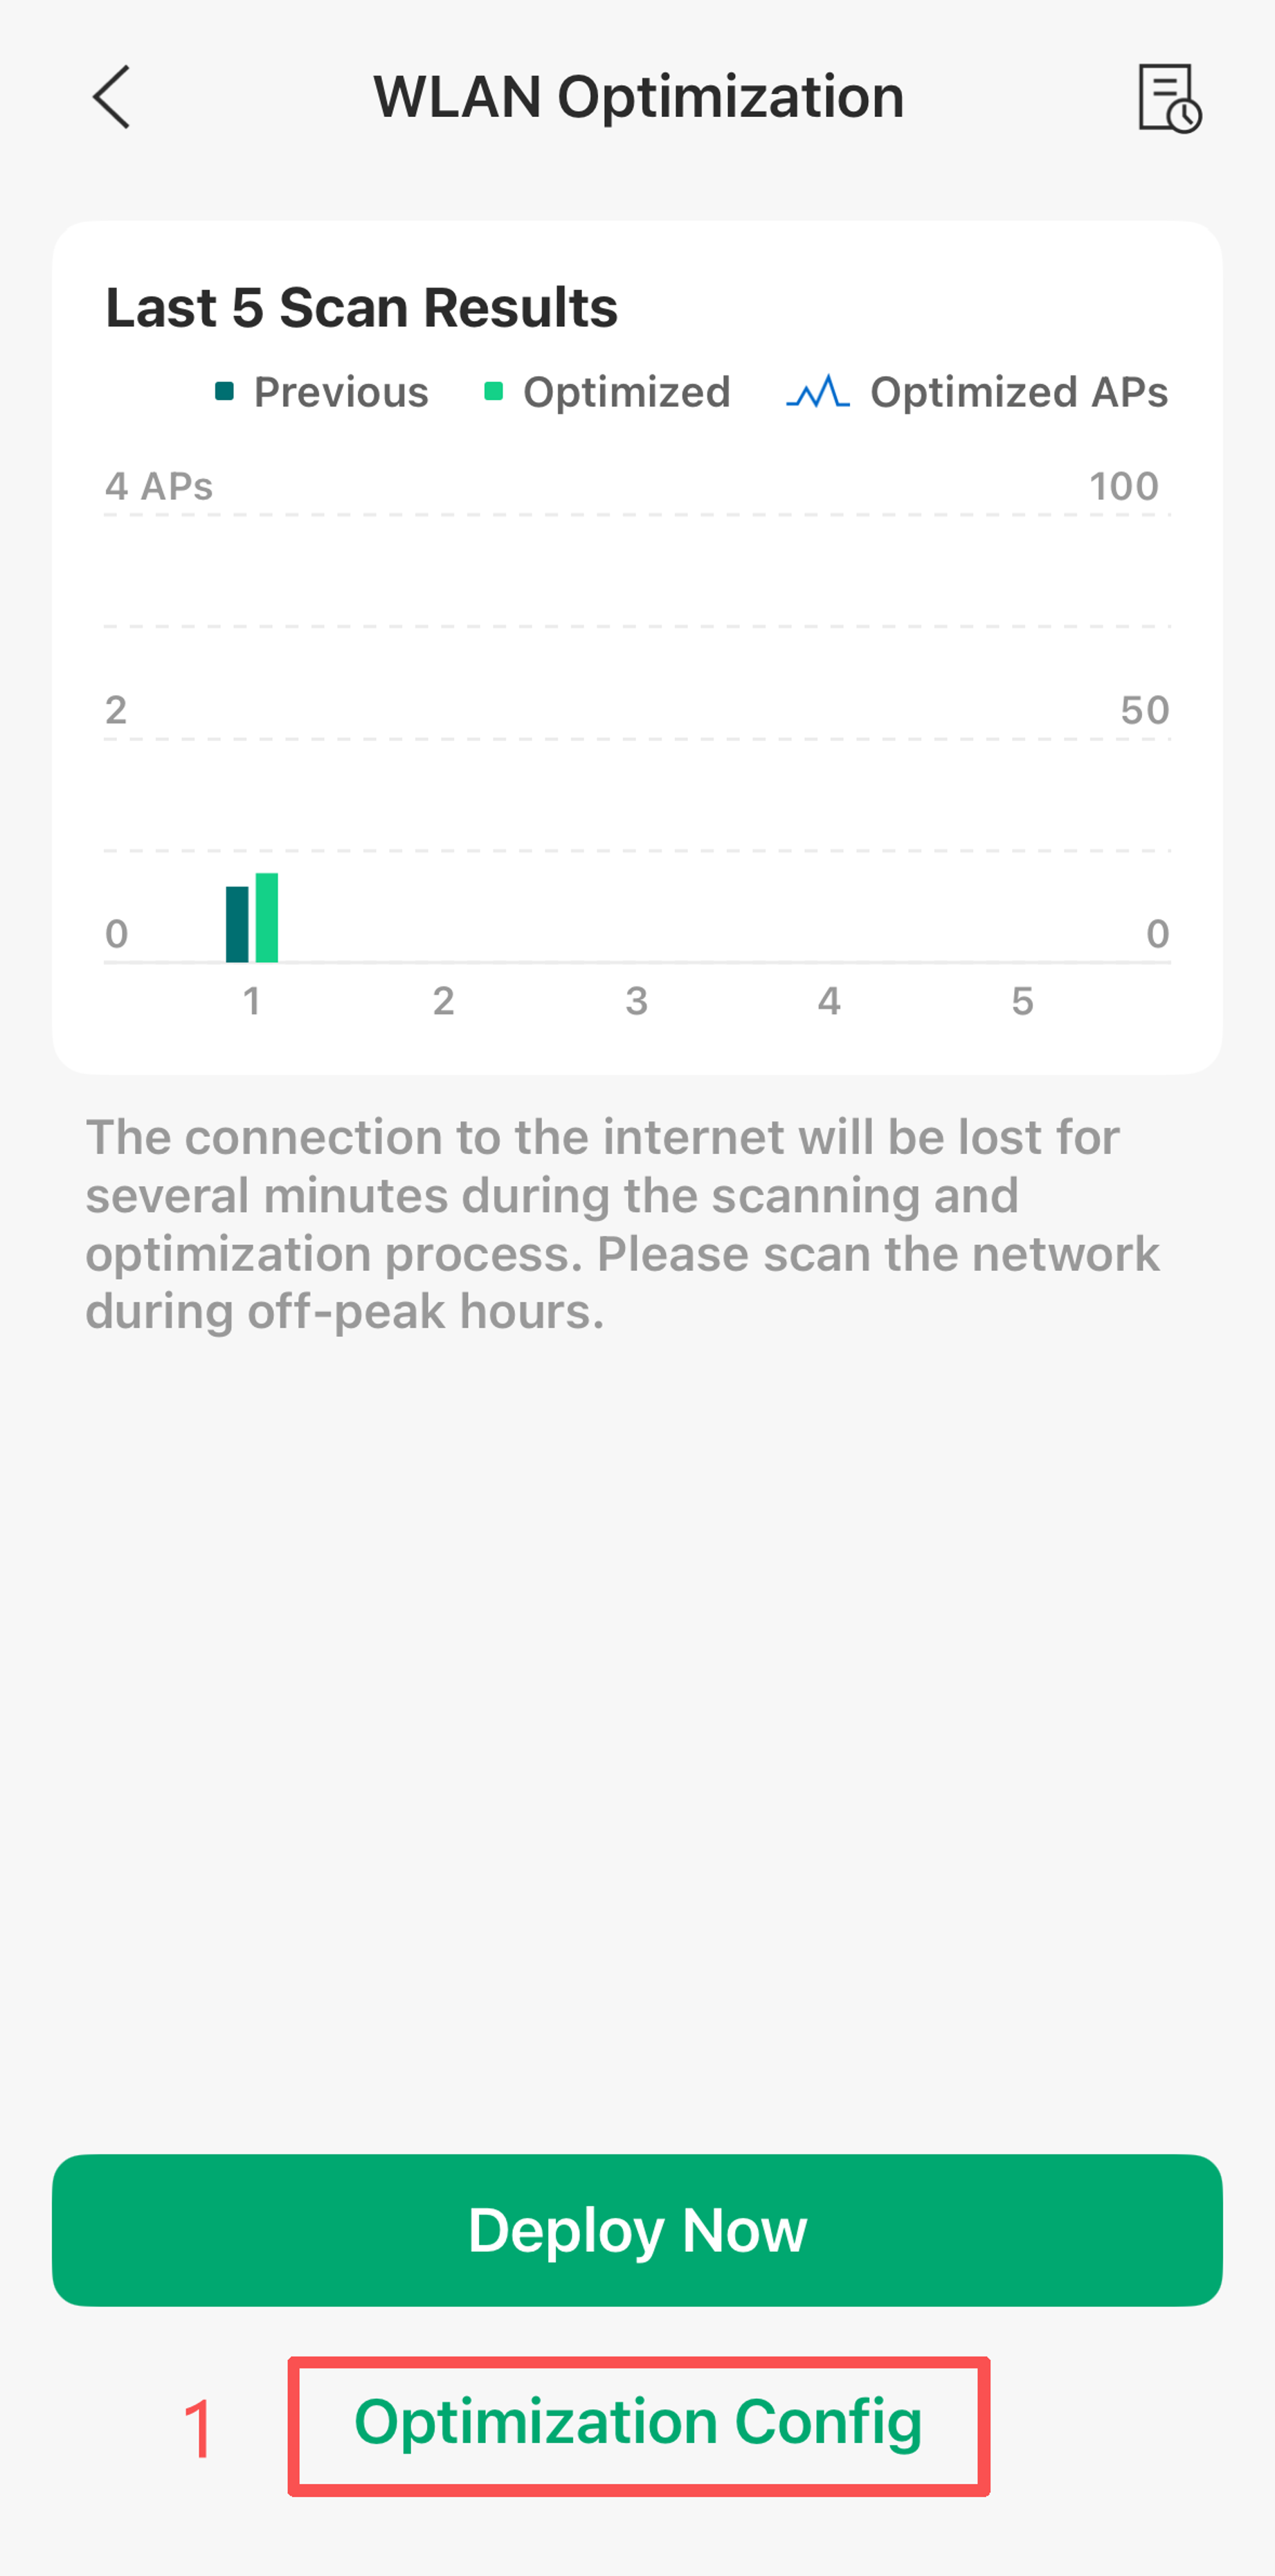
Step 2. Configure WLAN Optimization.
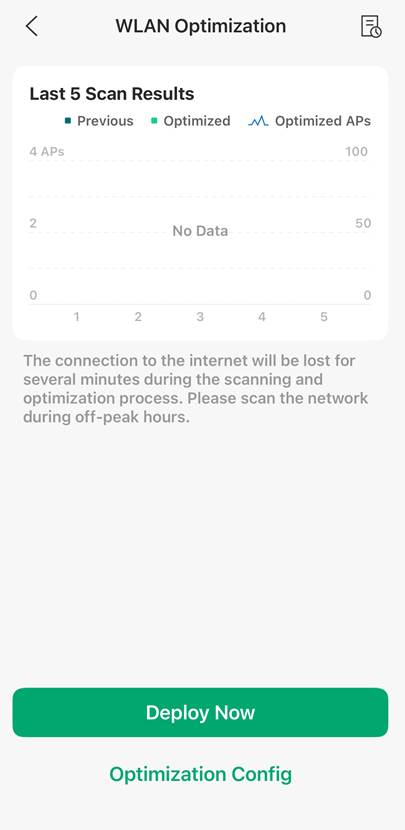
Once the Deploy button is clicked for the first time, you can only perform the global optimization, and the global optimization will reconfigure all APs for the optimal configurations. This may take about 10 minutes and may cause network disconnection during the optimization. Please scan the network during off-peak hours.
Note:
1) The APs in the MESH network cannot perform wireless optimization.
2) When there is no AP at the Site, WLAN Optimization cannot be performed. Clicking Deploy will prompt "No connected APs"
When manually performing optimization operations for the second time and later, you can choose between optimization adjustment or global optimization mode.
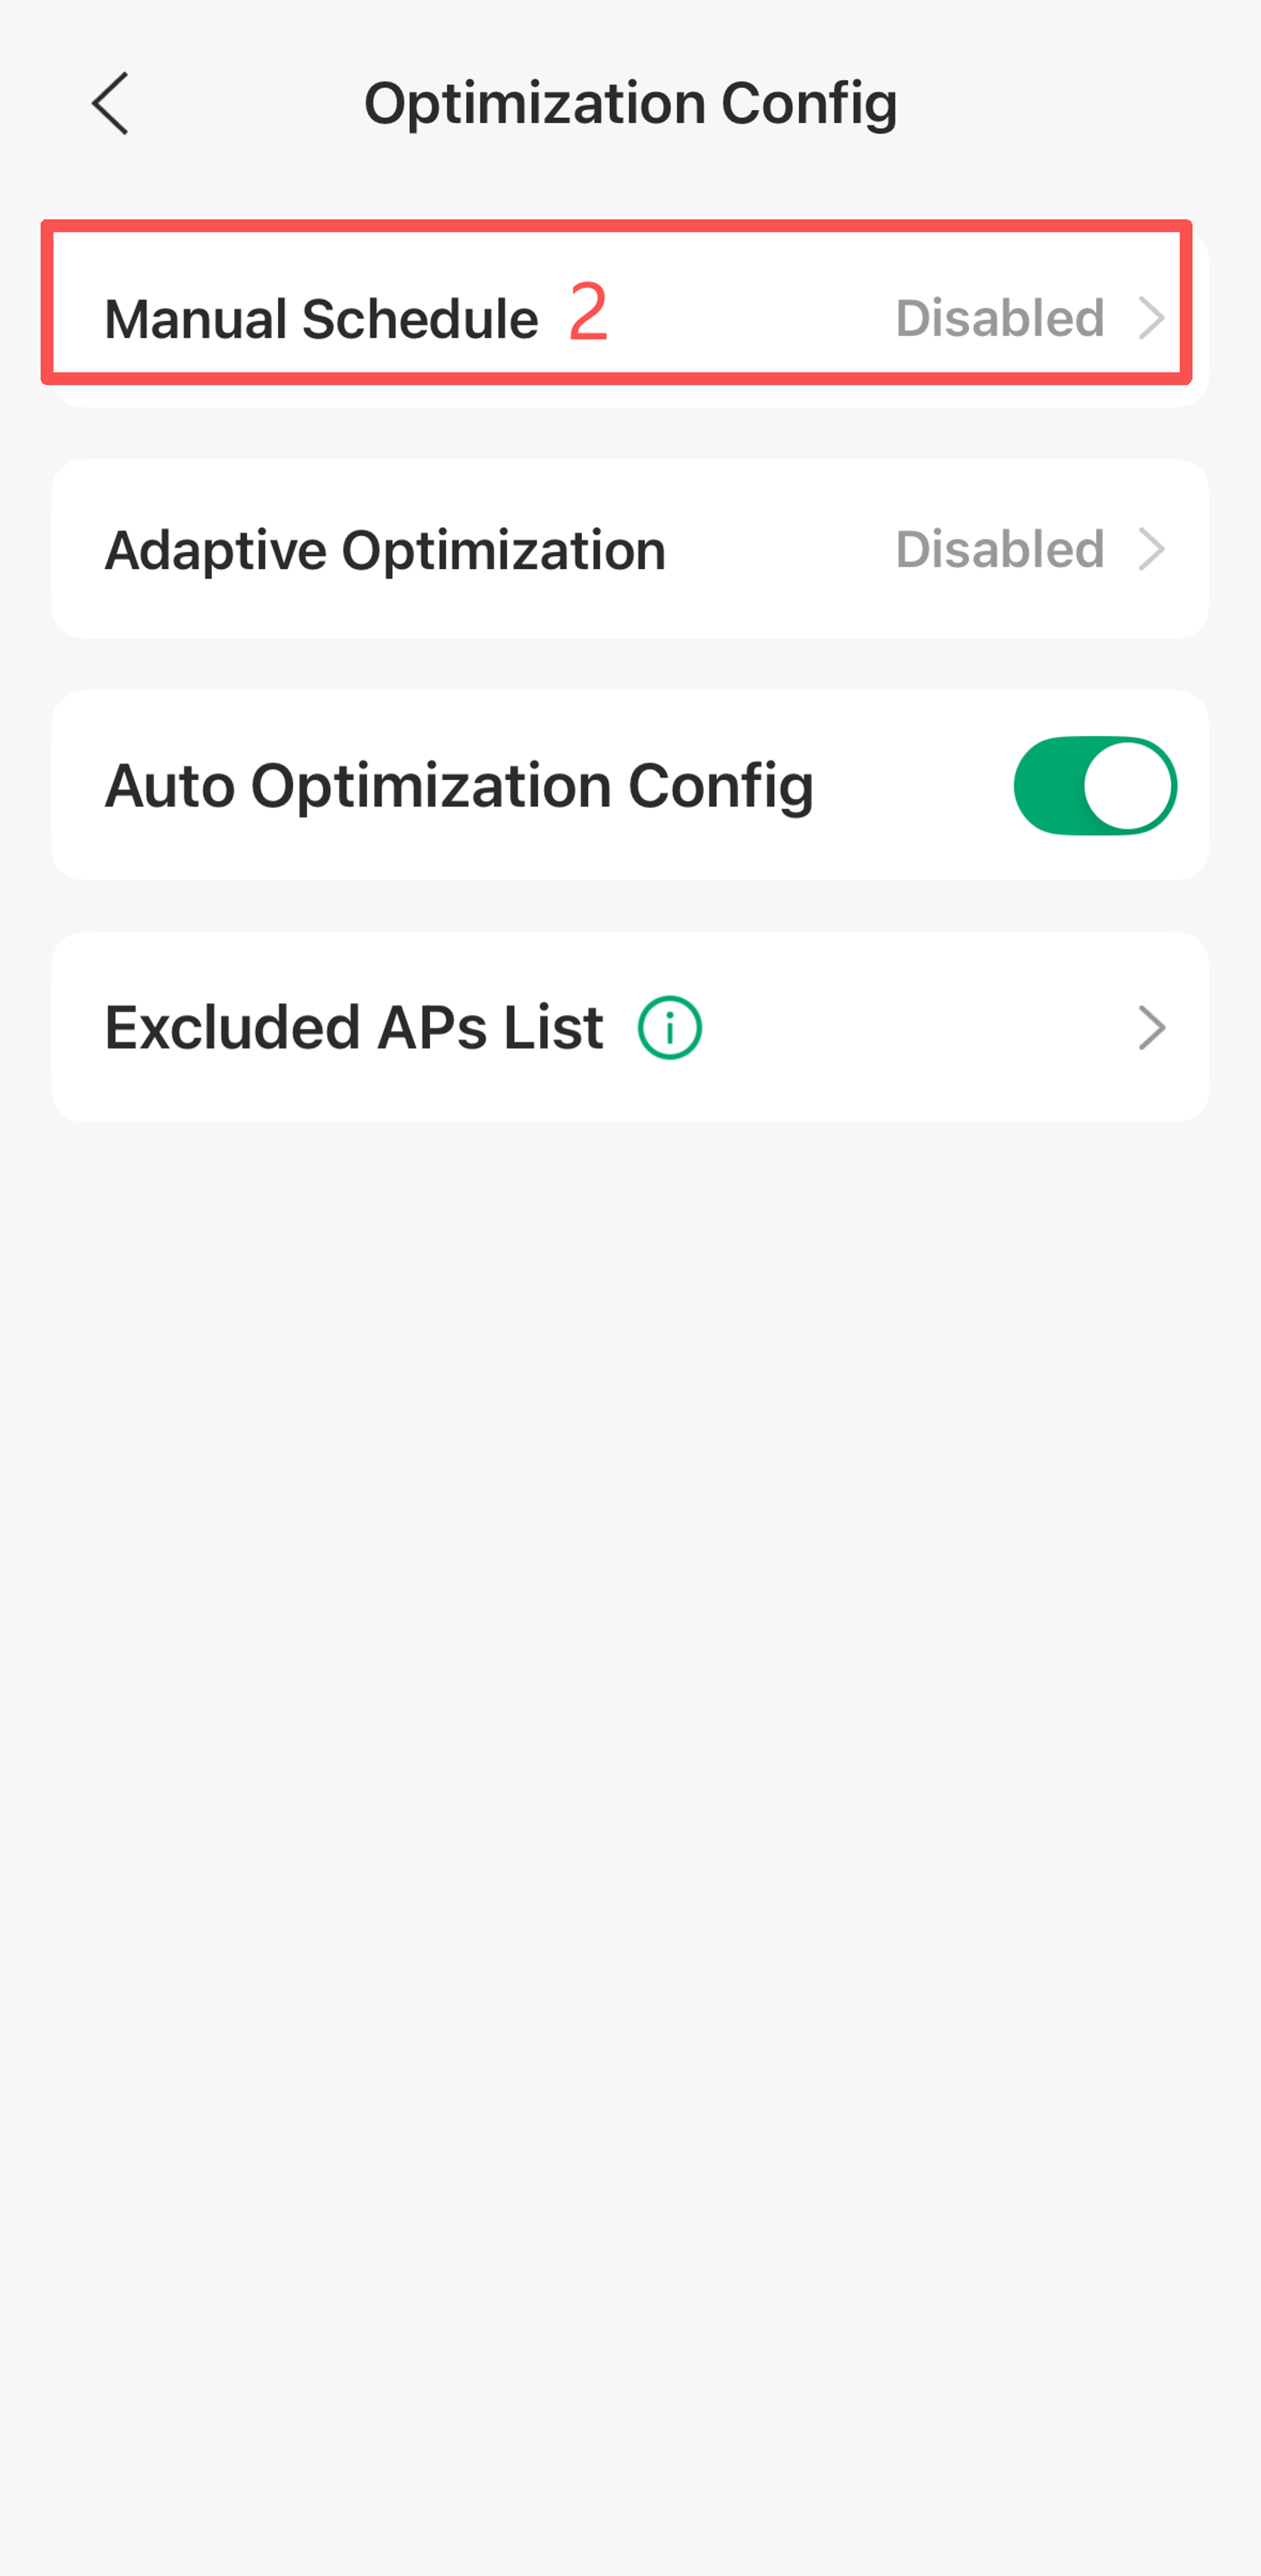
If you want to optimize the wireless network on a scheduled basis, you can go to the Optimization Config > Manual Schedule > Enable Status and configure a schedule by selecting the optimization time and frequency. The schedule follows the site’s configured time zone.
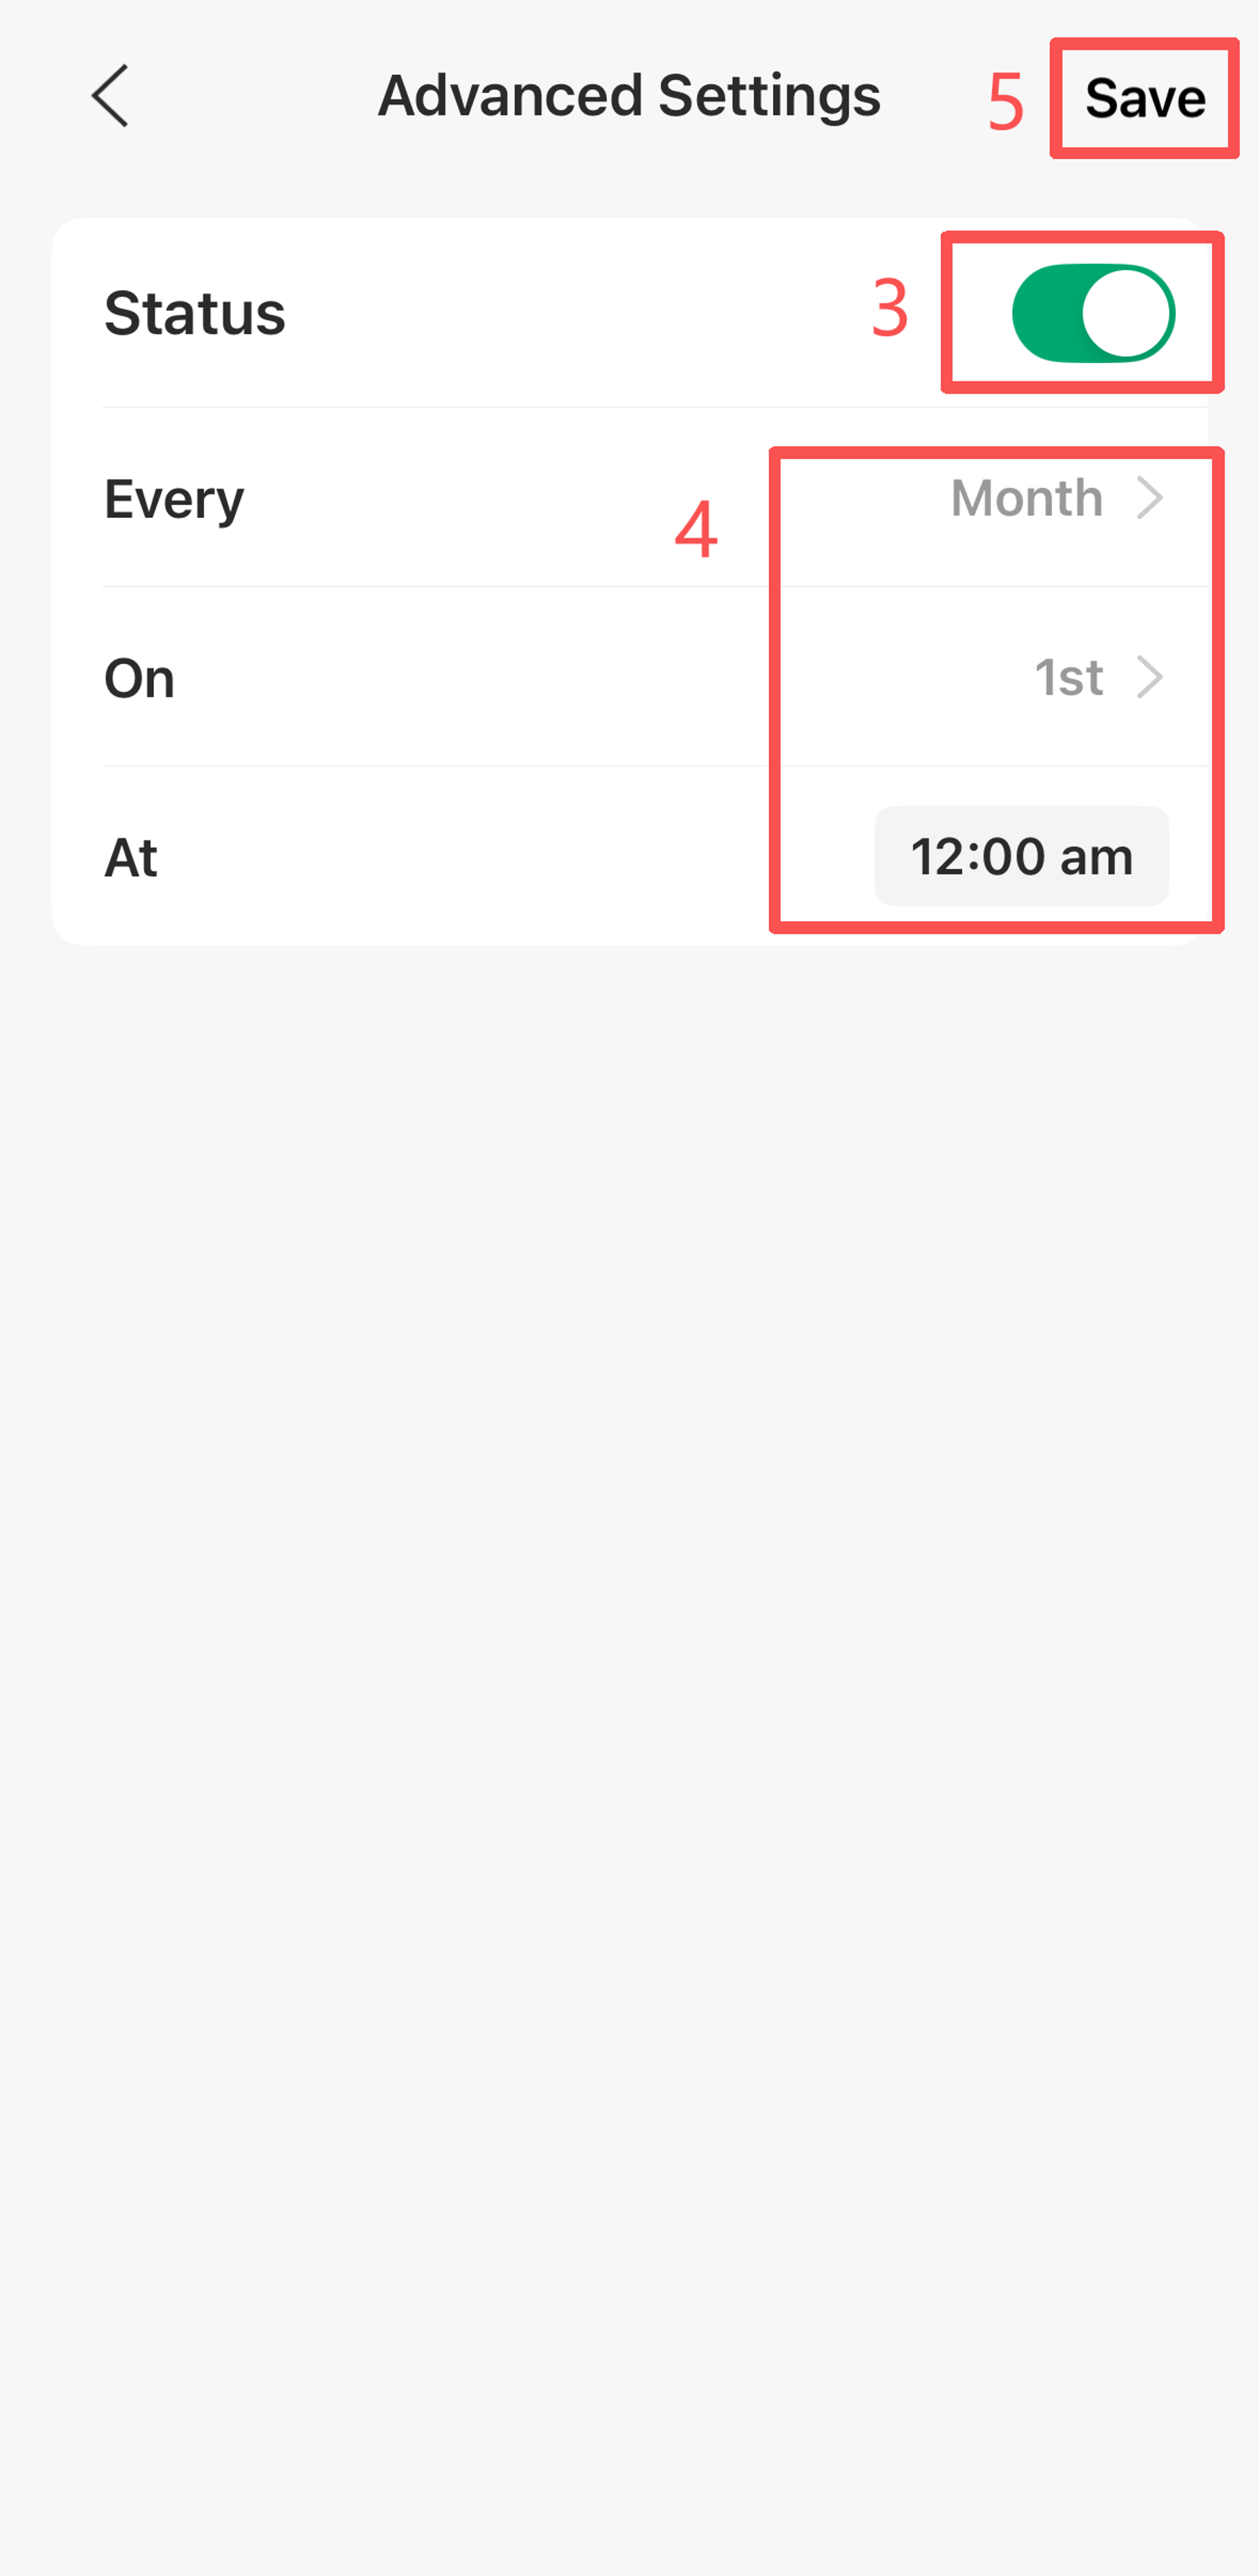
Note: It is recommended to schedule wireless optimization during periods that have minimal impact on users, such as late at night or early morning.
RRM, also known as Adaptive WLAN Optimization
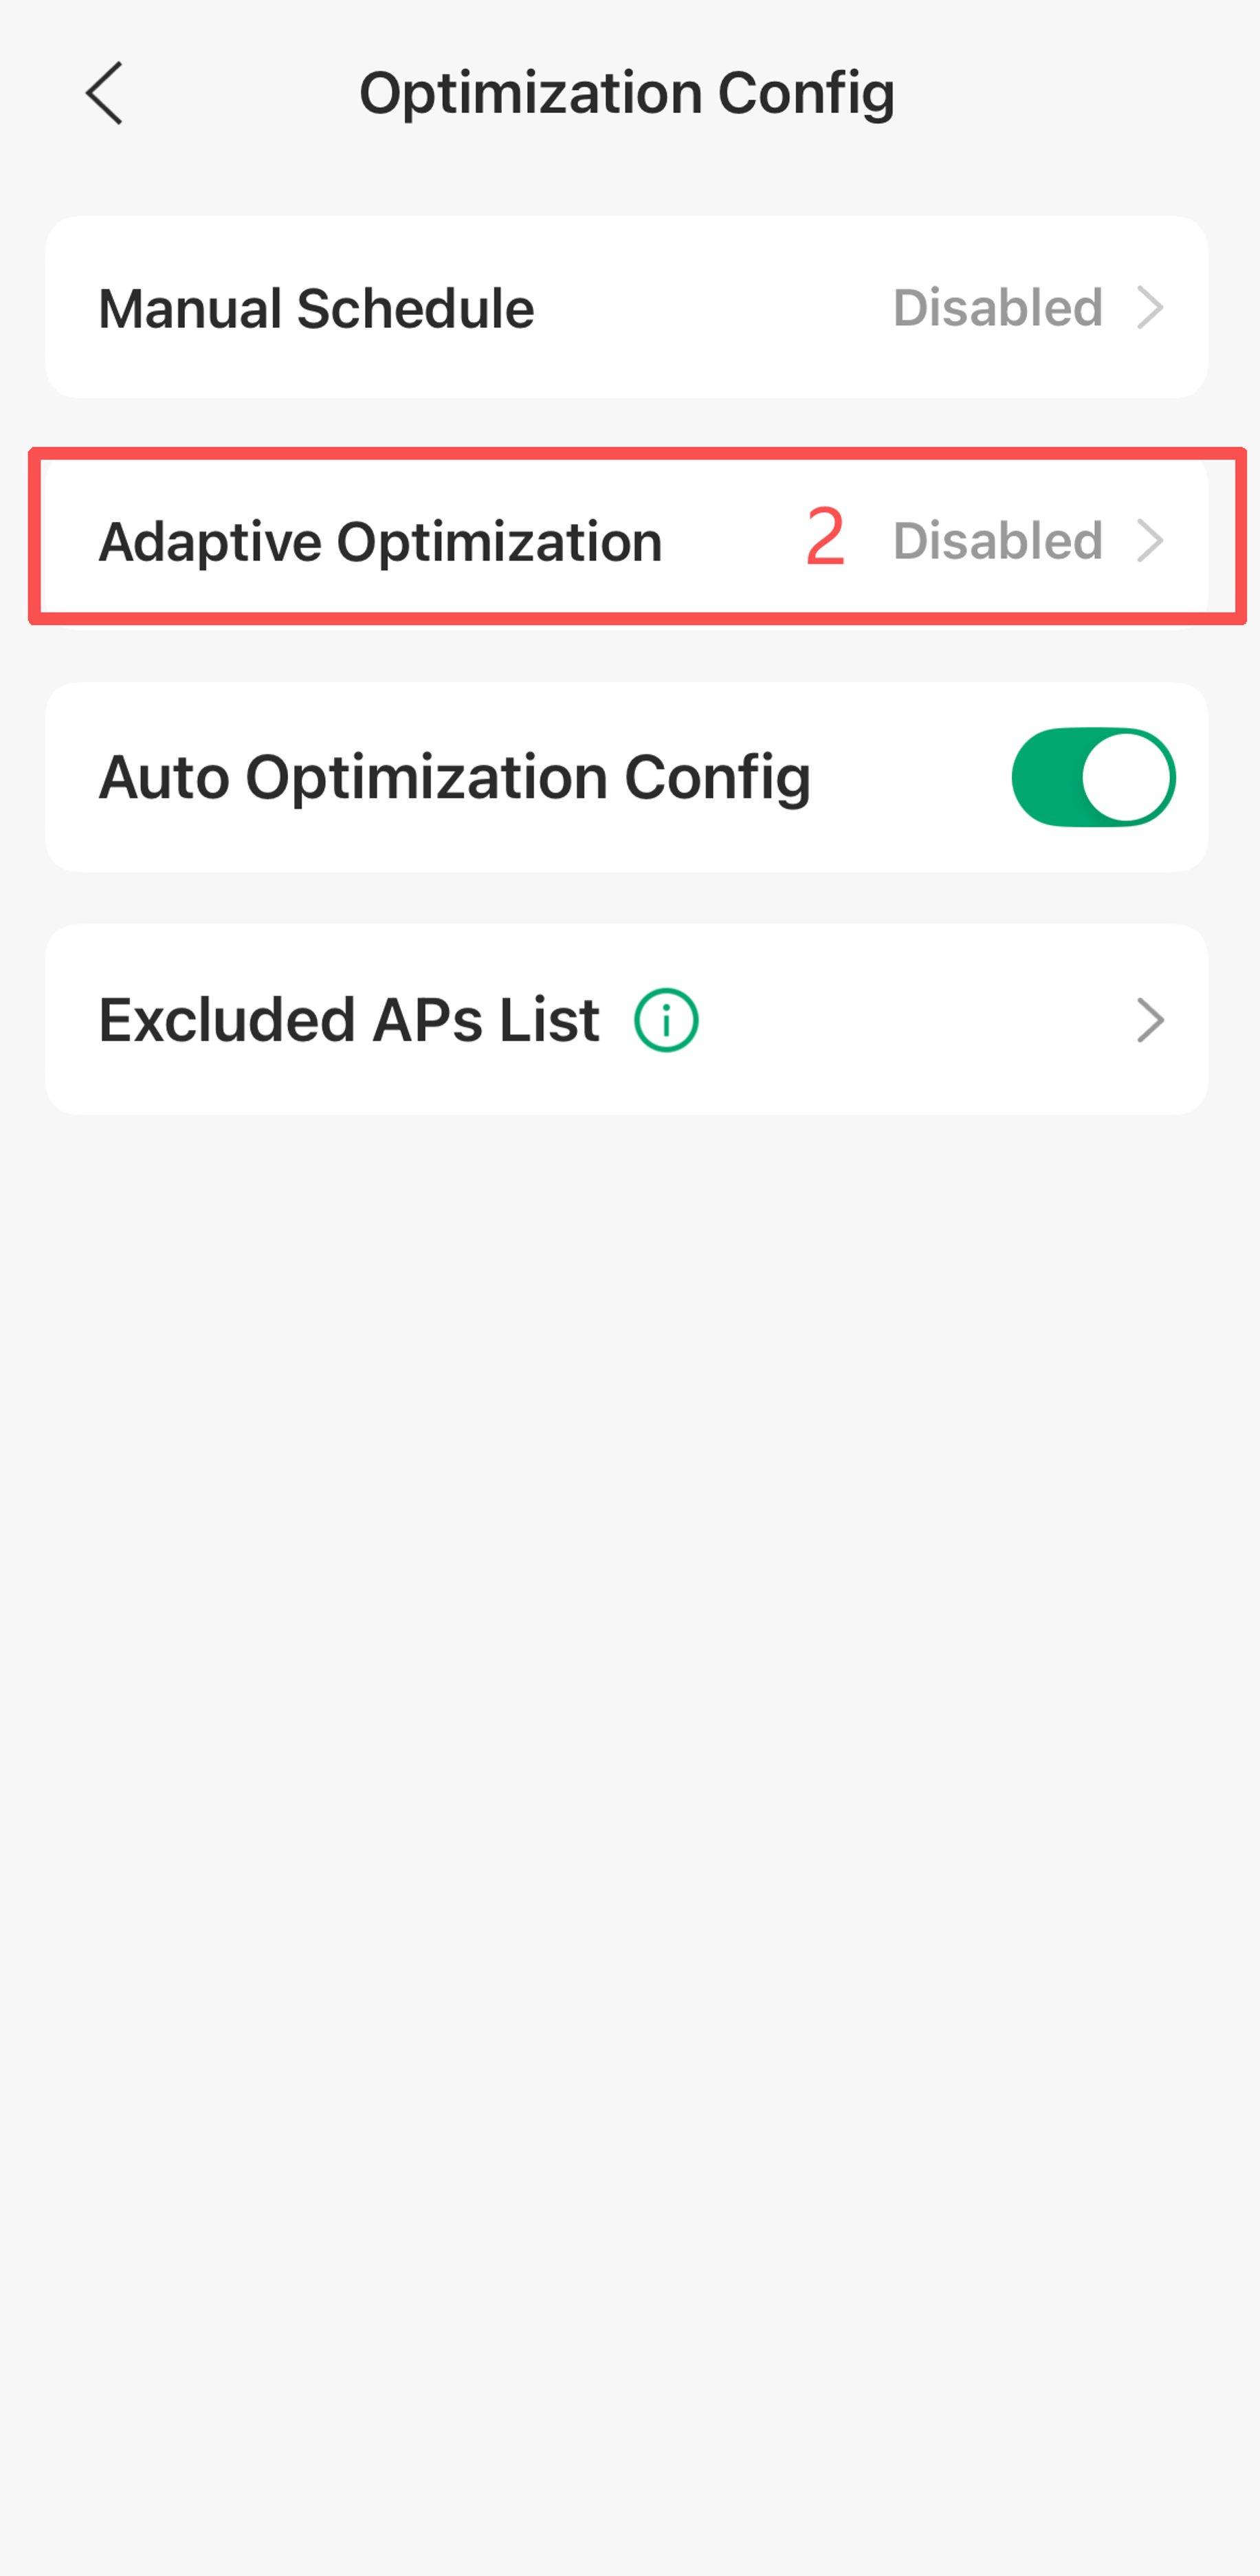
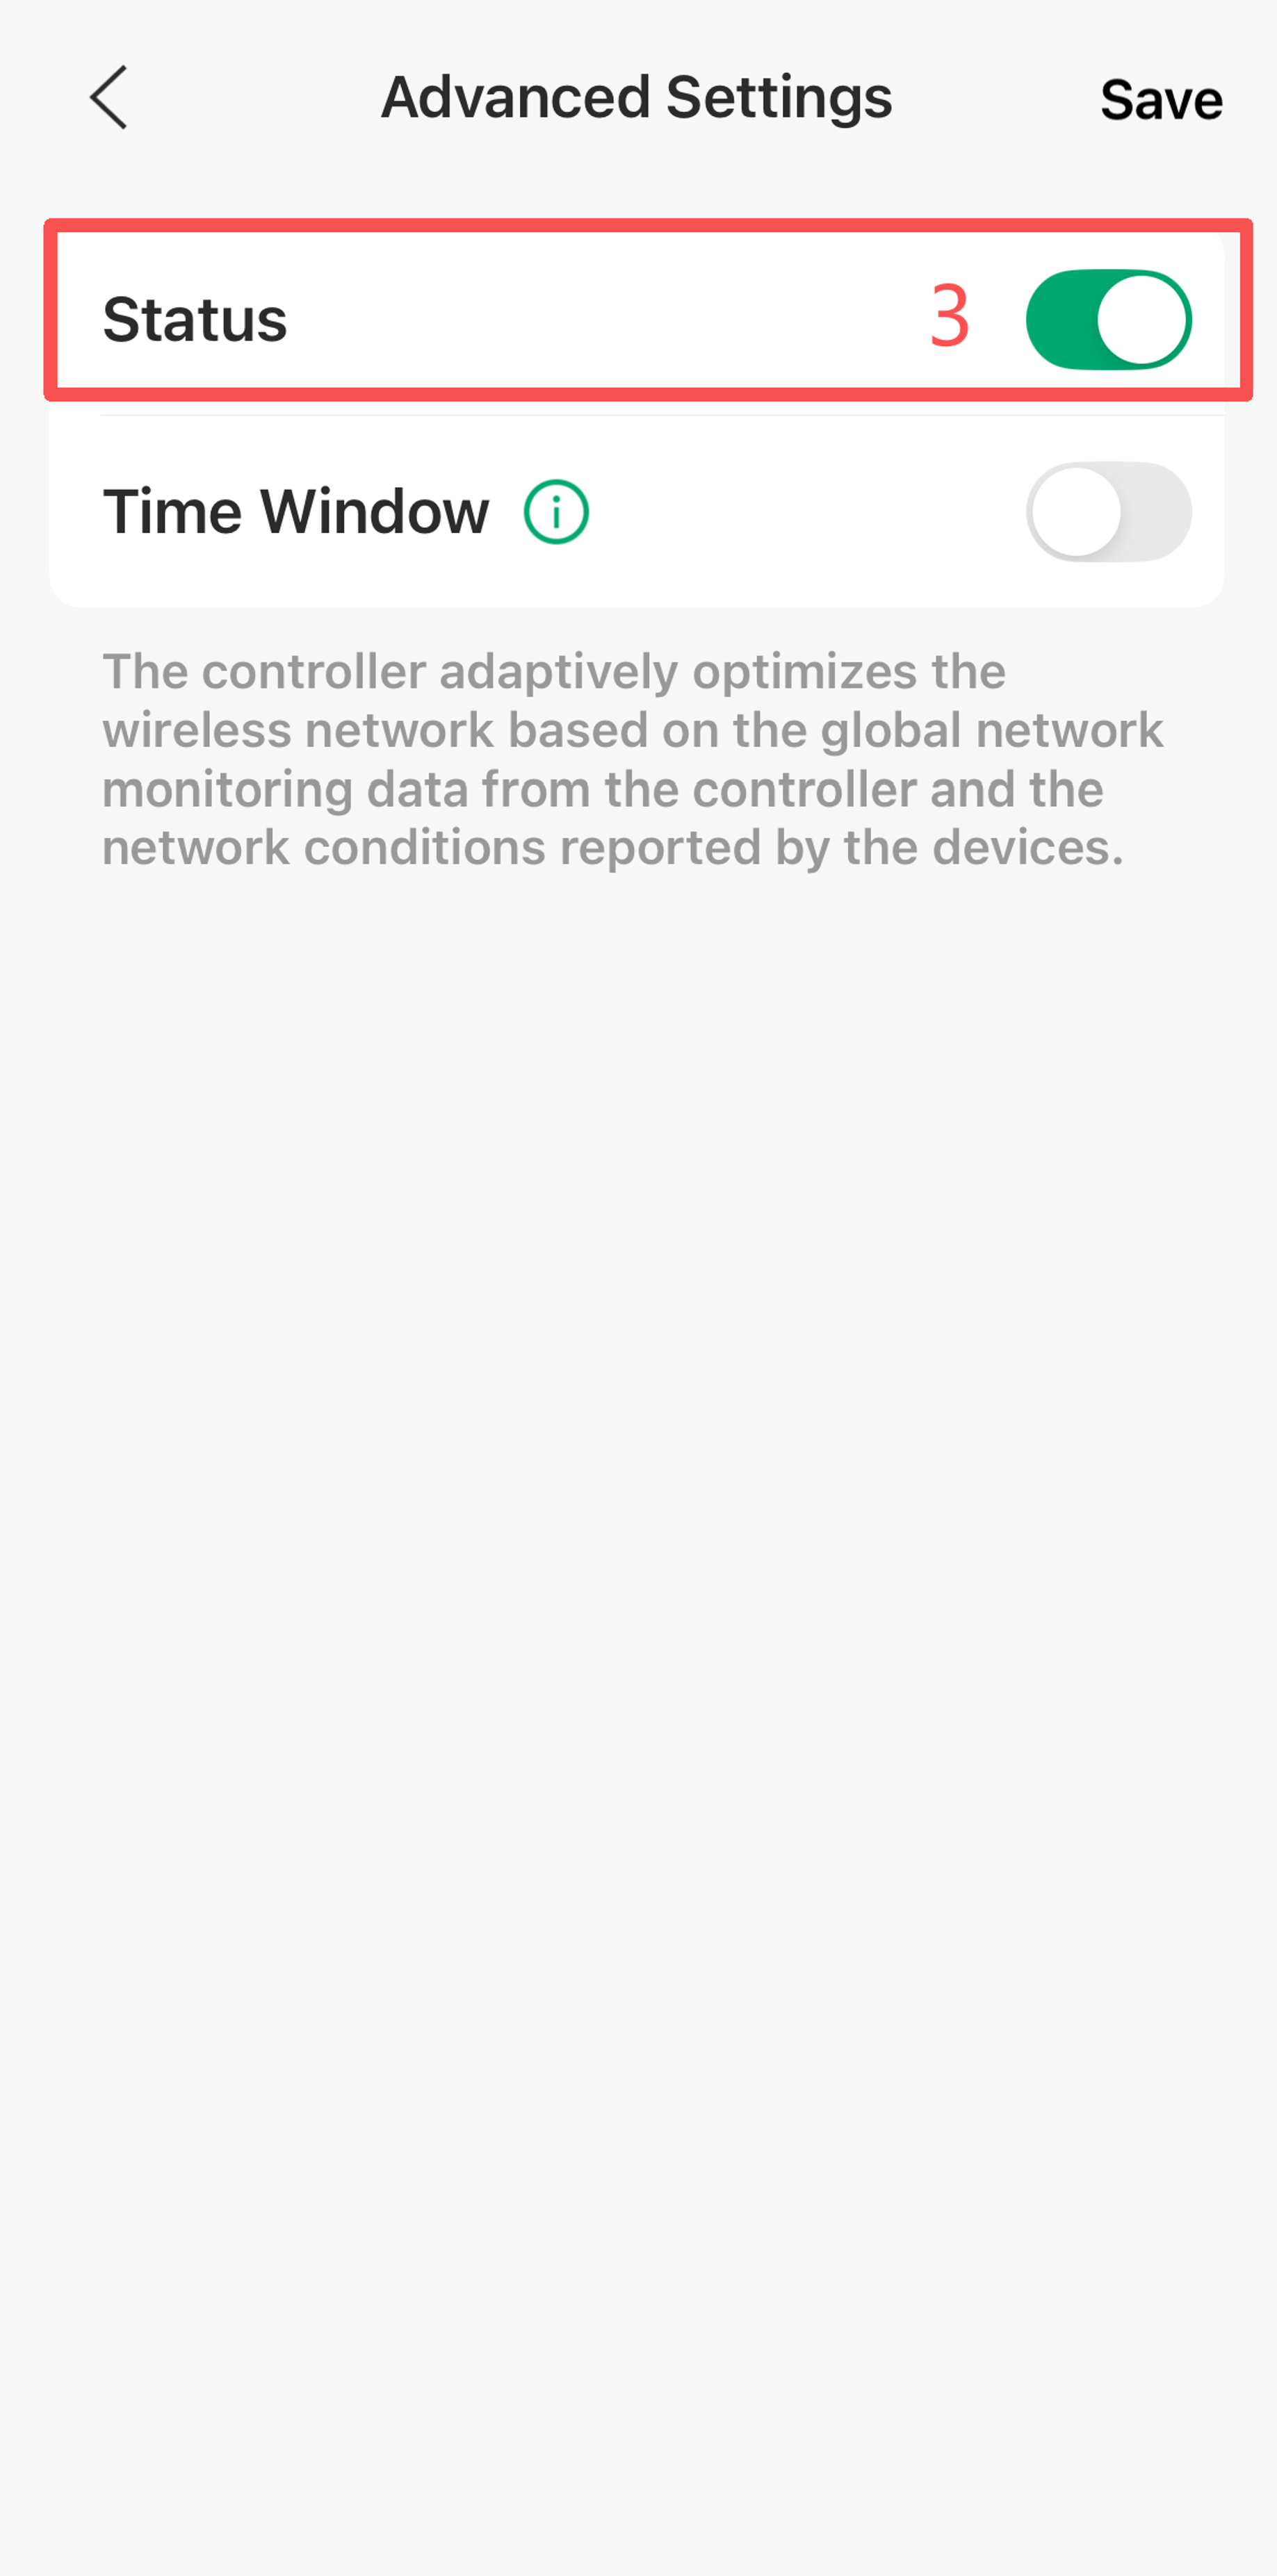
Step 1. Open the Omada App and switch to the Controller mode. After completing the SSID configuration, select the Controller for which you want to perform wireless optimization and go to Site View > Settings > Wireless Networks > WLAN Optimization > Optimization Config > Adaptive Optimization, enable the Status button.

Note: To enable your Omada EAP to support RRM, you need to upgrade the firmware of Omada EAP to the version that supports RRM. For details, please refer to the release notes on the Omada website.
For updating your Omada EAP firmware, please refer to How to Upgrade EAP Firmware in Different Management Modes.
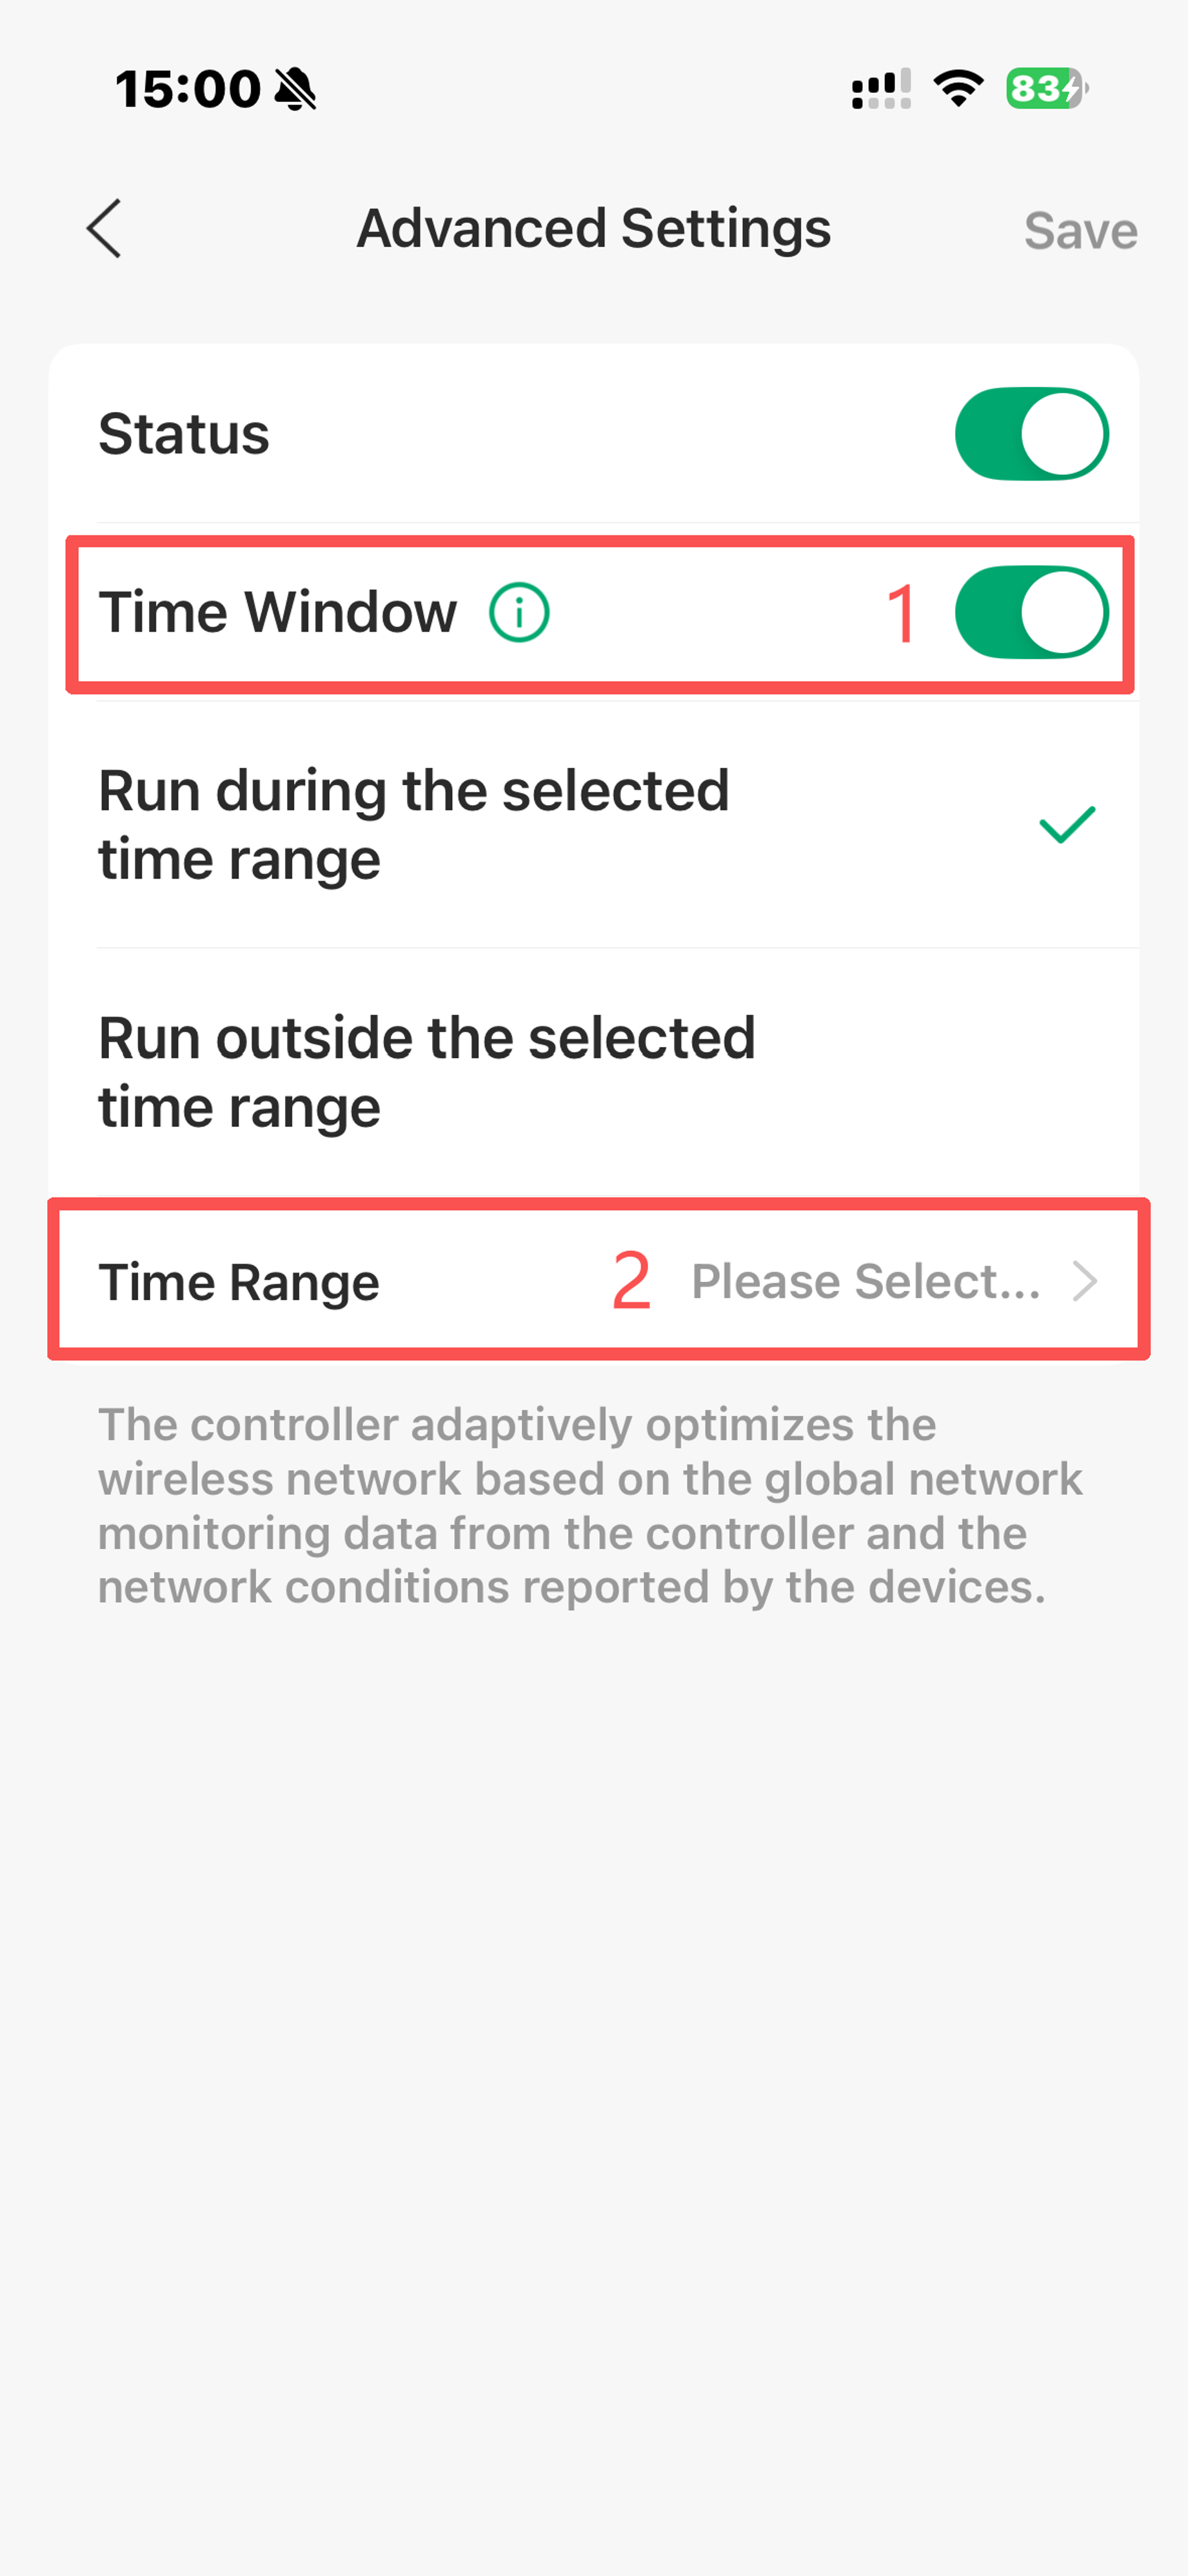
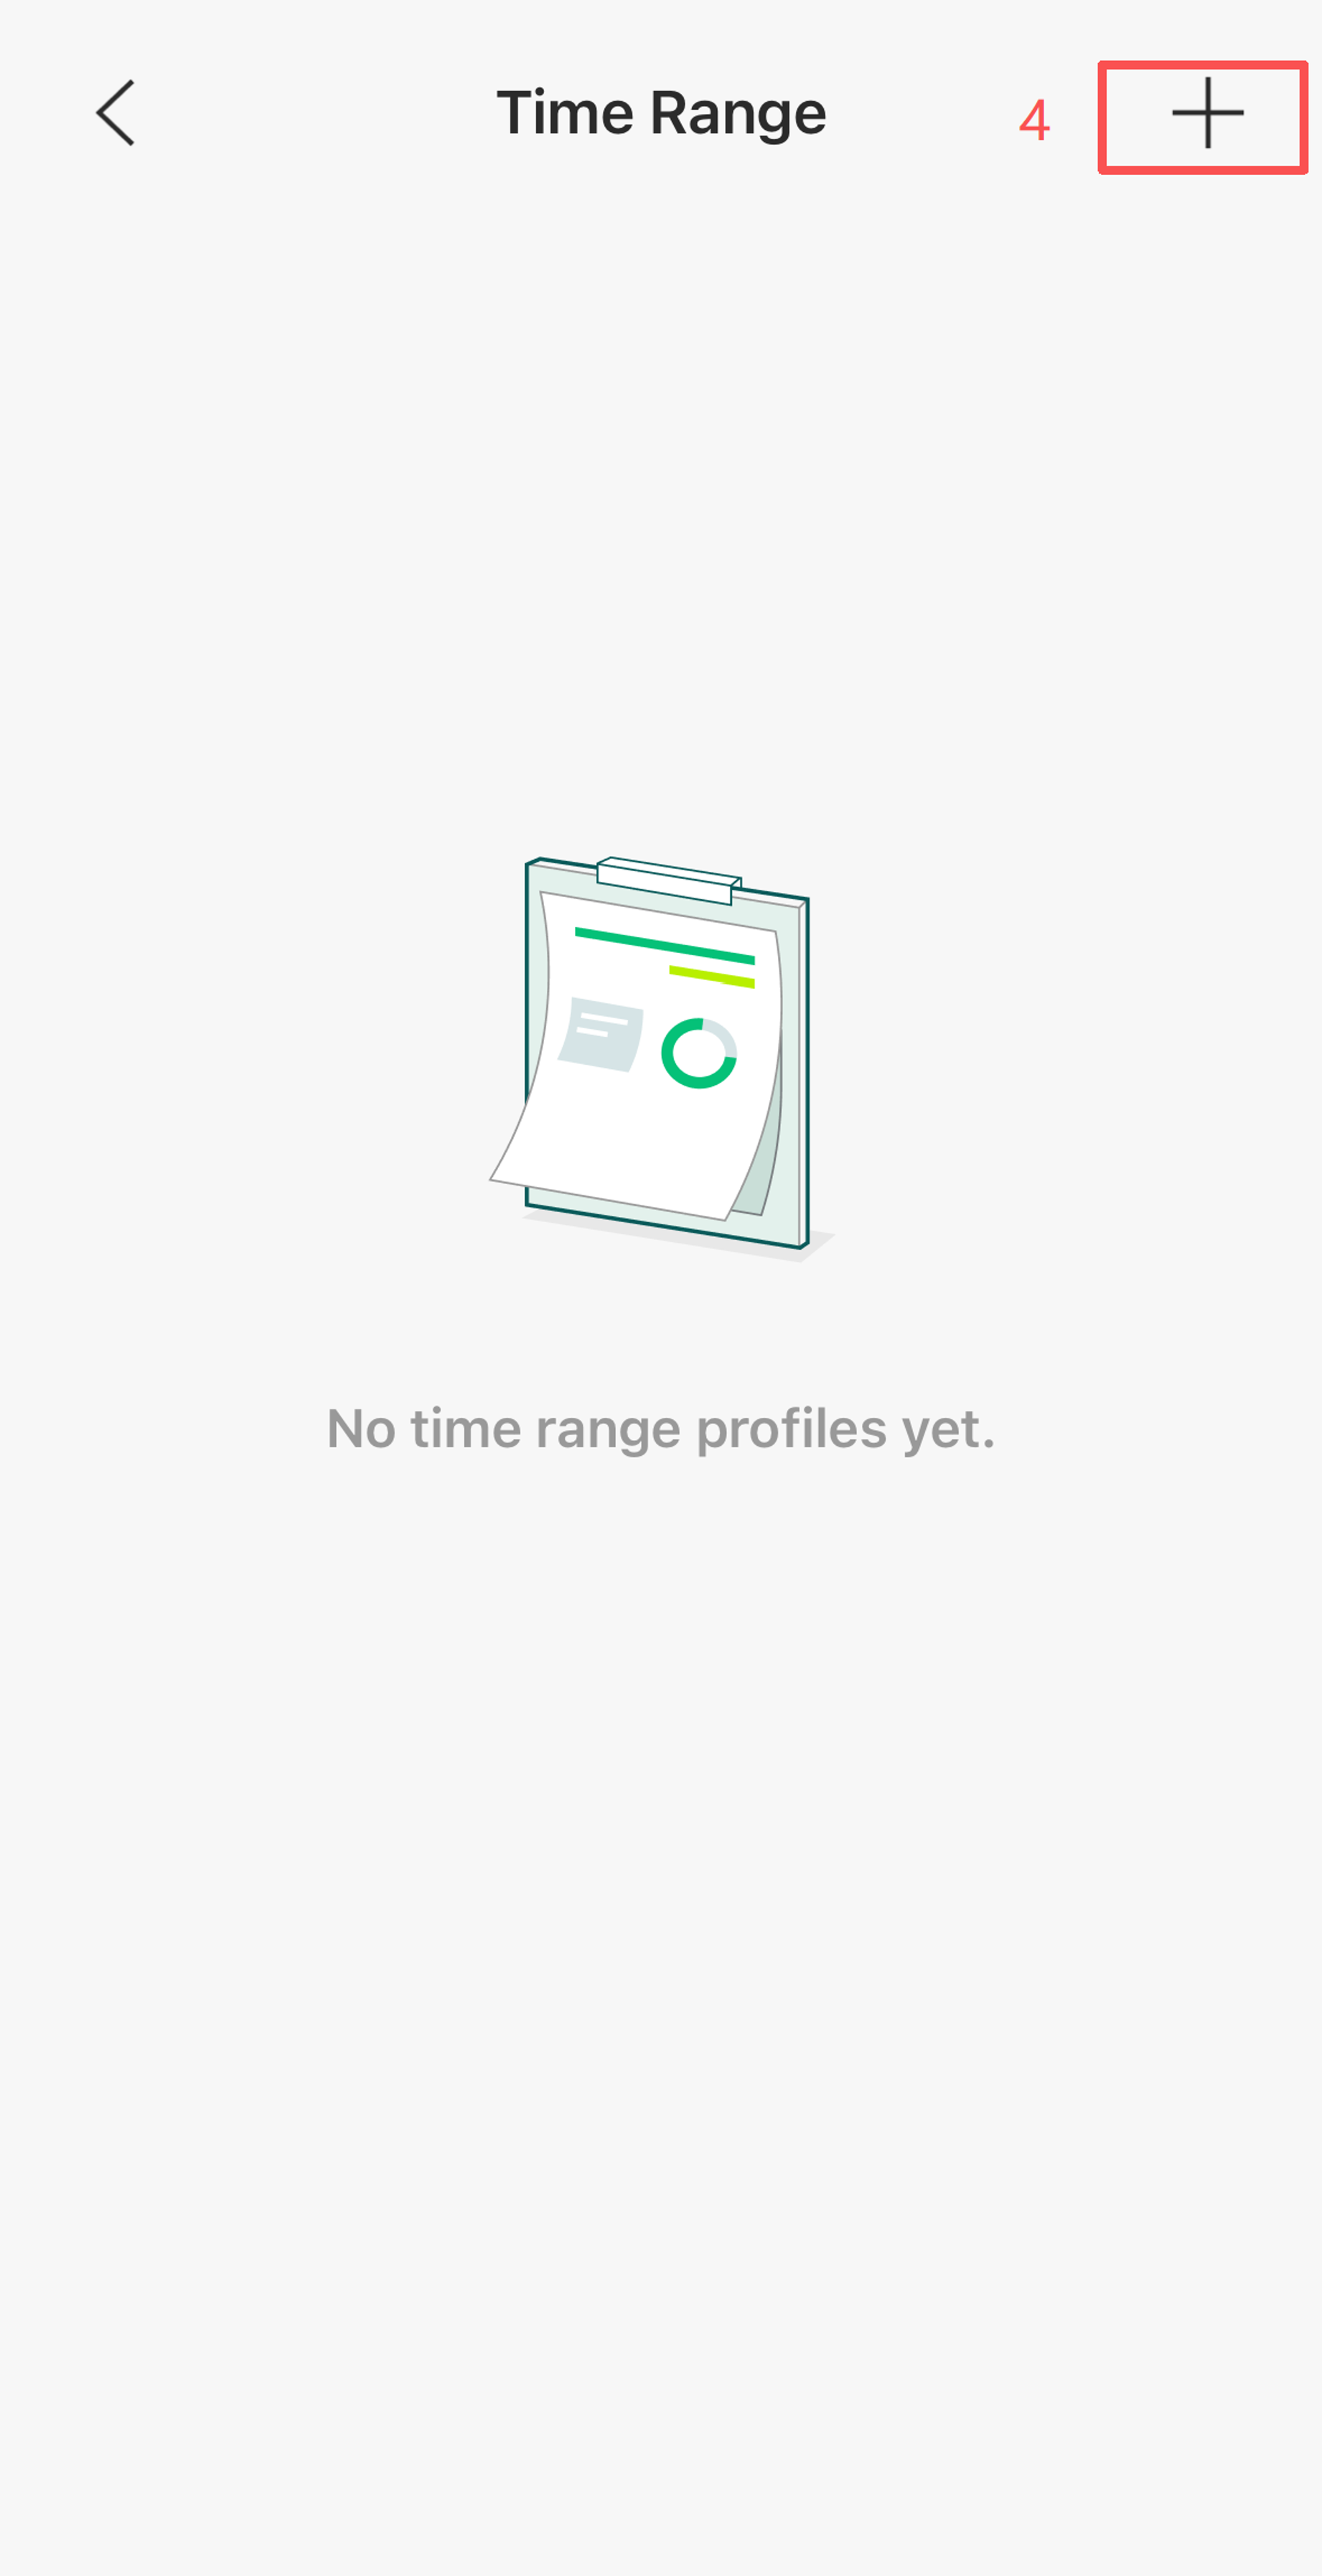
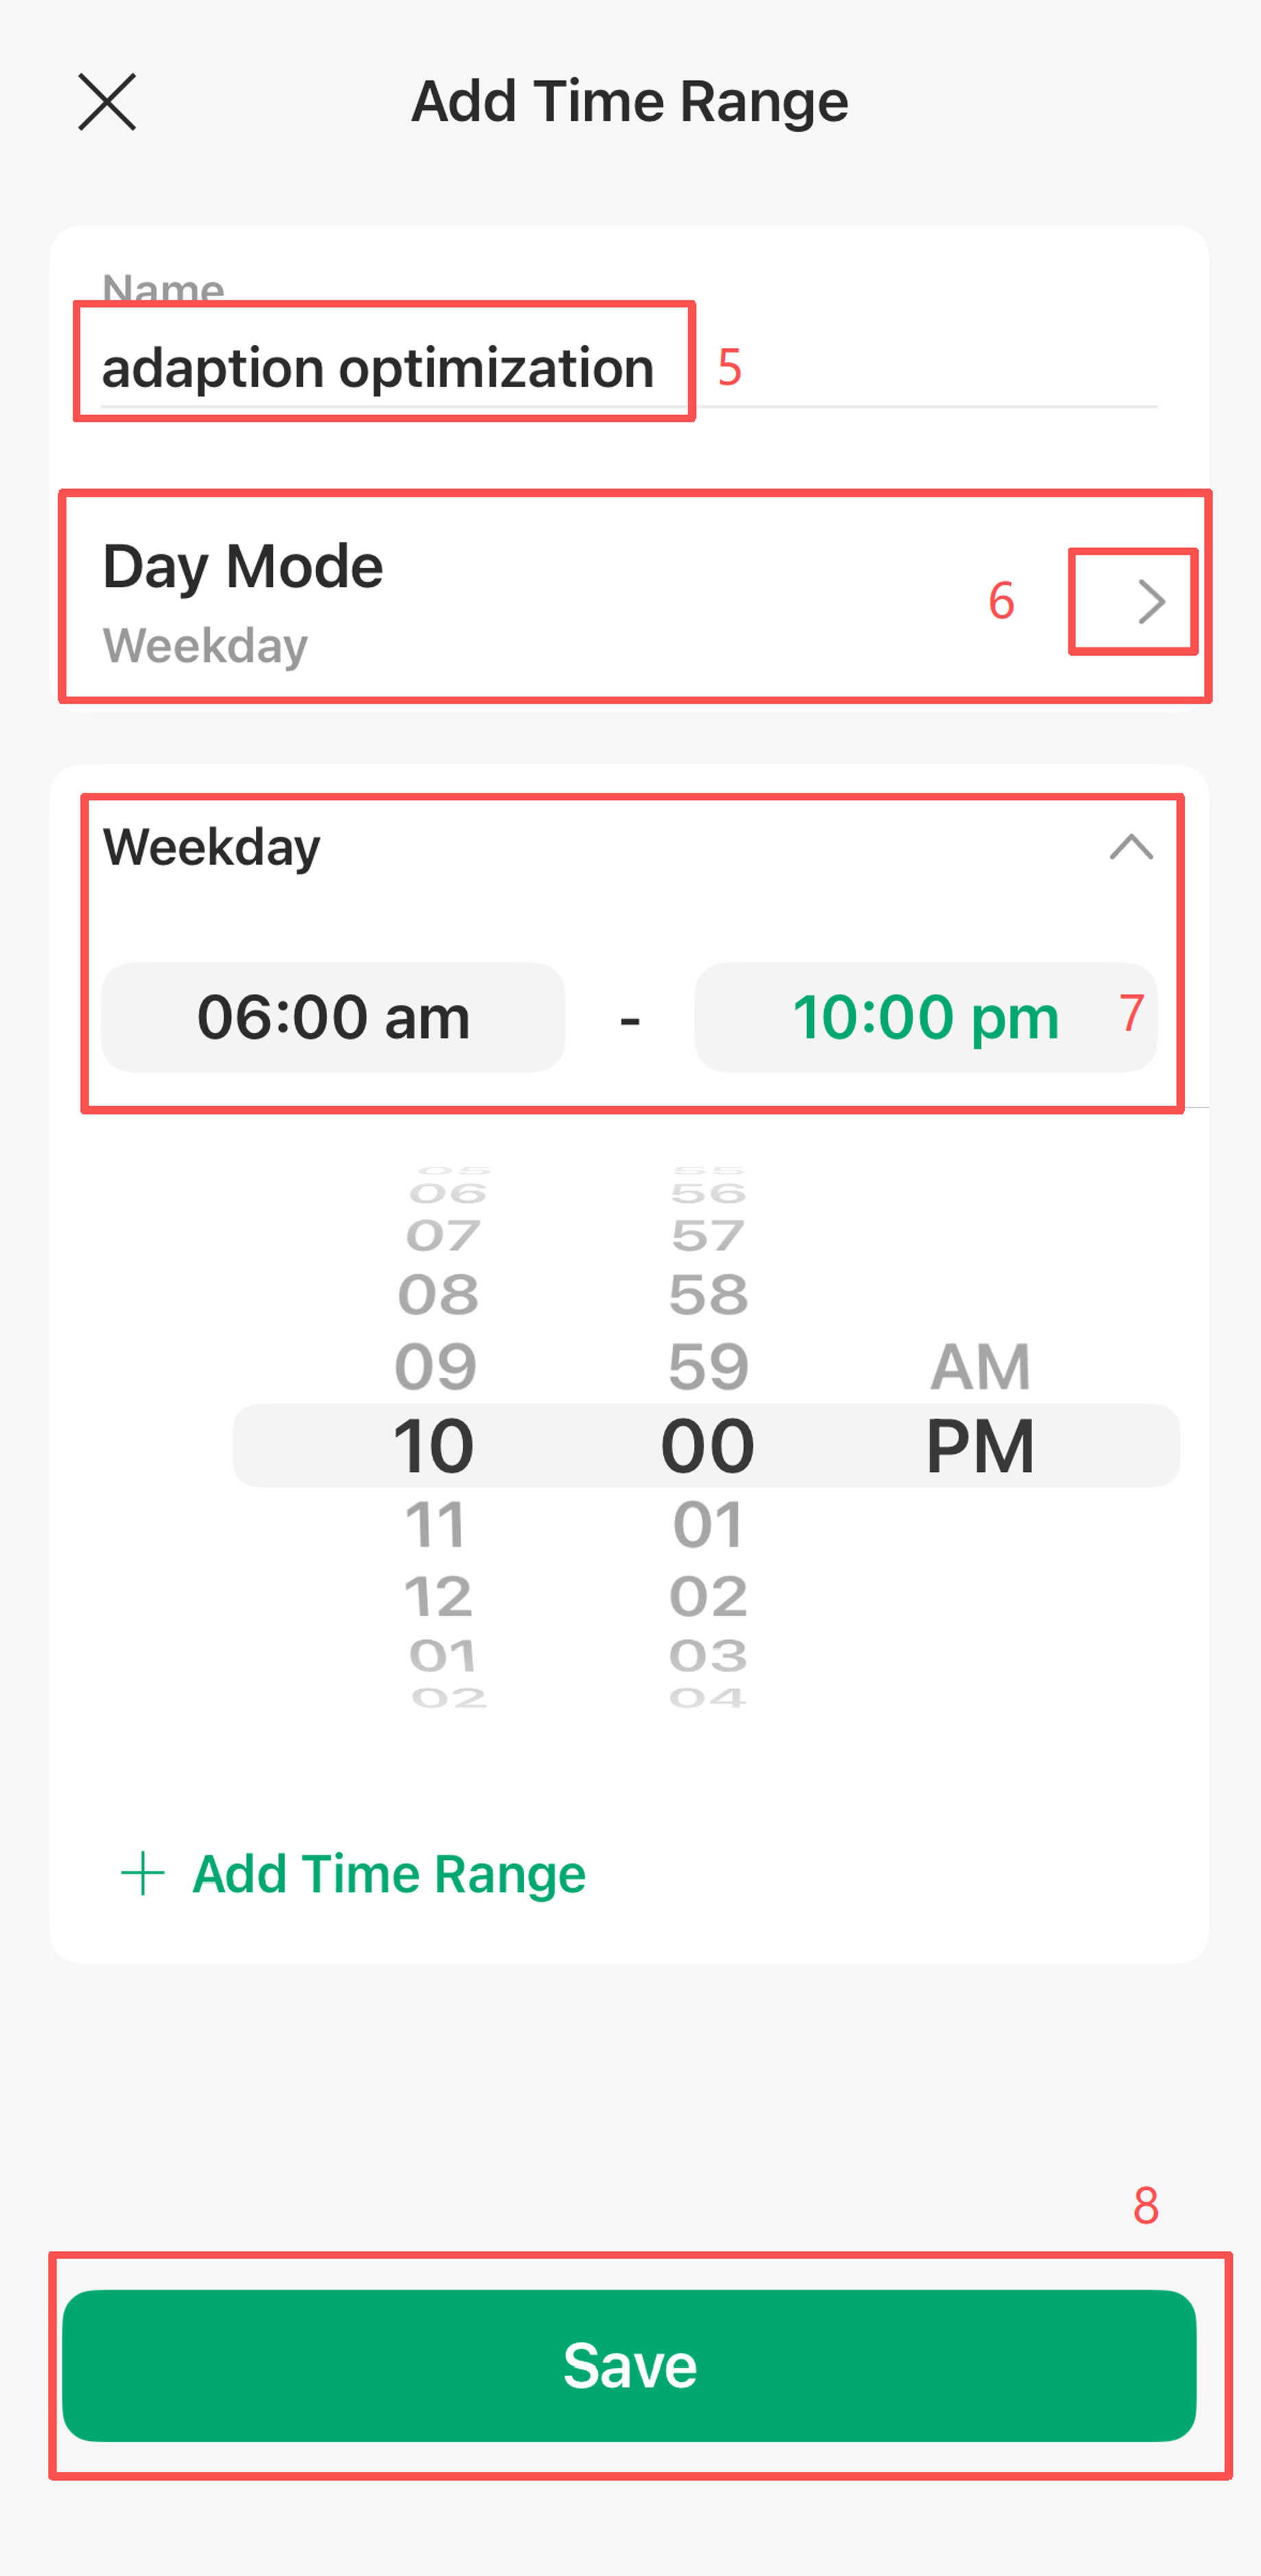
Step 2. Enable the Time Window and configure the Time Range during which the Adaption WLAN Optimization will be executed.
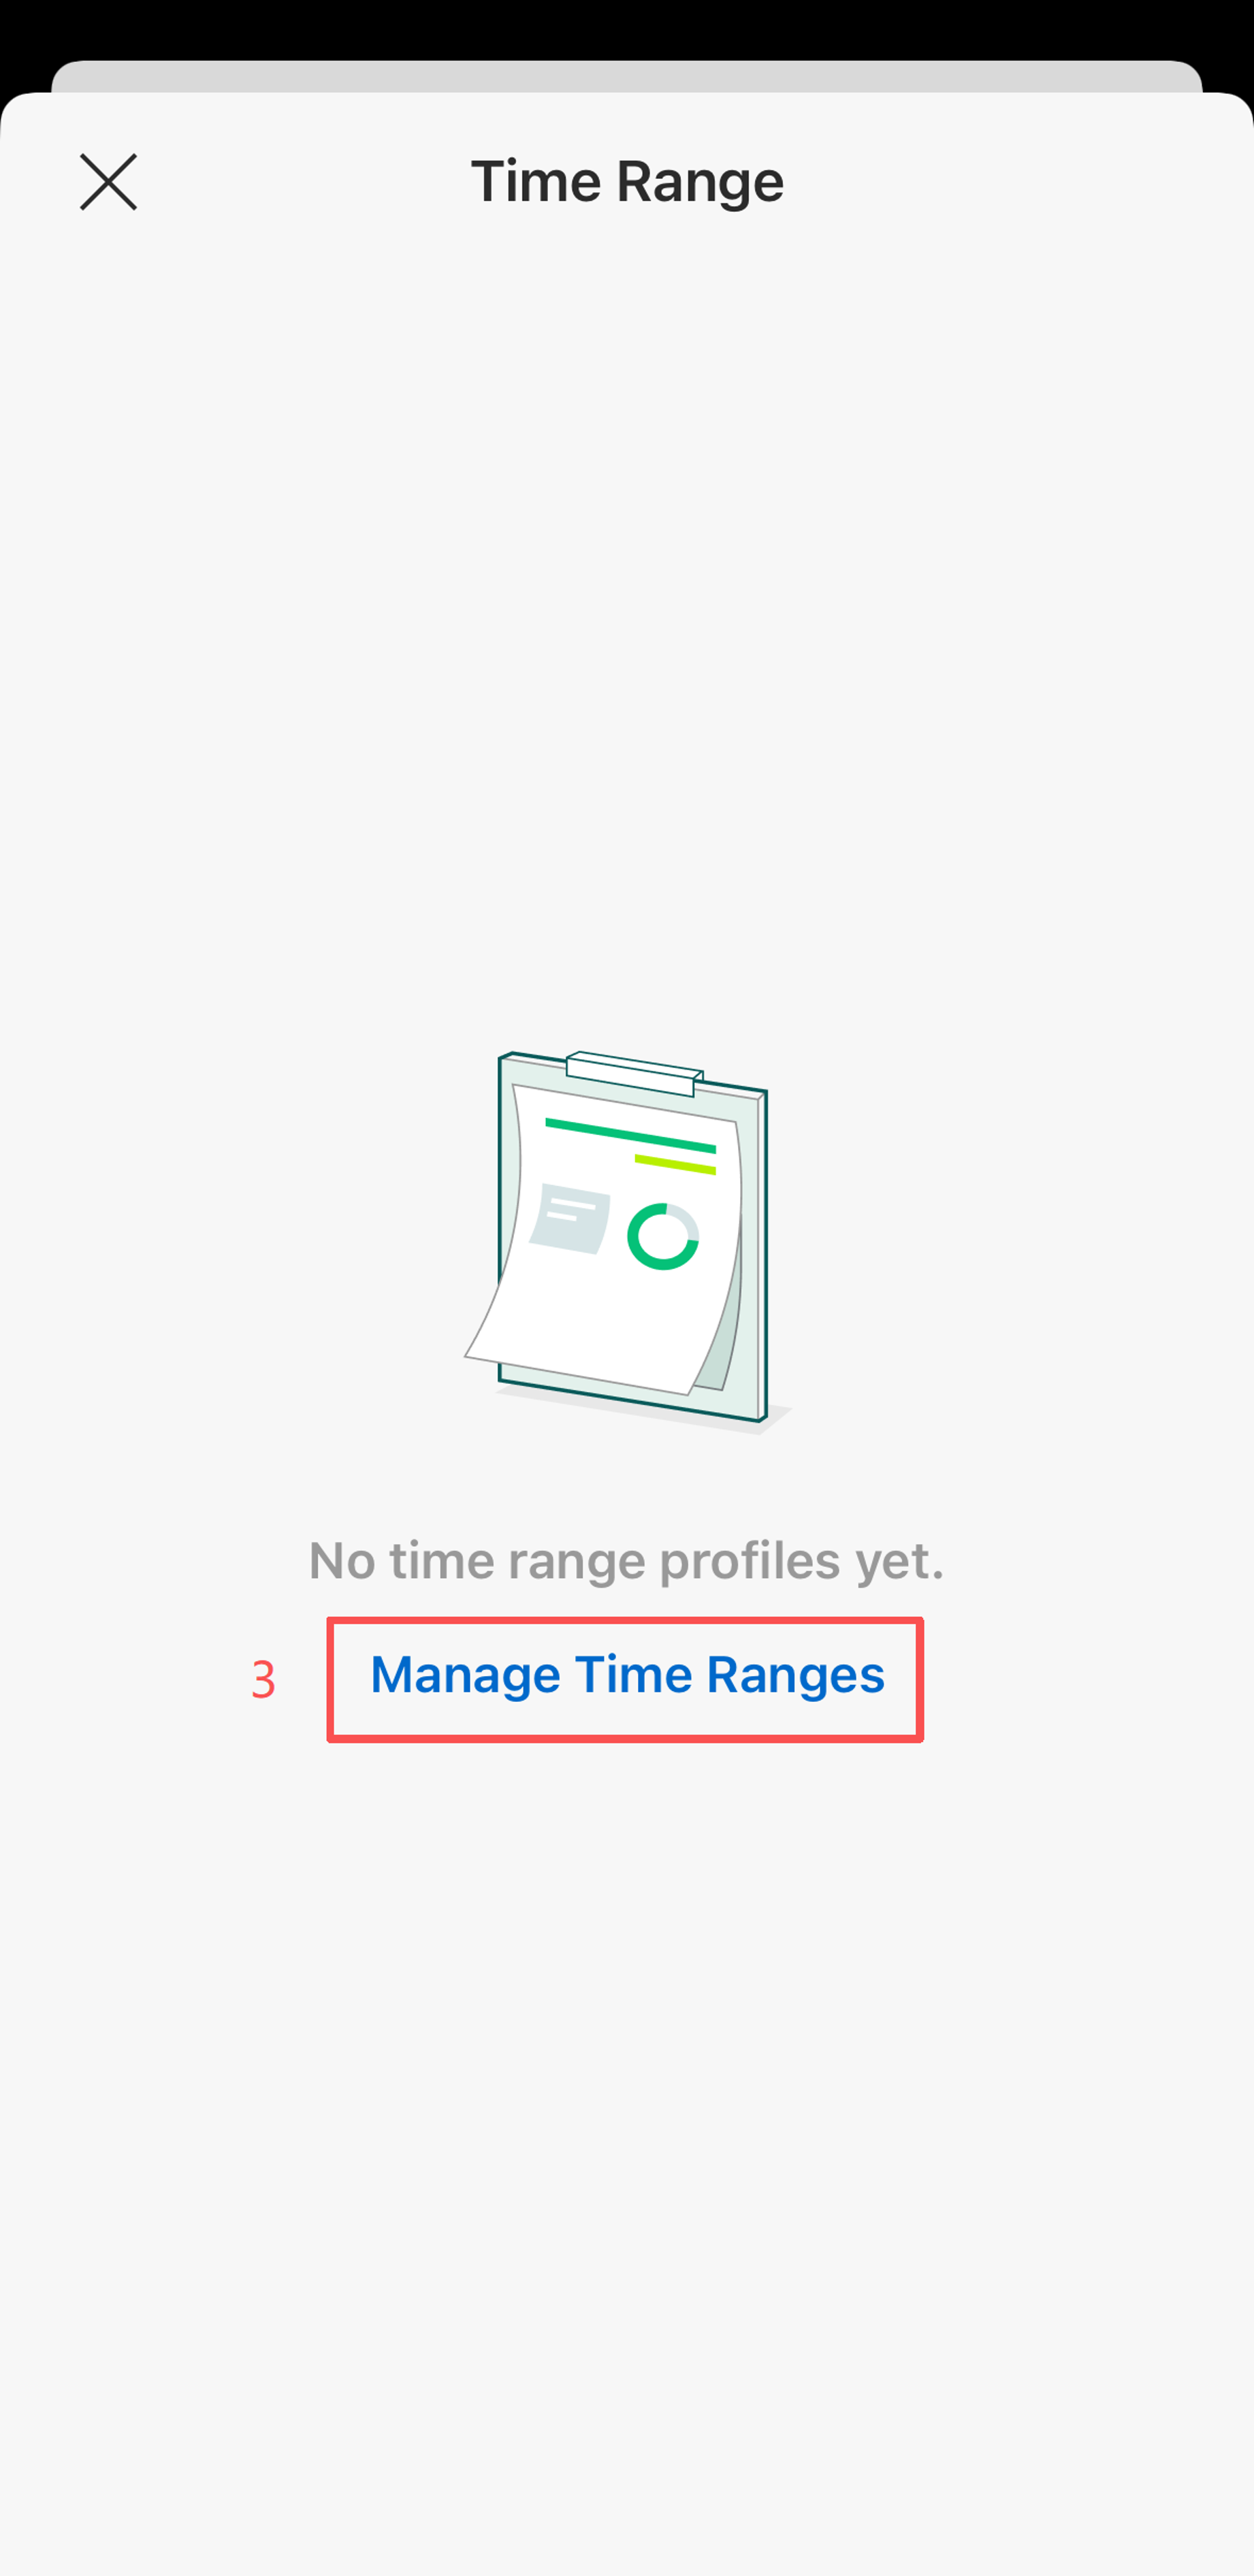
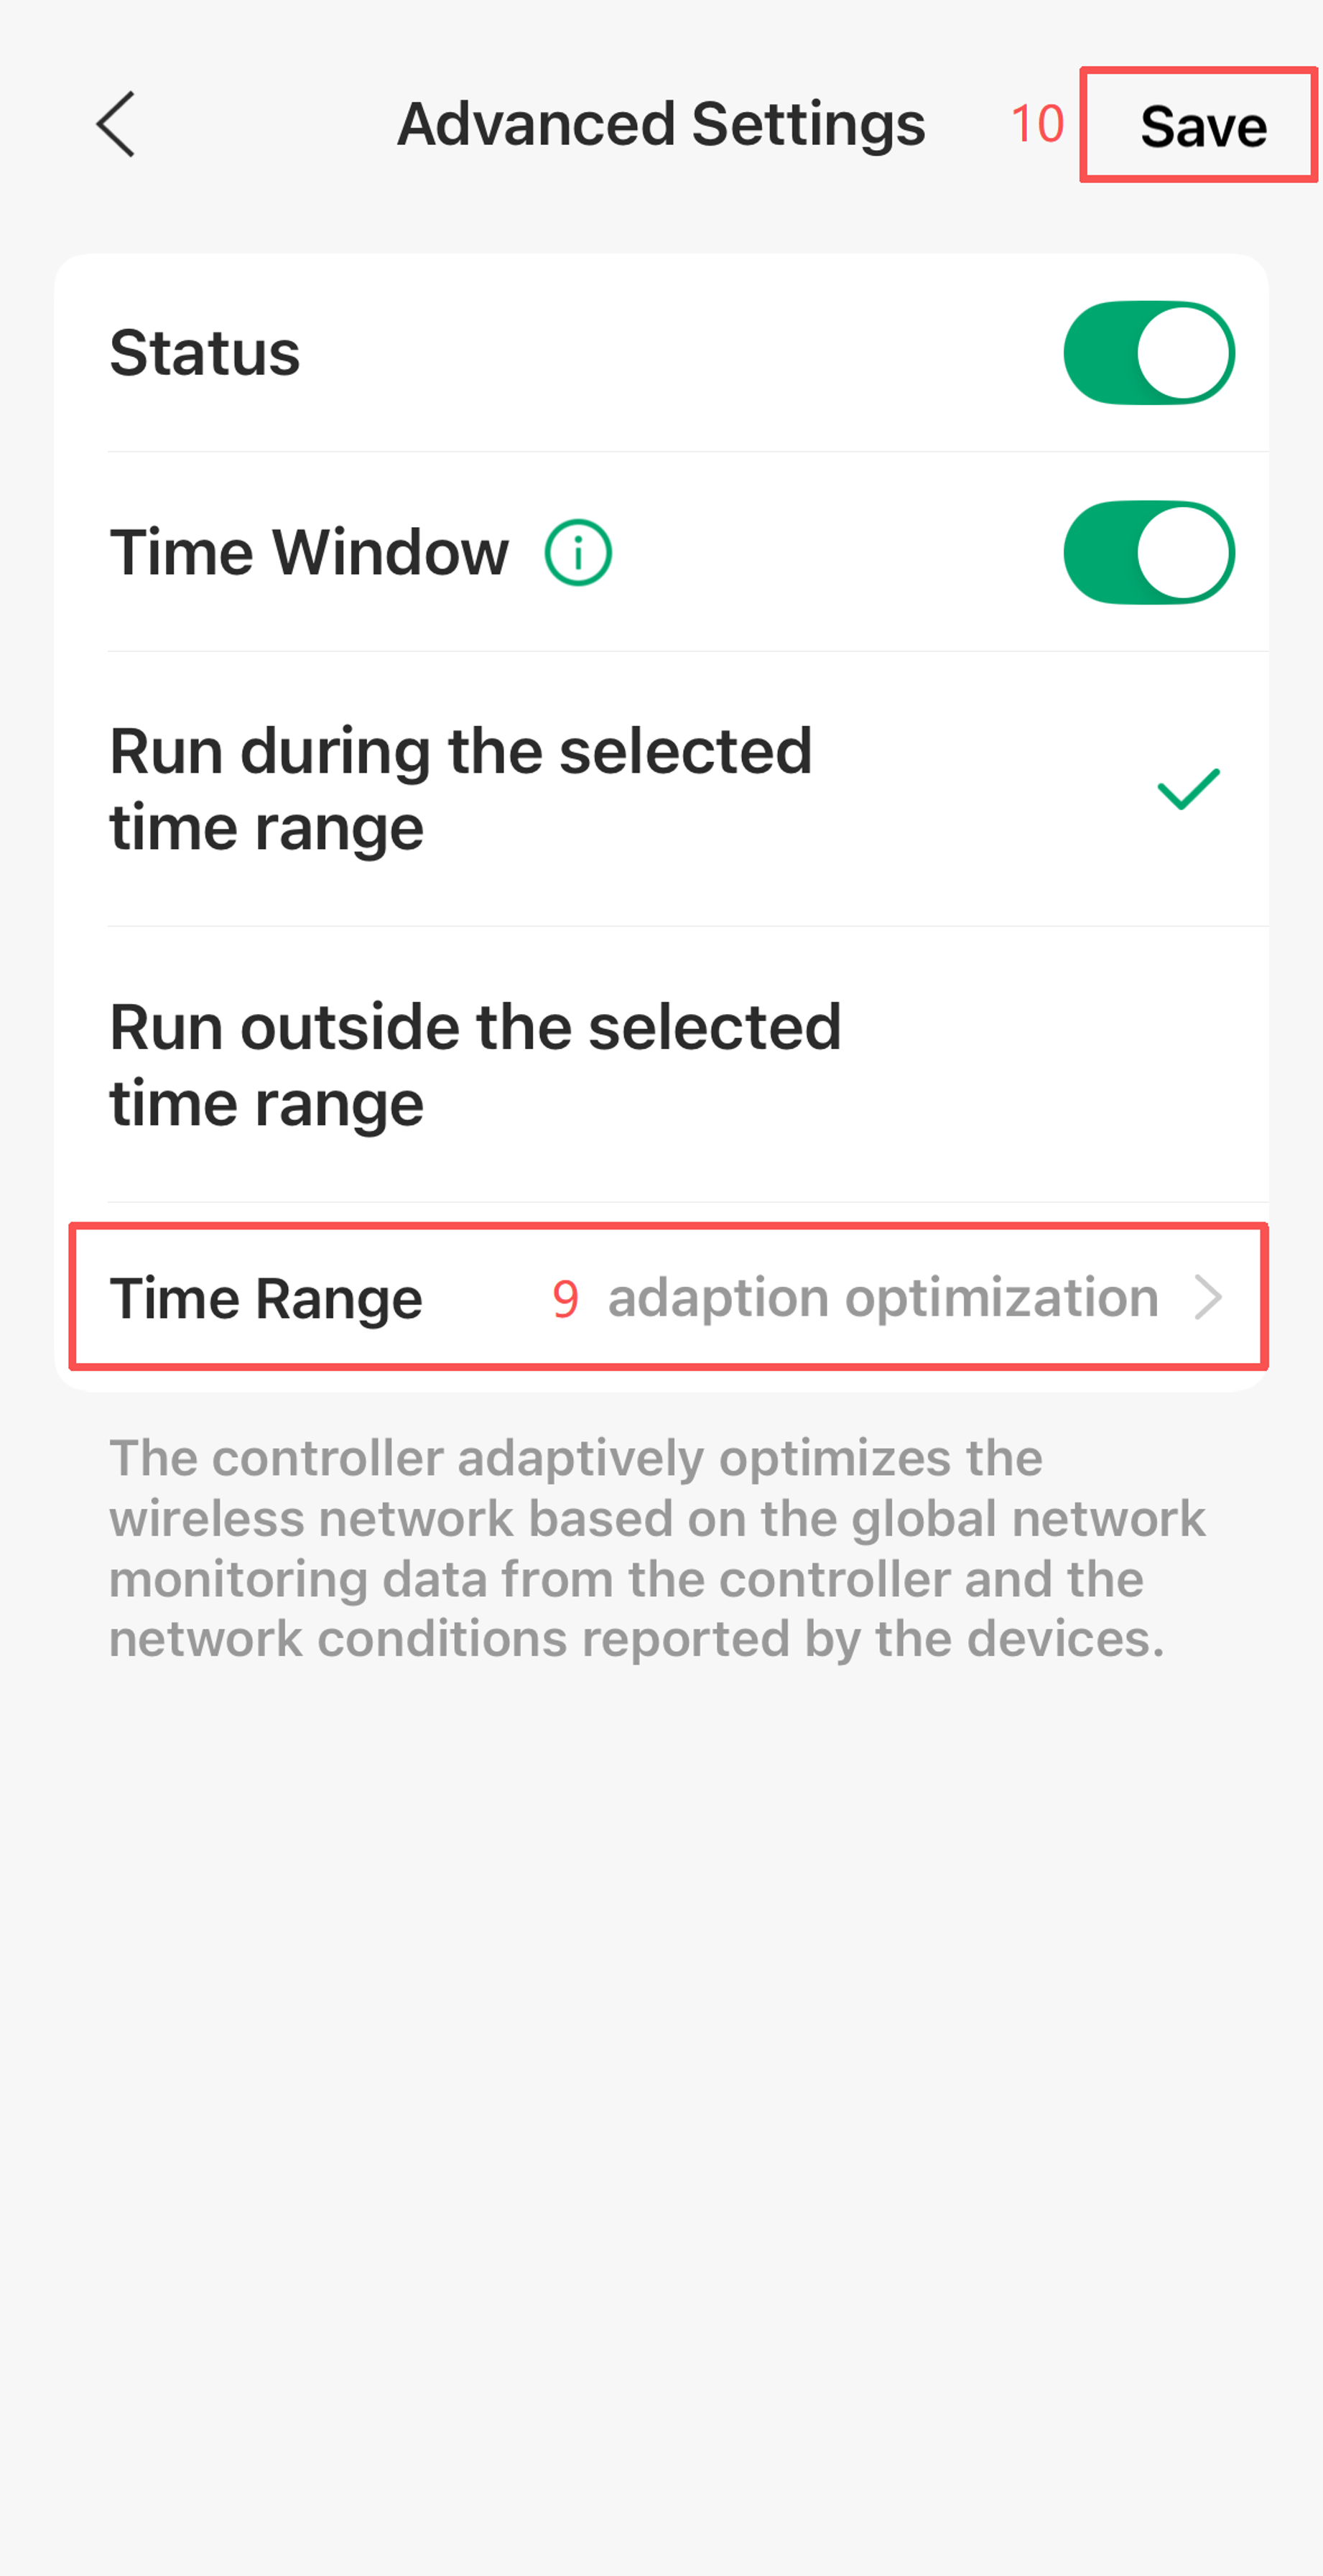
Select the time range you just created and save the adaption WLAN optimization settings.
Advanced Optimization Settings
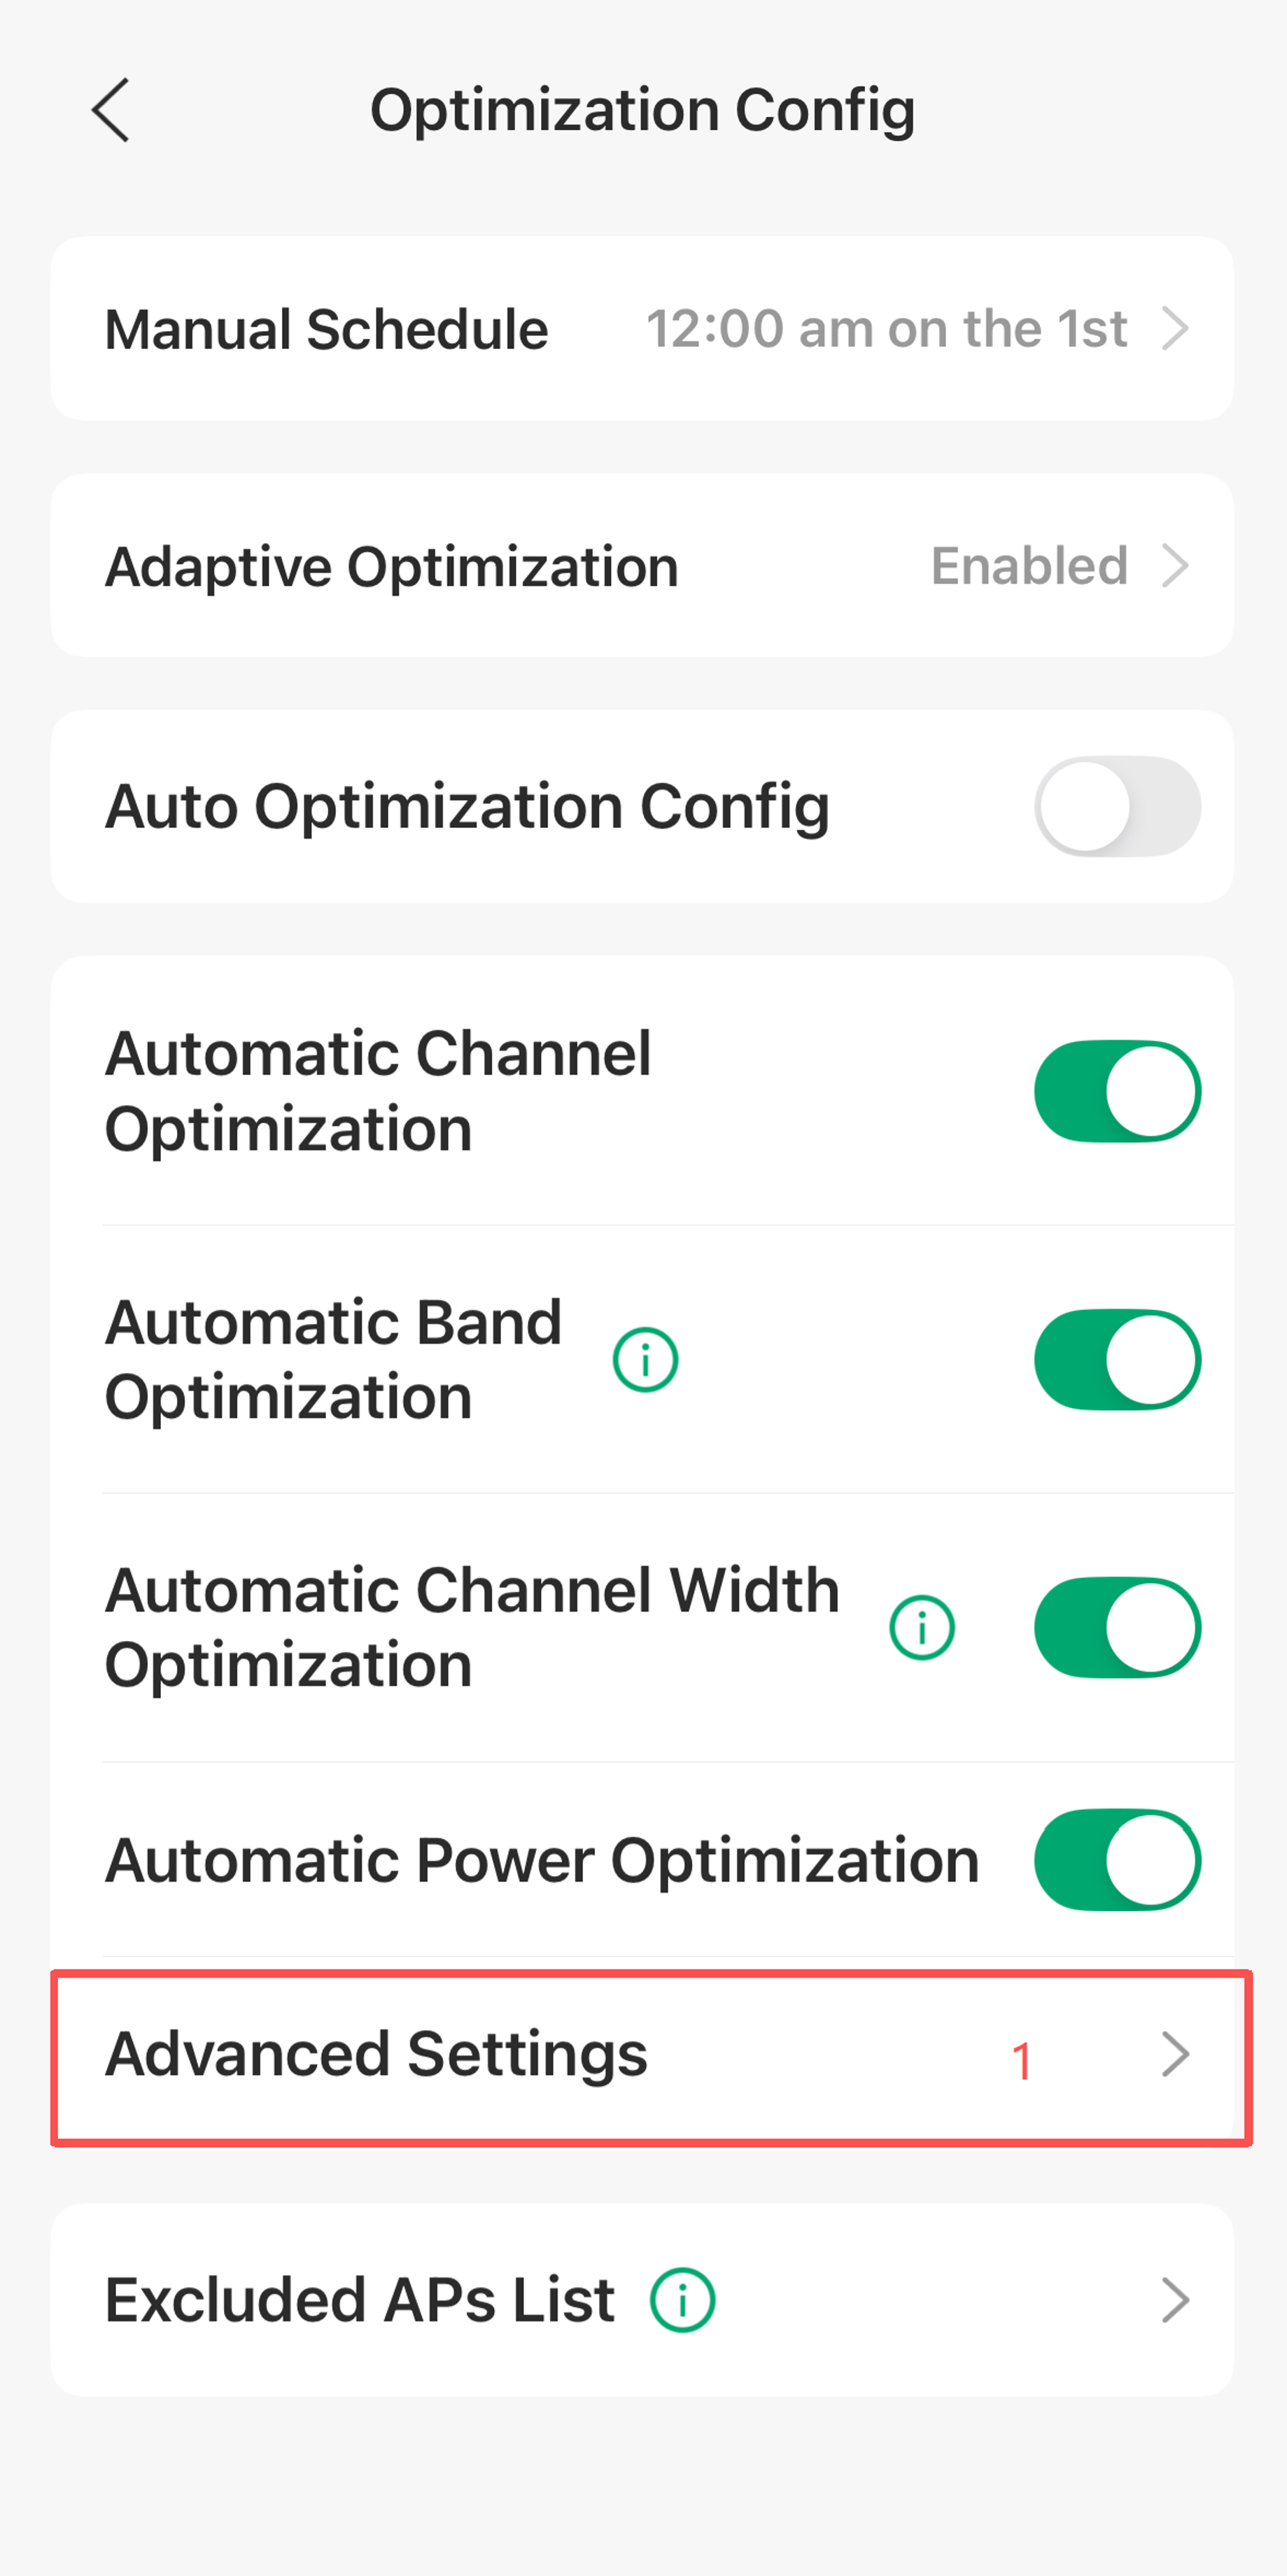
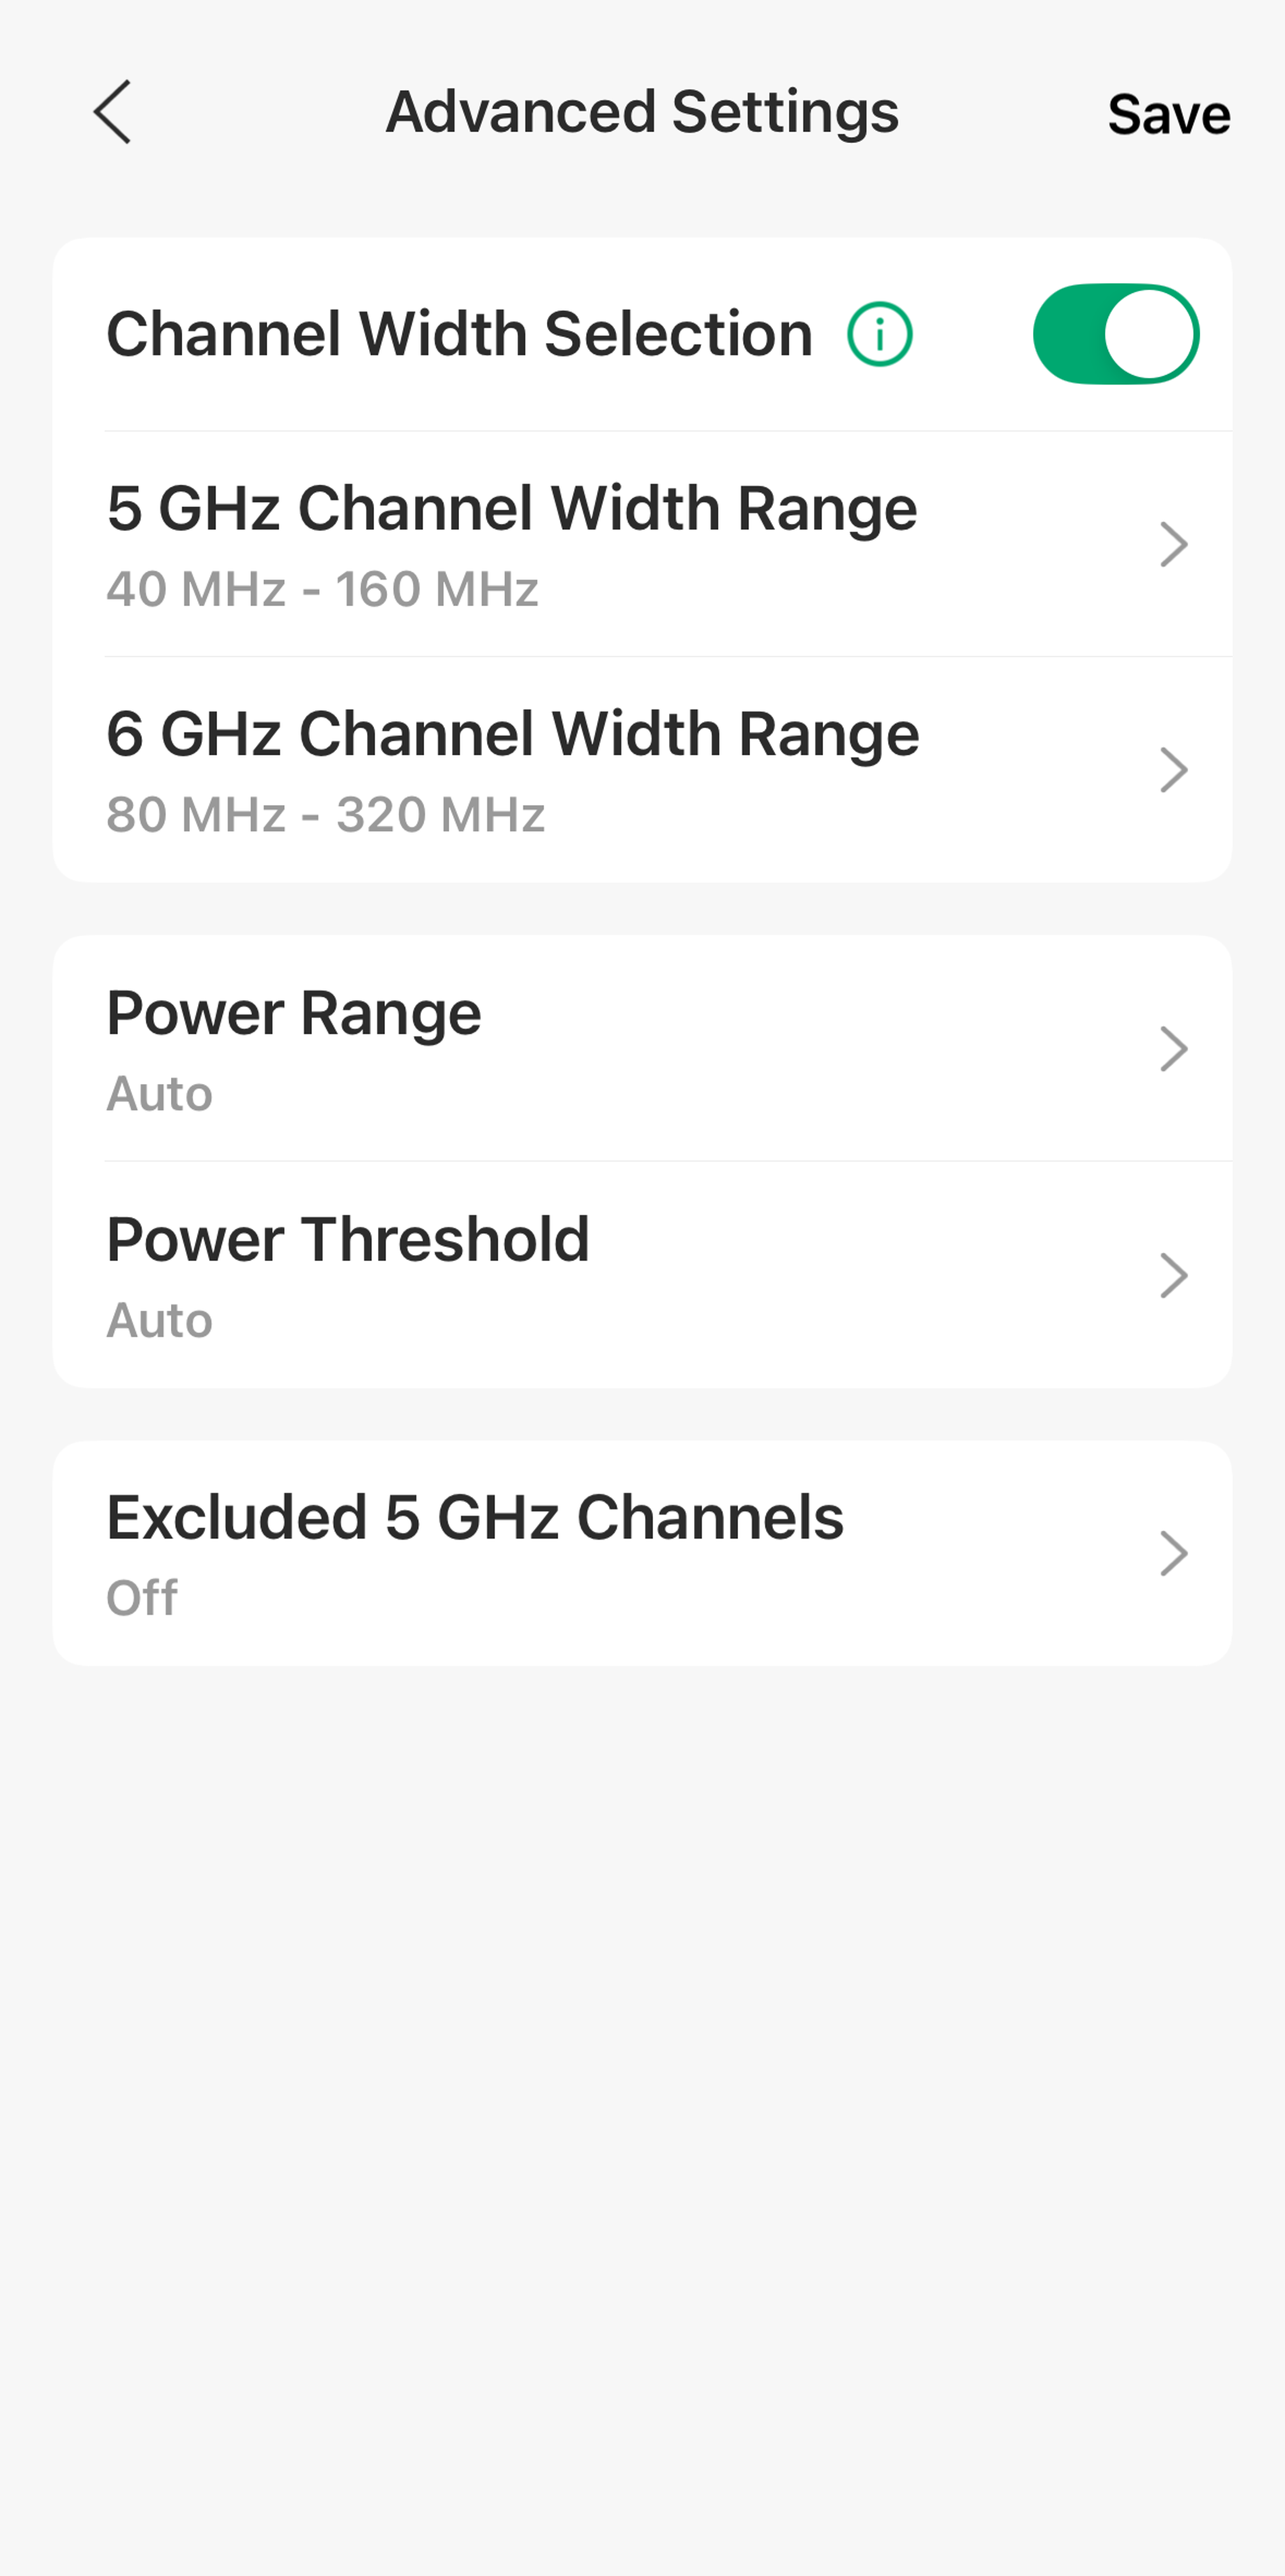
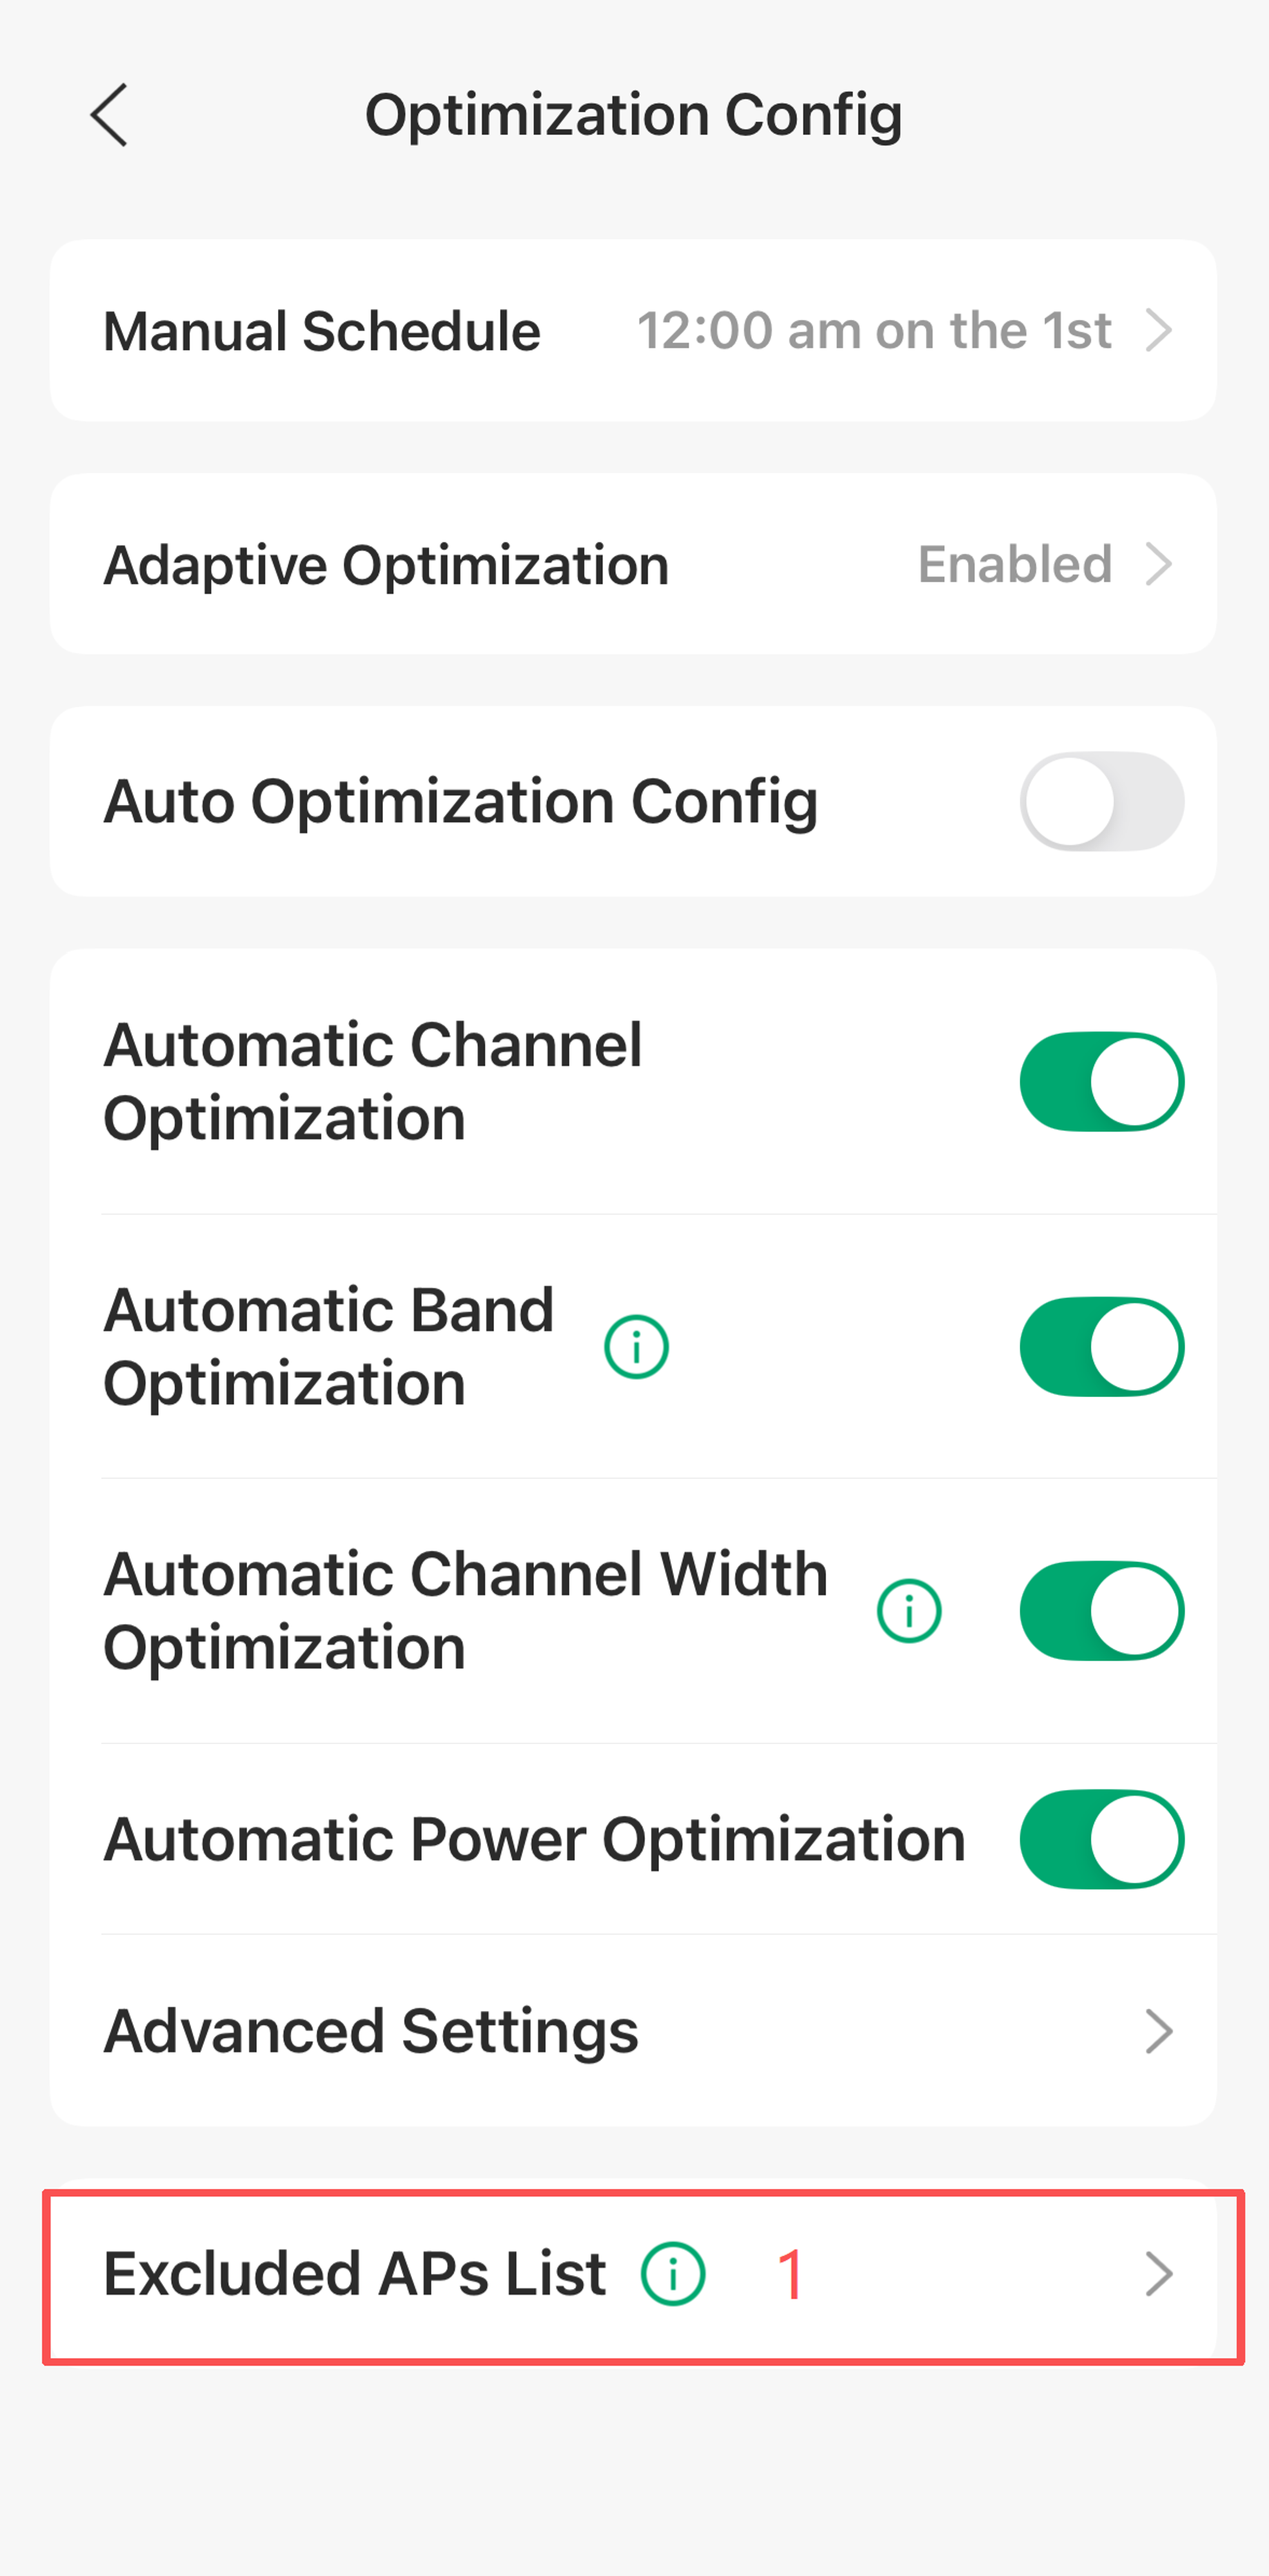
Step 1. When you disable Auto Optimization Config, you can customize optimization parameters in Advanced Settings.
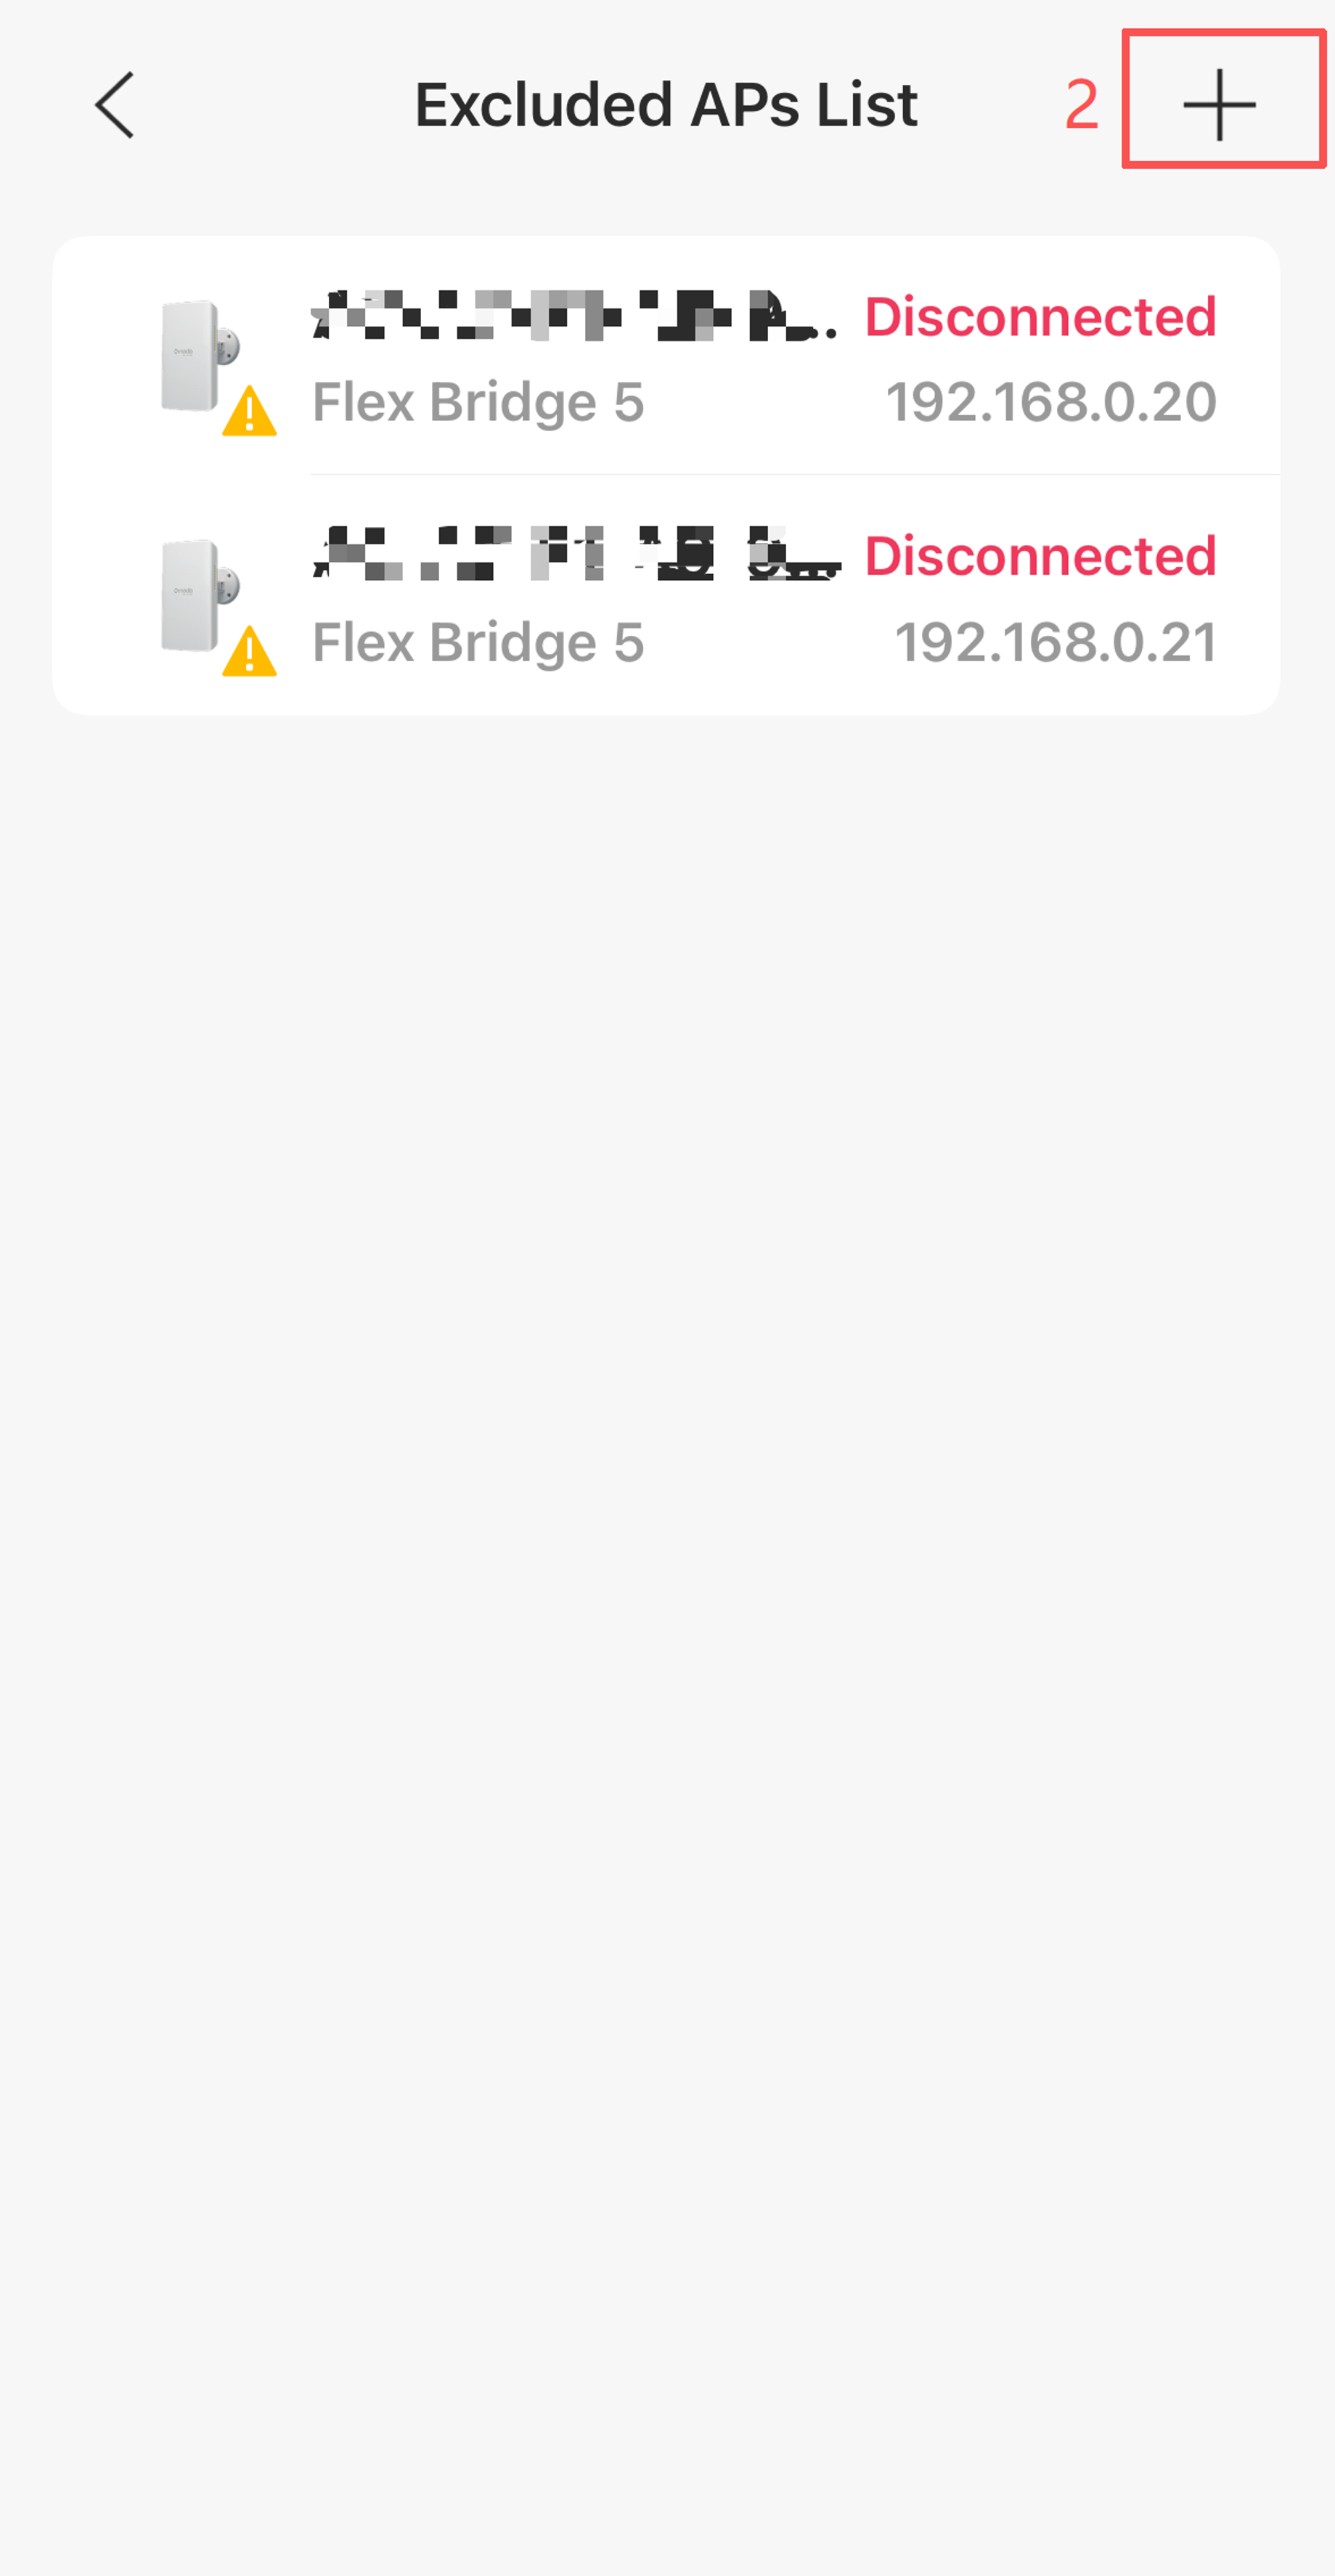
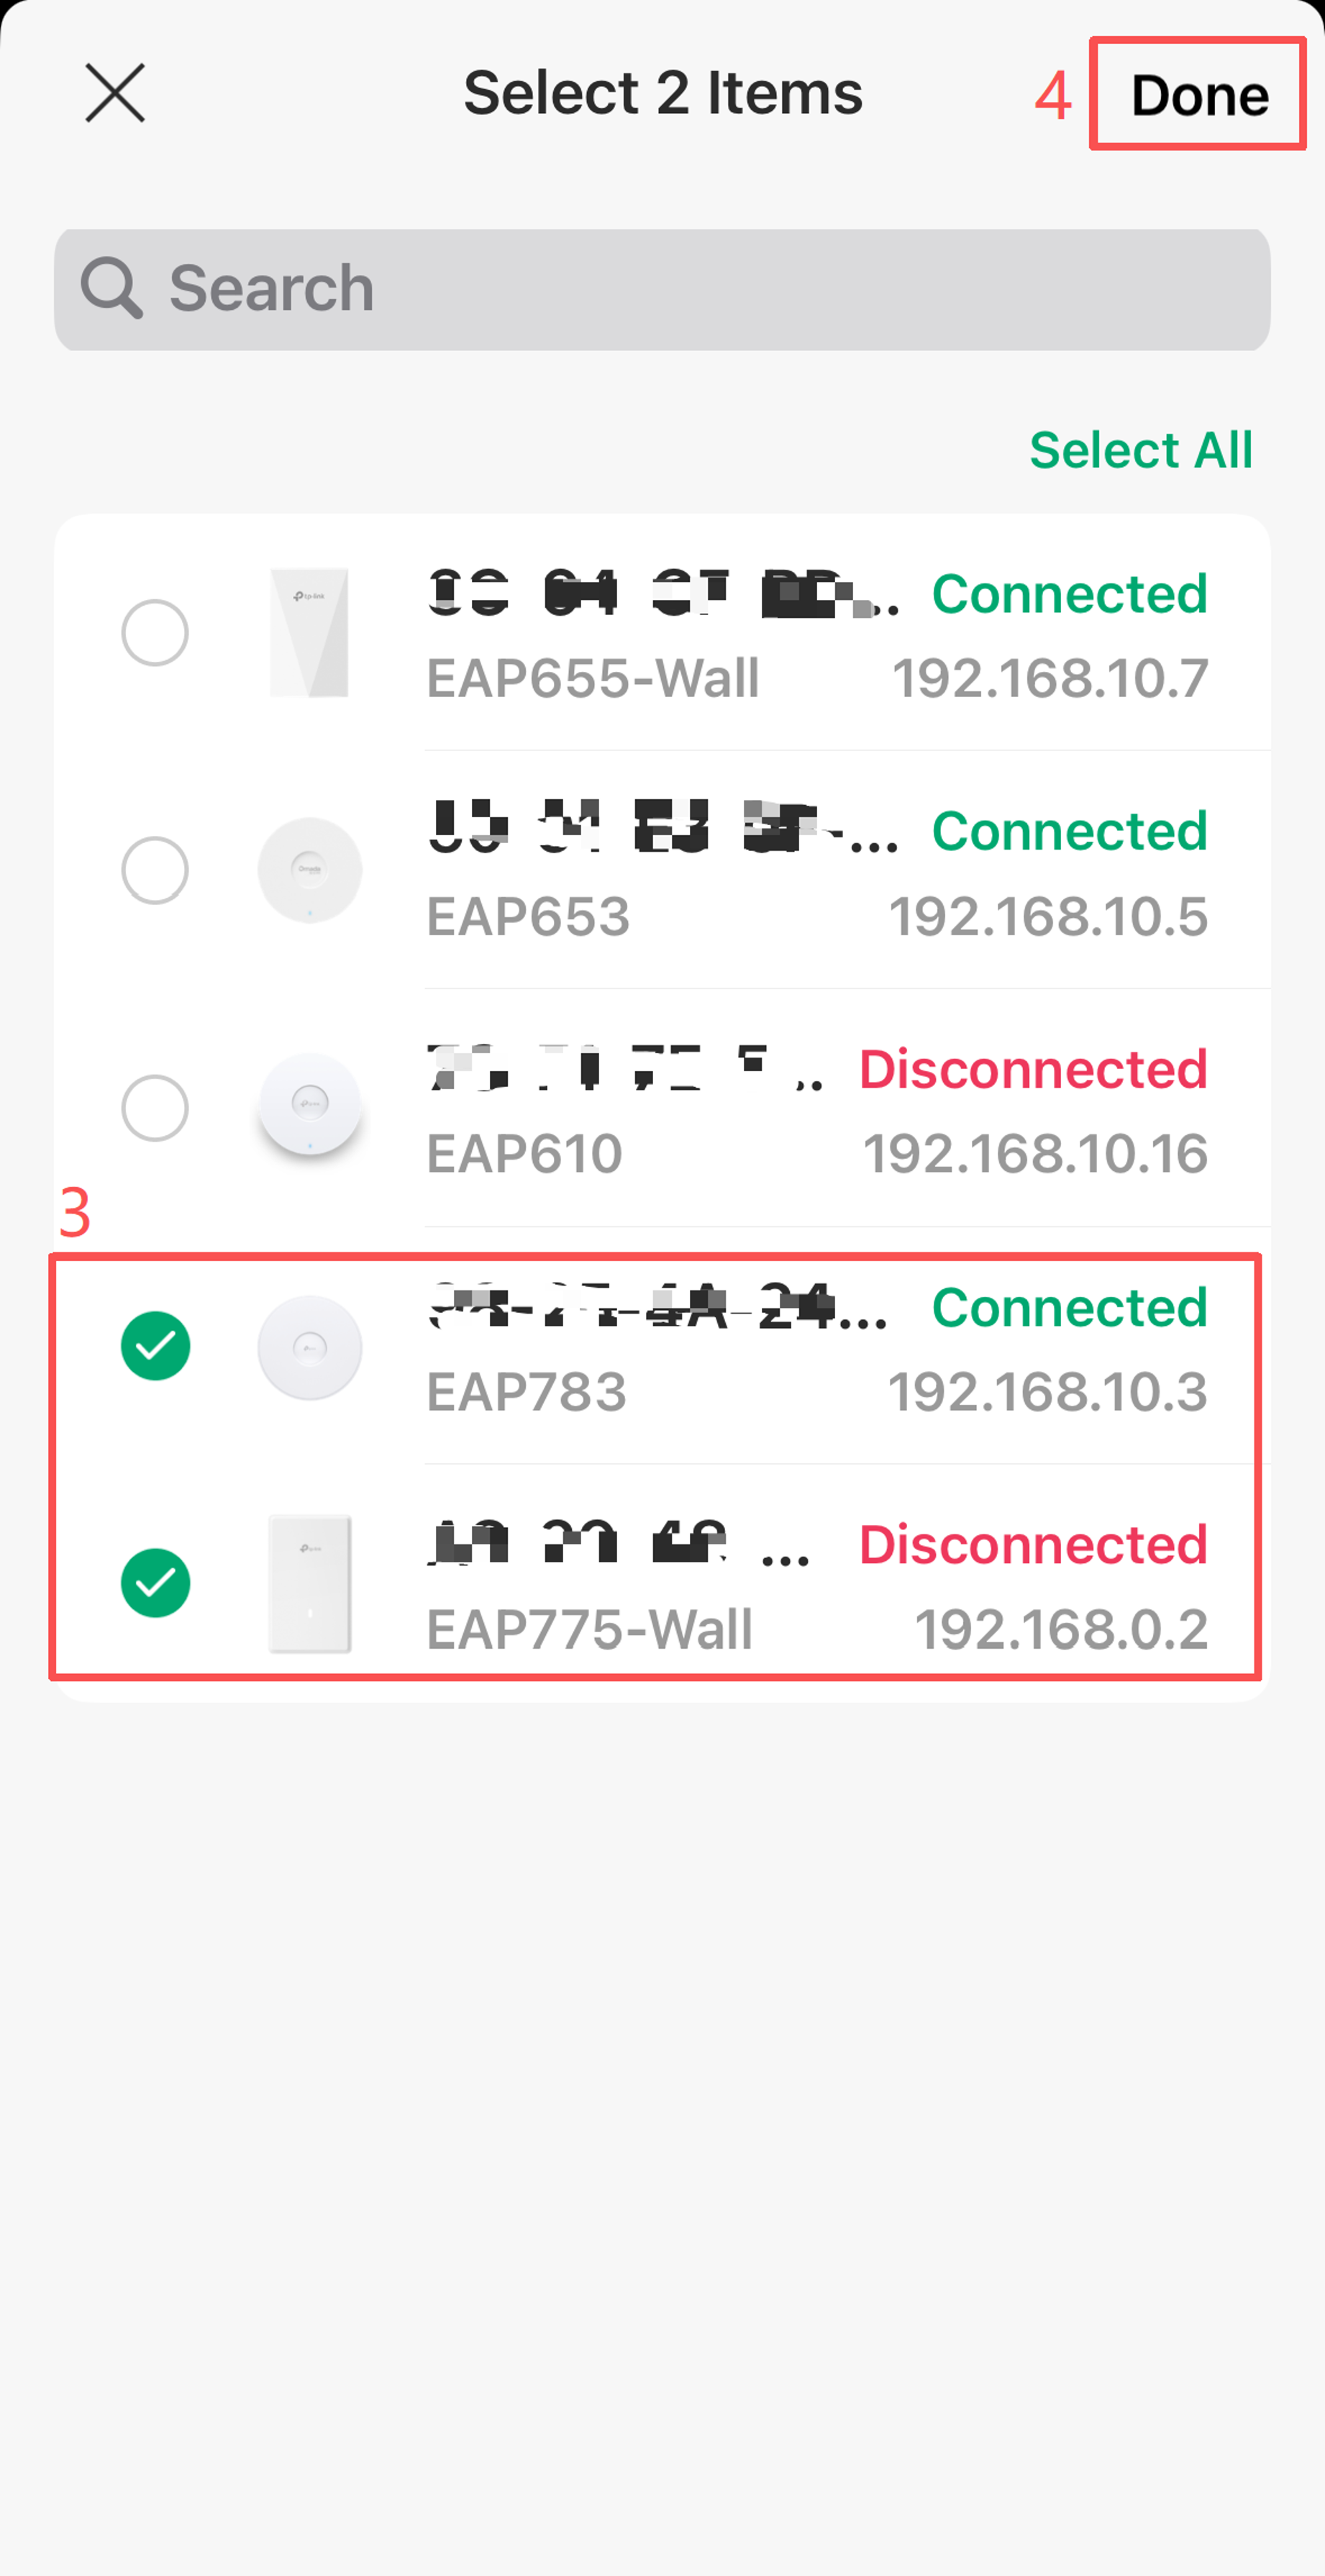
Step 2. You can prevent certain APs from participating in wireless optimization in Advanced Settings>Excluded APs List. These settings apply to both Manual and Adaptive WLAN Optimization.
Note: The APs (Bridge Aps) in the MESH network cannot perform wireless optimization and will be automatically displayed in the Excluded APs List.
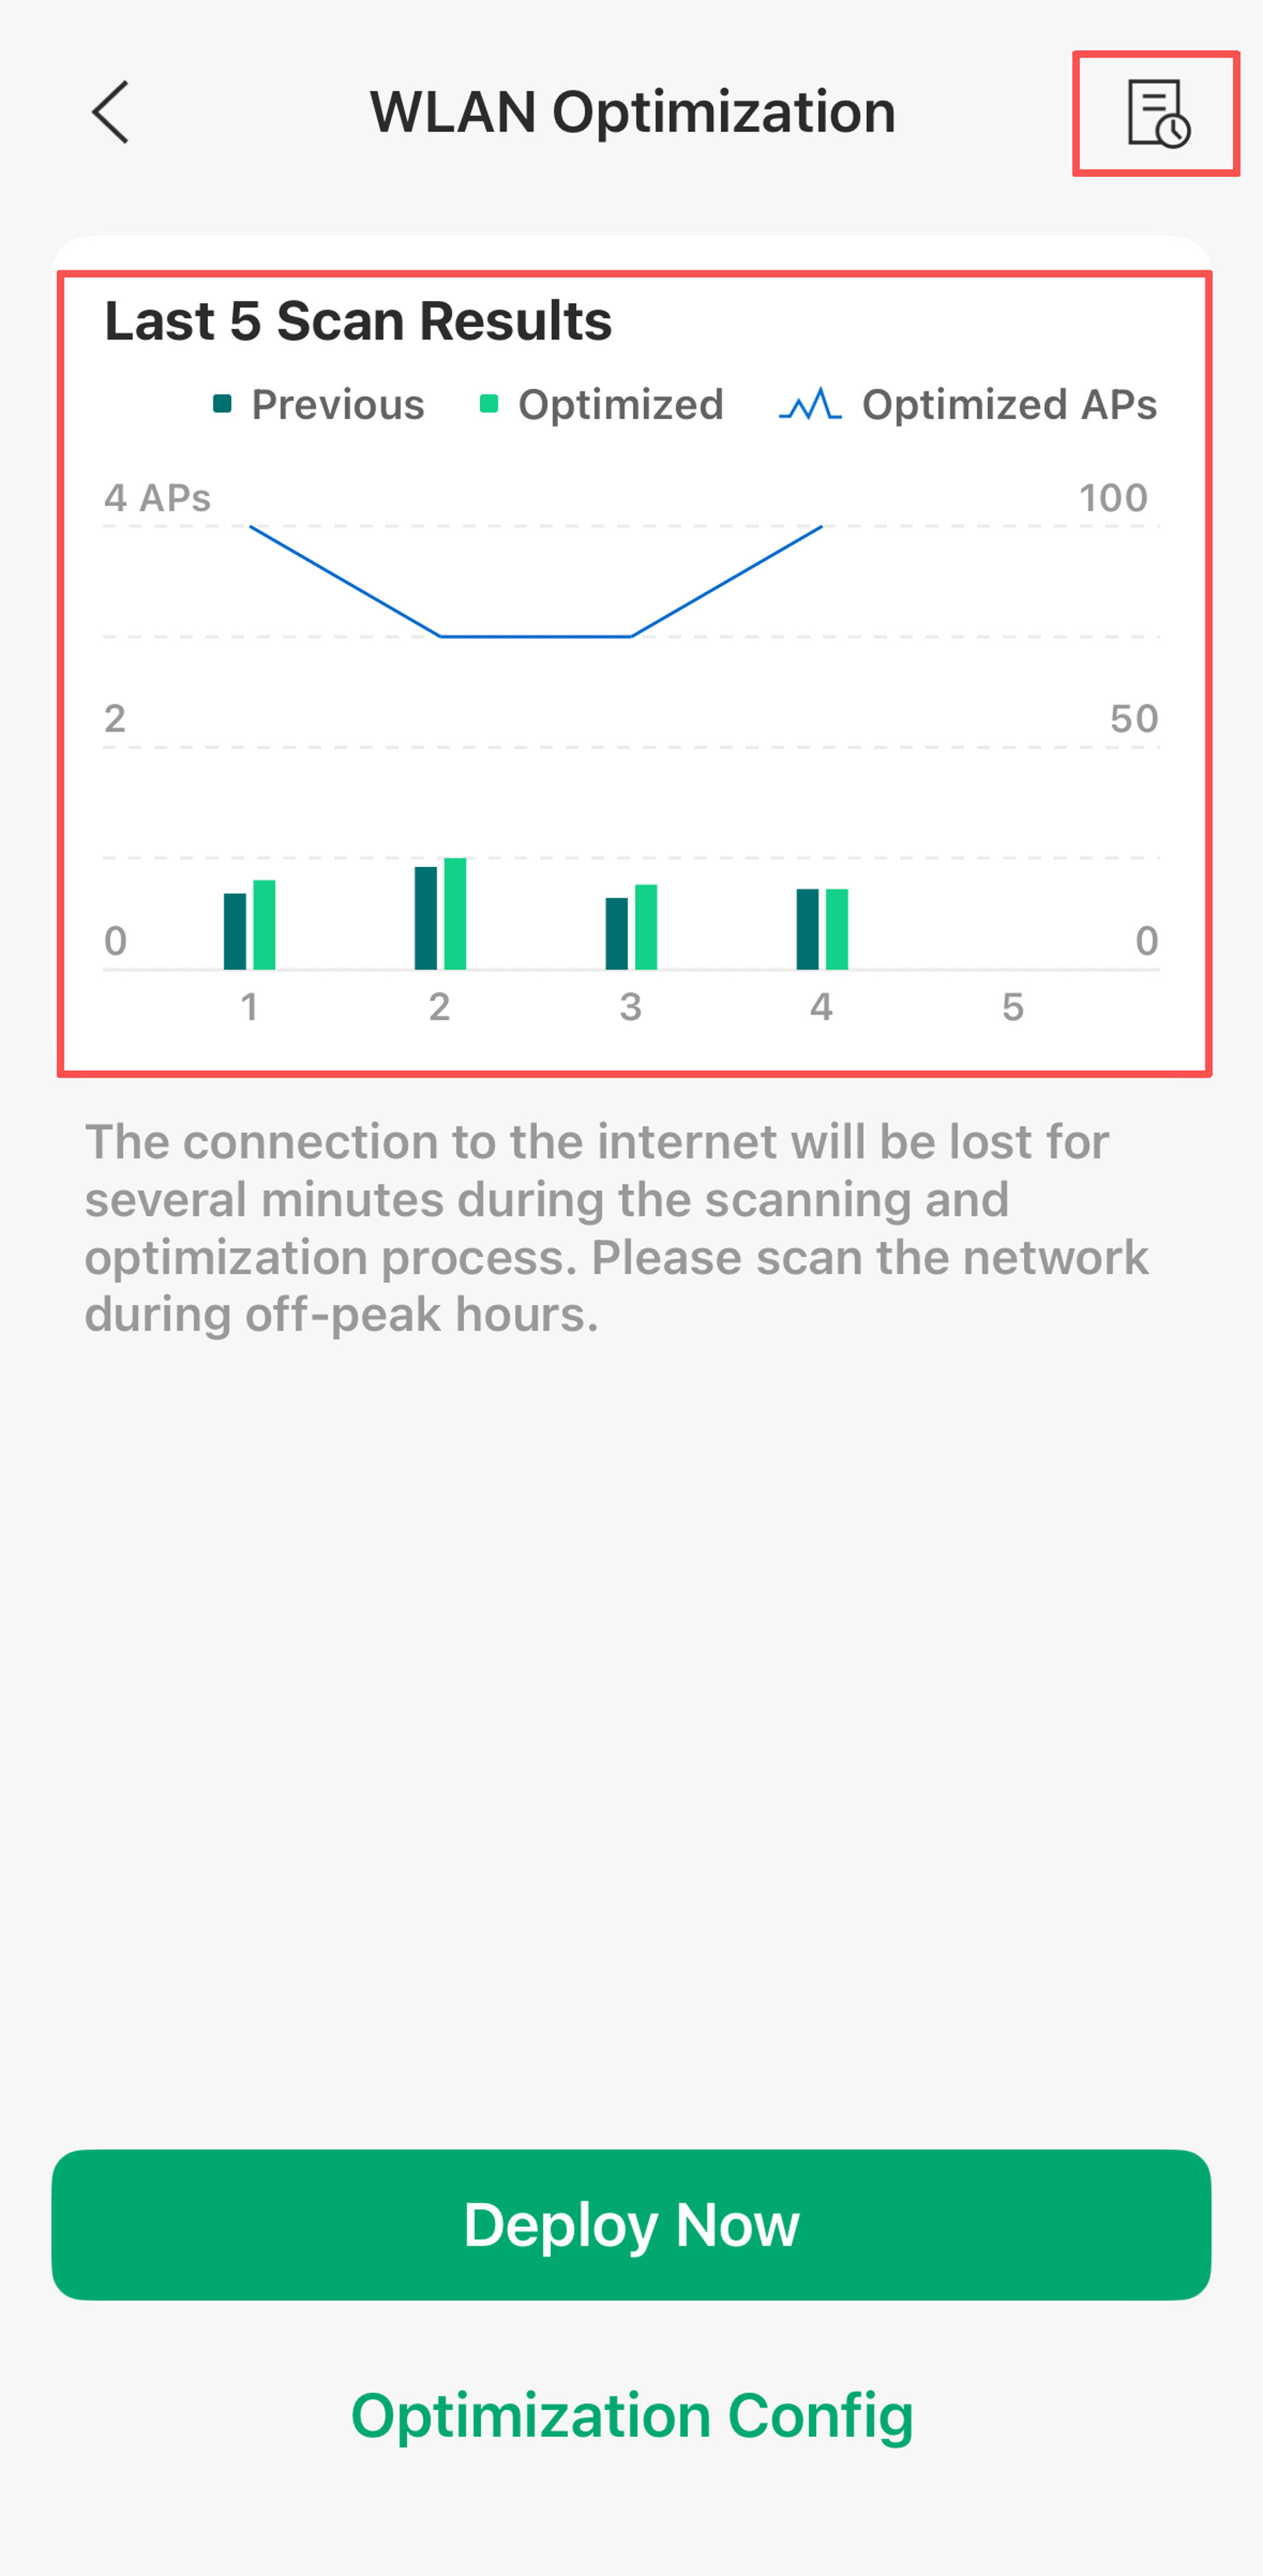
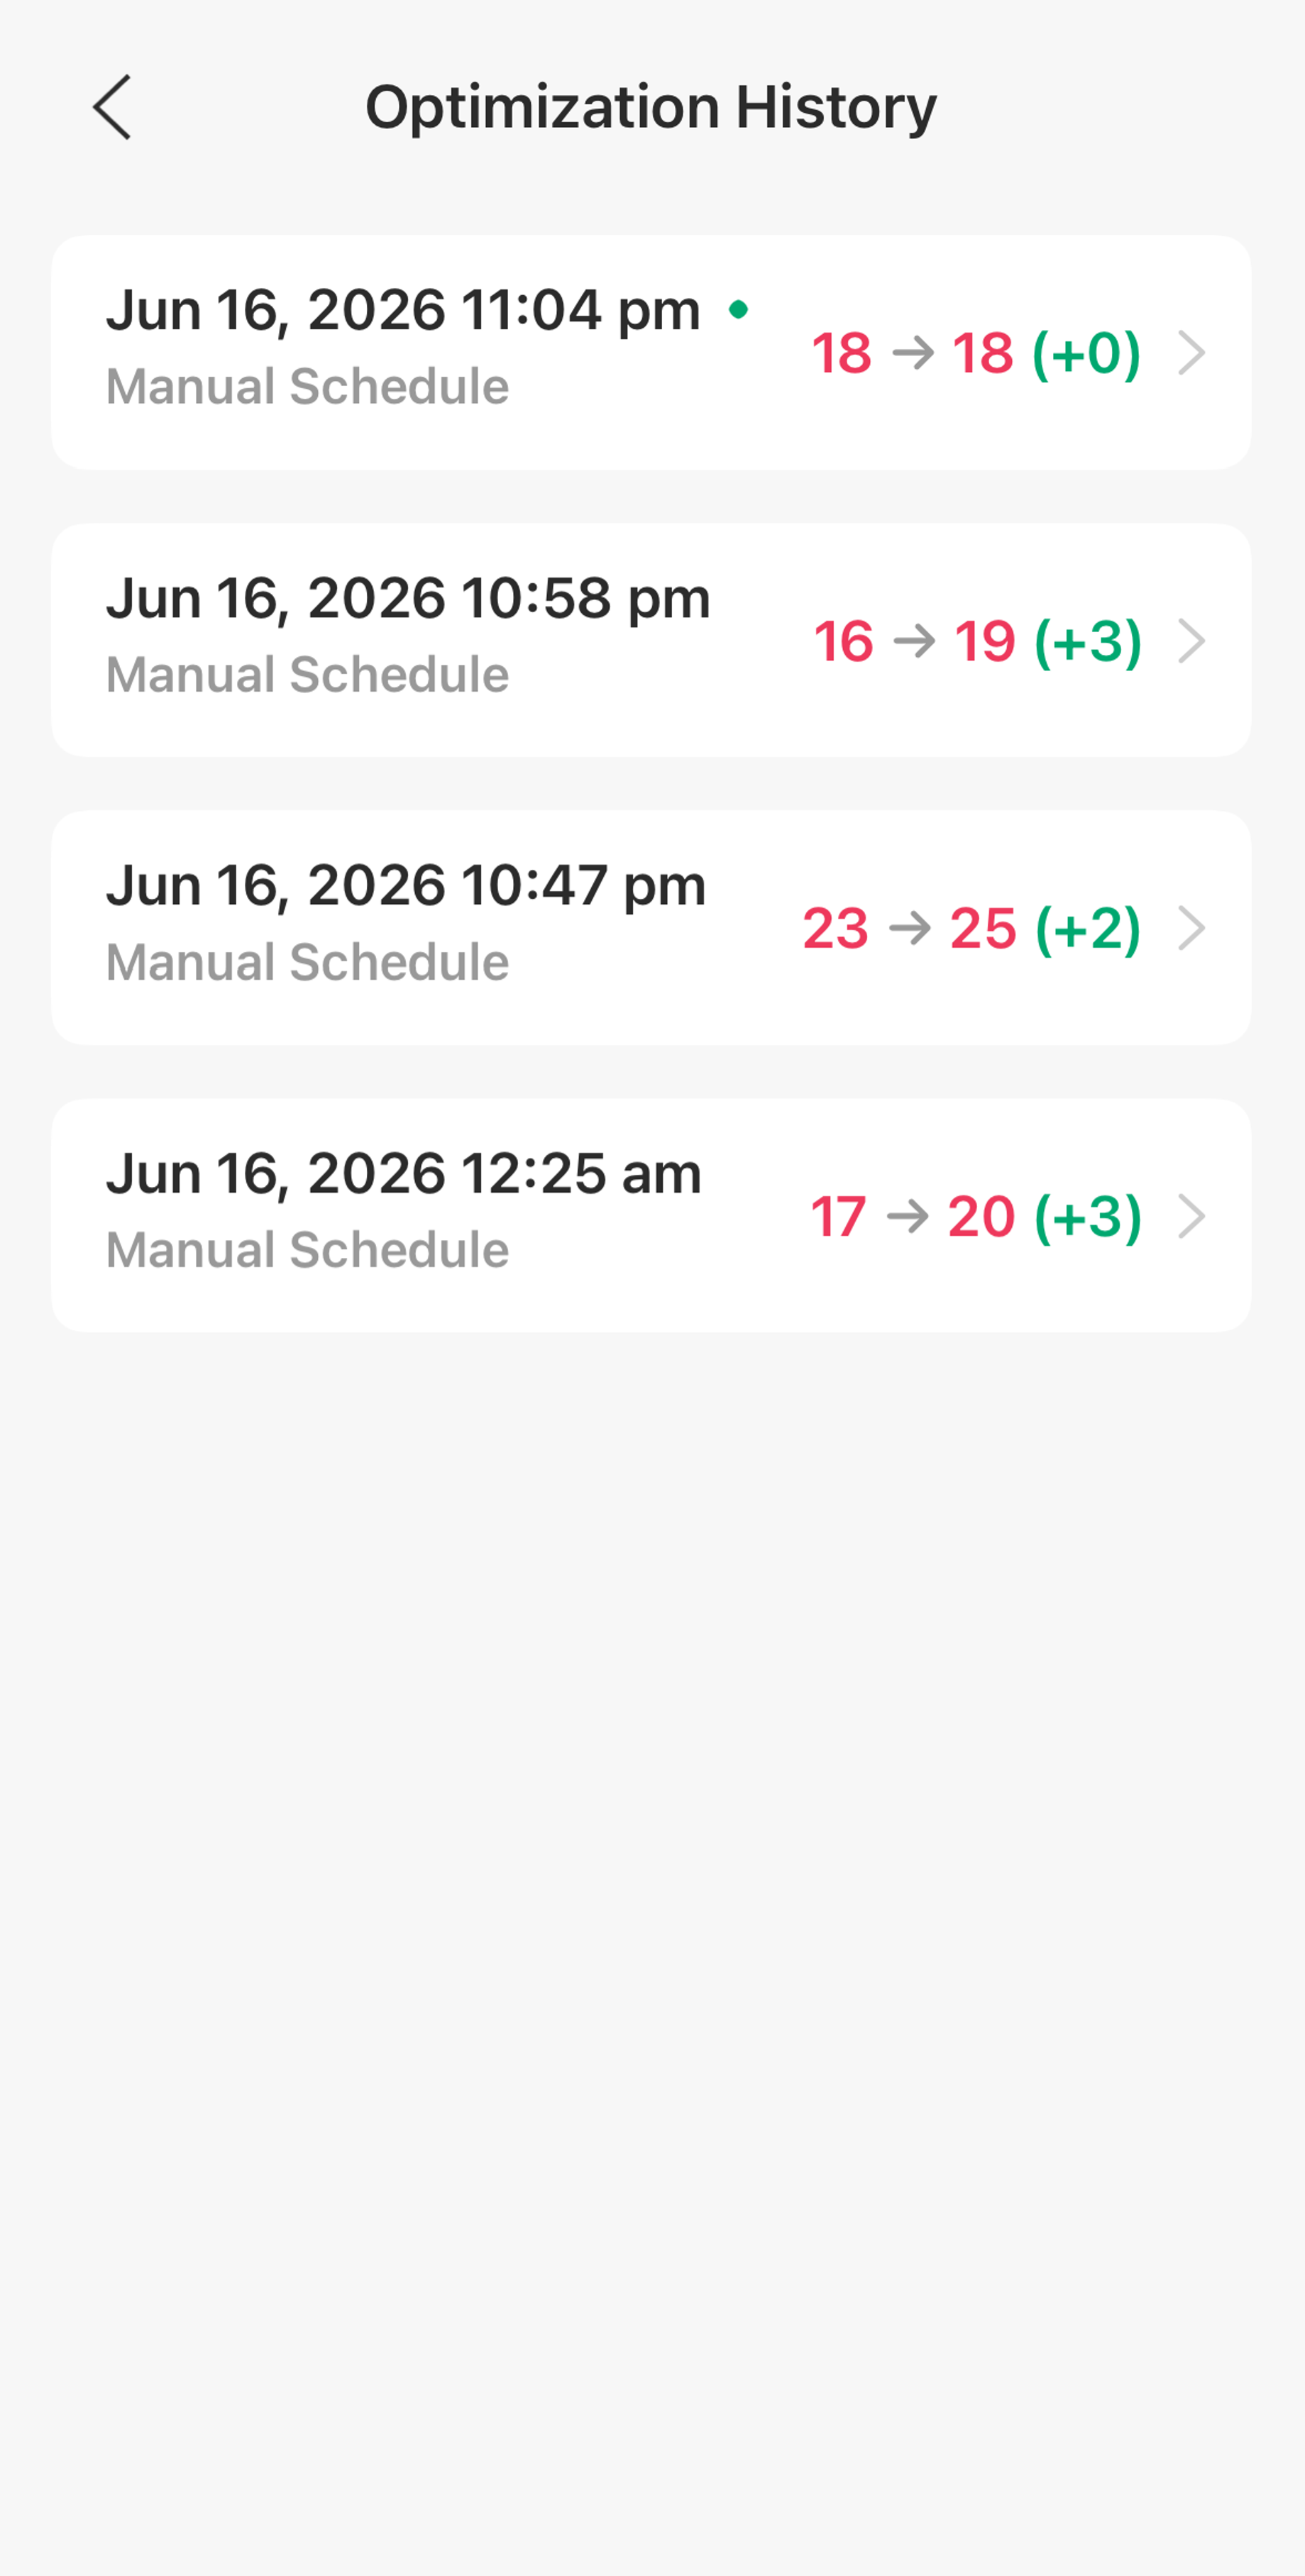
Step 3. In the WLAN Optimization page, you can see the last 5 scan results. Click the icon in the upper-right corner, you can see all optimization history records here.
When the device detects strong interference or Radar waves and triggers automatic optimization, as well as when you perform manual optimization, all of these actions are recorded and displayed in the charts.
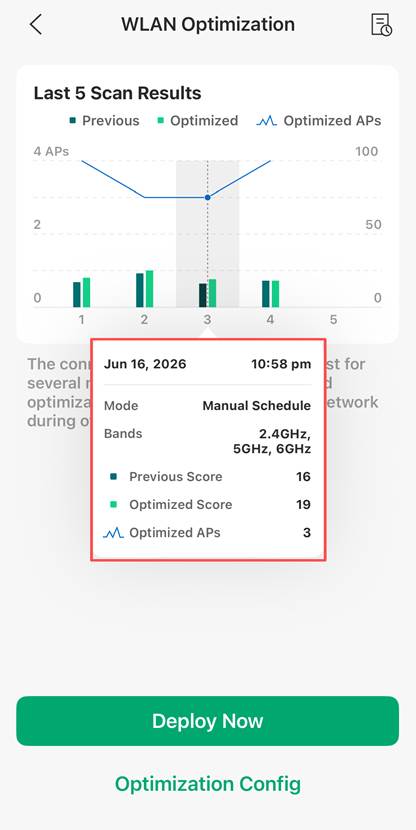
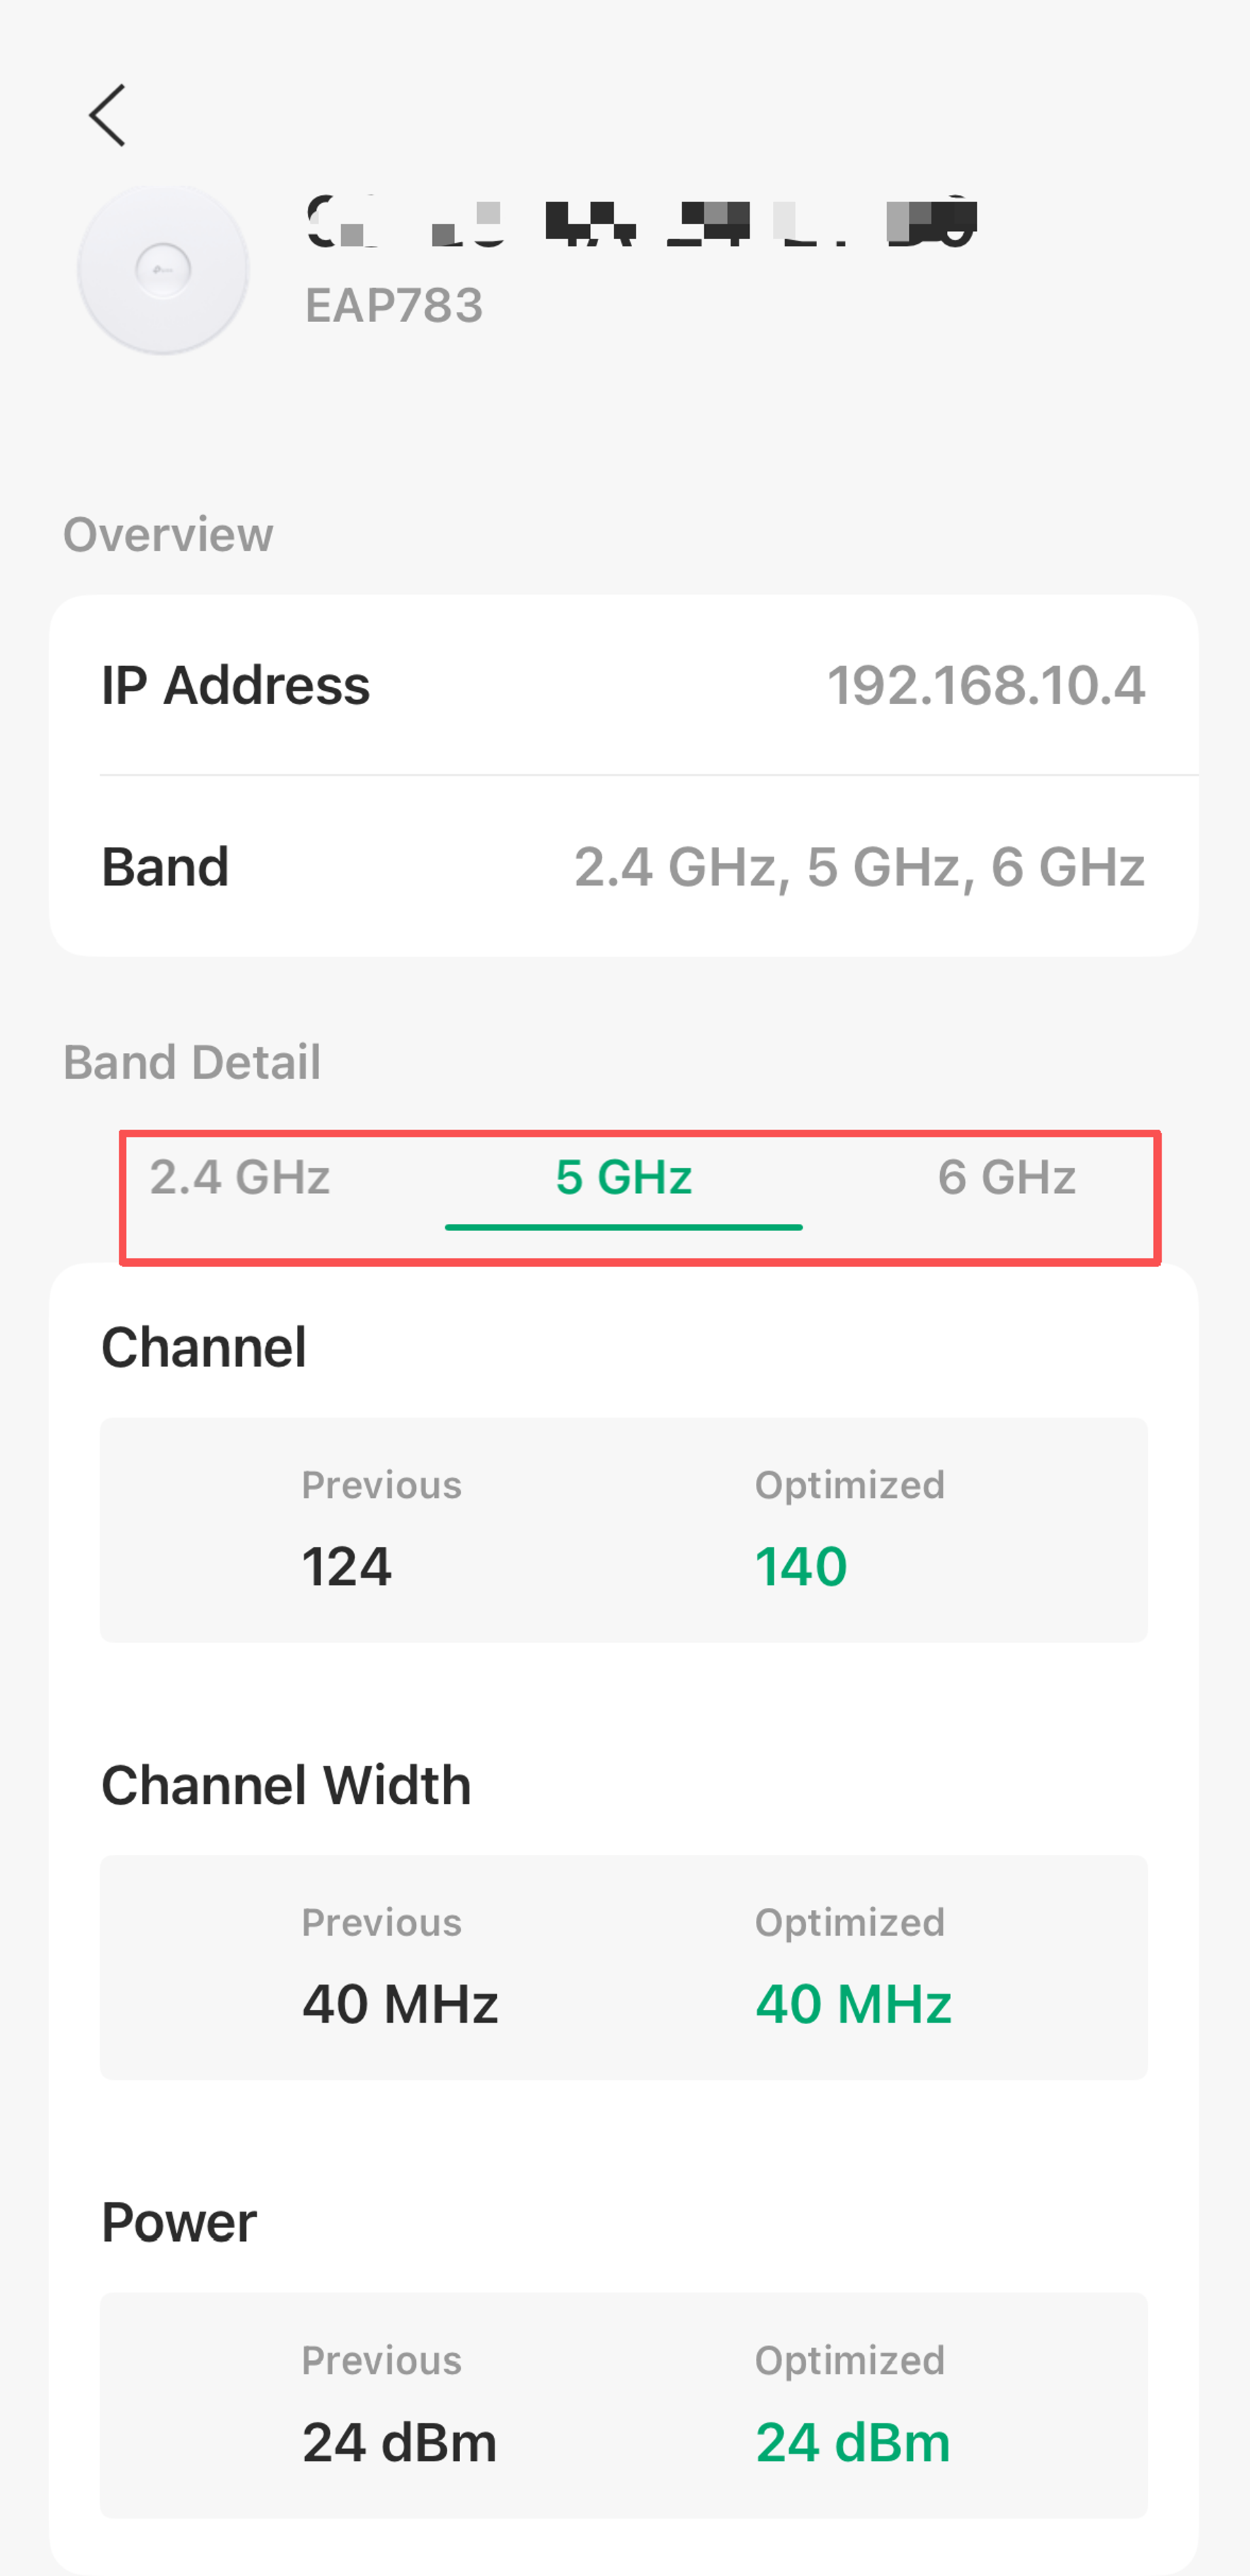
Long-pressing brings up a bubble popup. You can view more details in the bubble popup.
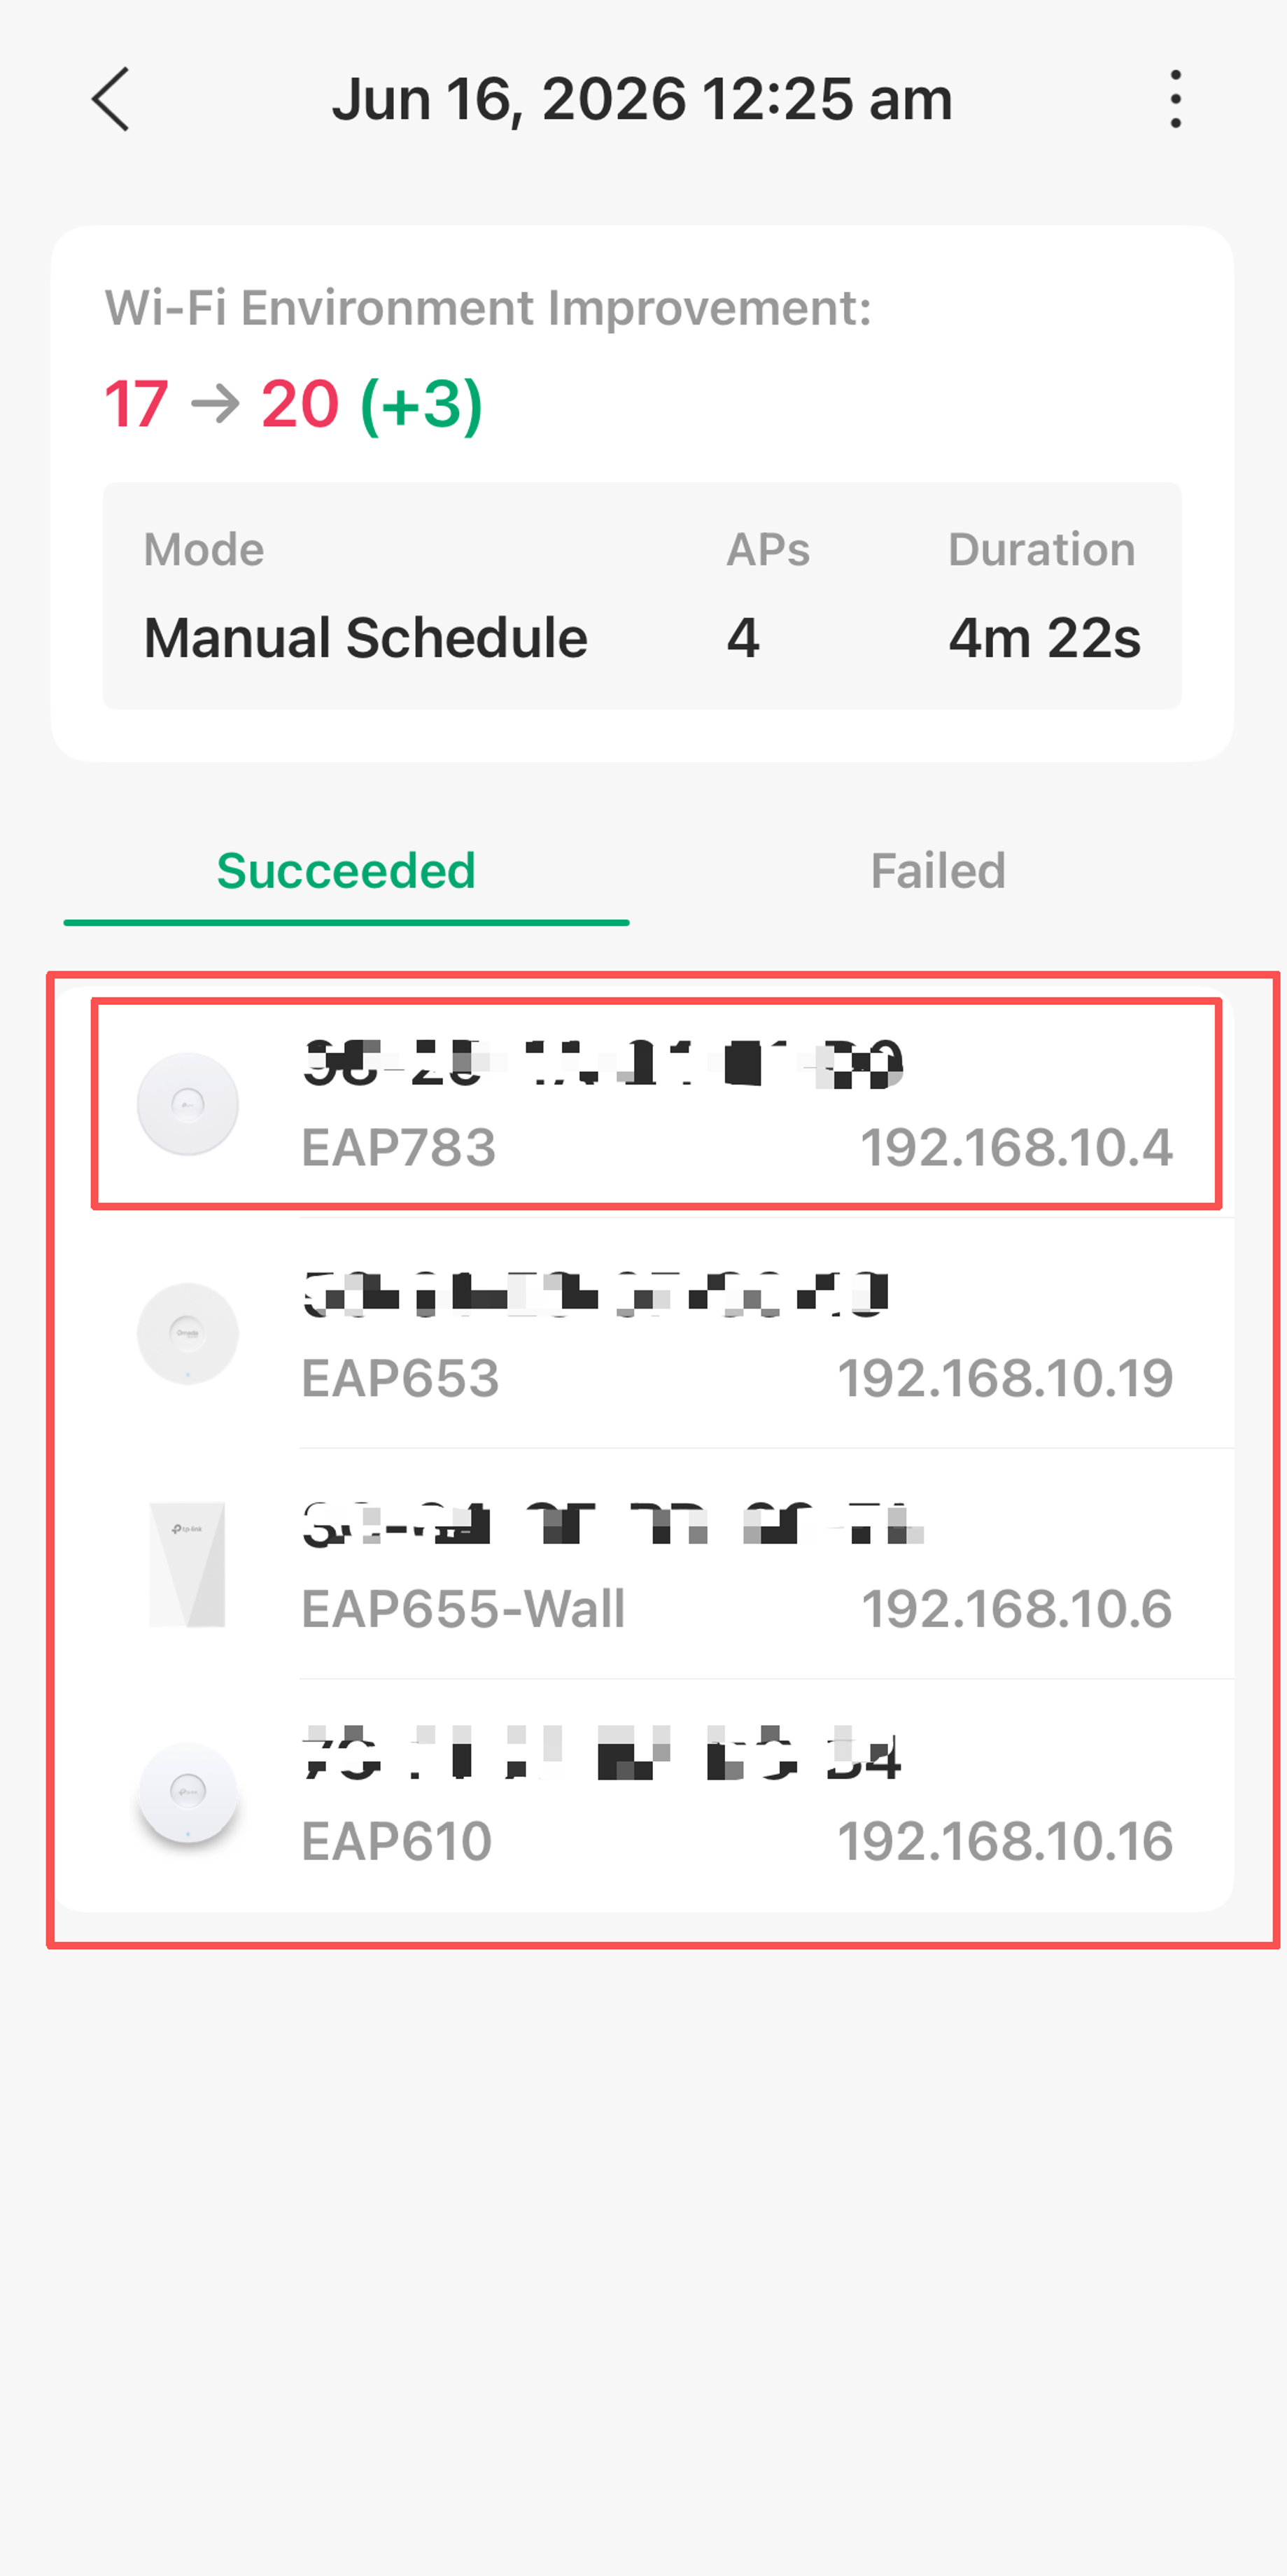
Click the Detail button on the right, then select the special EAP device you want to check, you'll see what operations are taken to make your network work better.
Network Monitoring
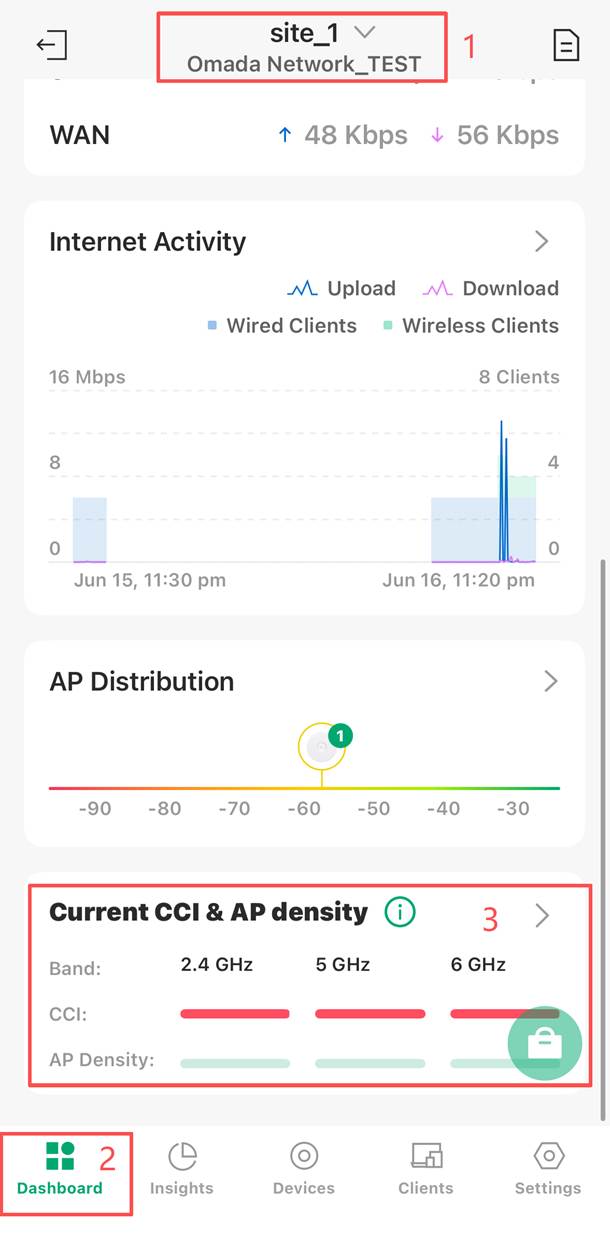
The statistical data on wireless optimization can be viewed on the Dashboard>Current CCI & AP density page.
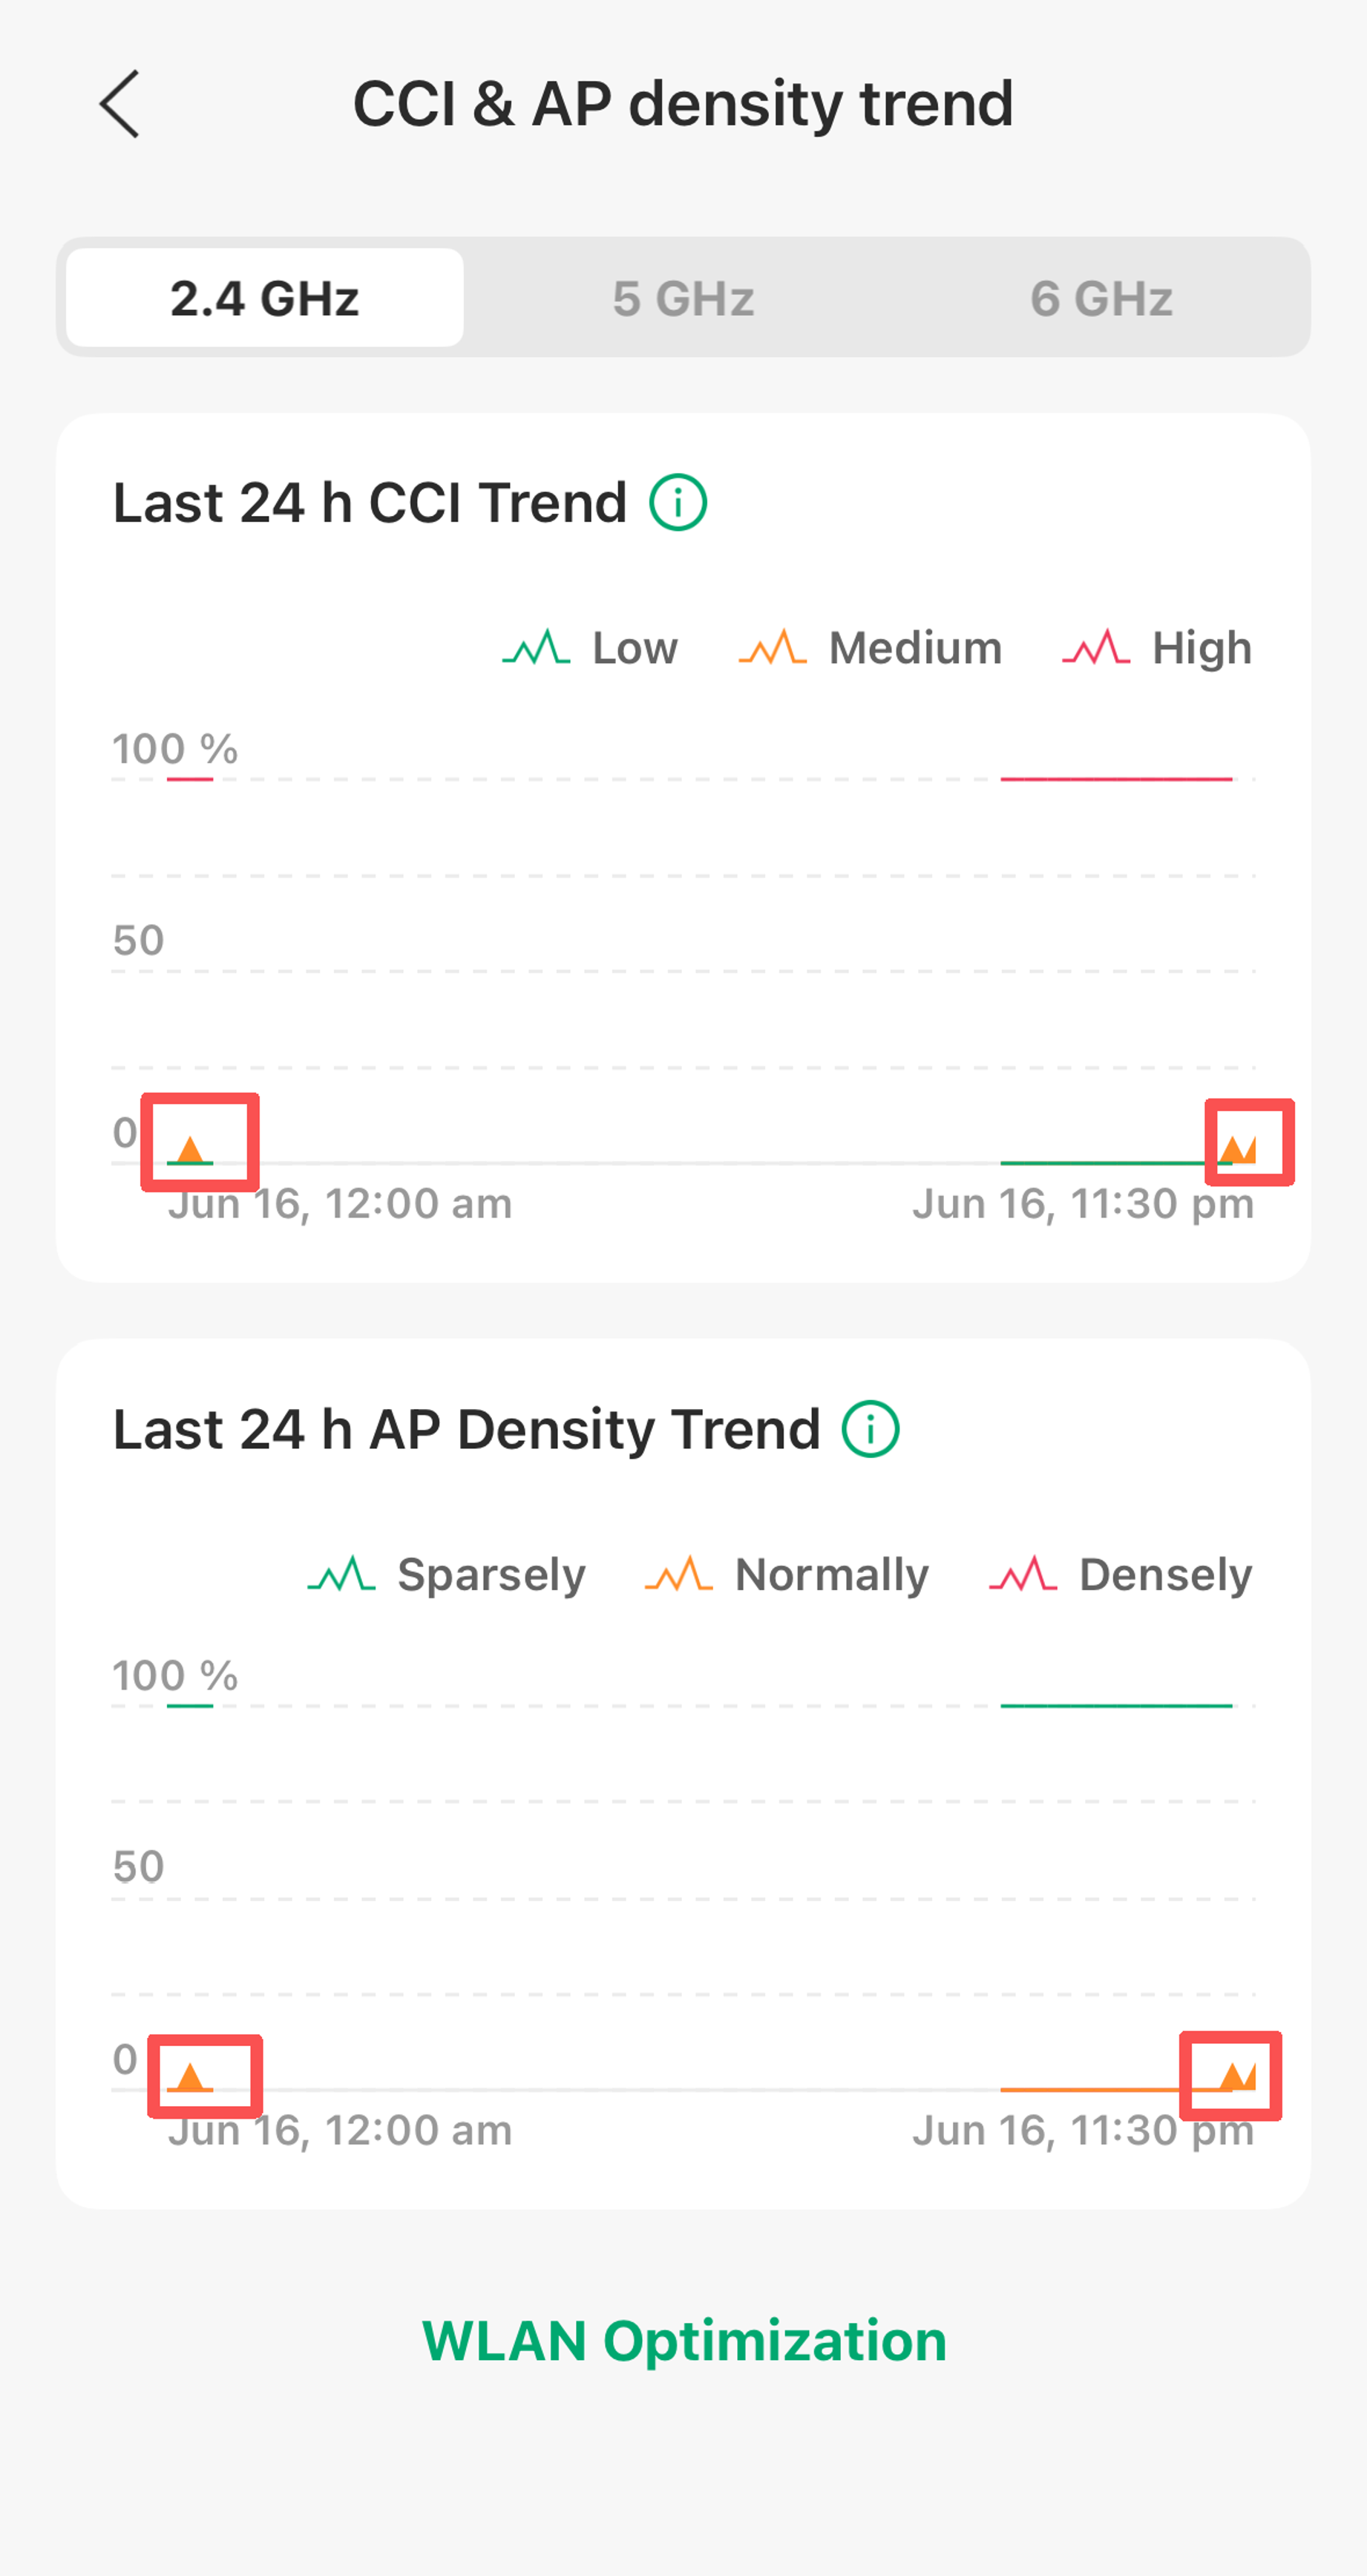
Long-pressing brings up a bubble popup. The triangles in the chart indicate when WLAN optimizations were performed.
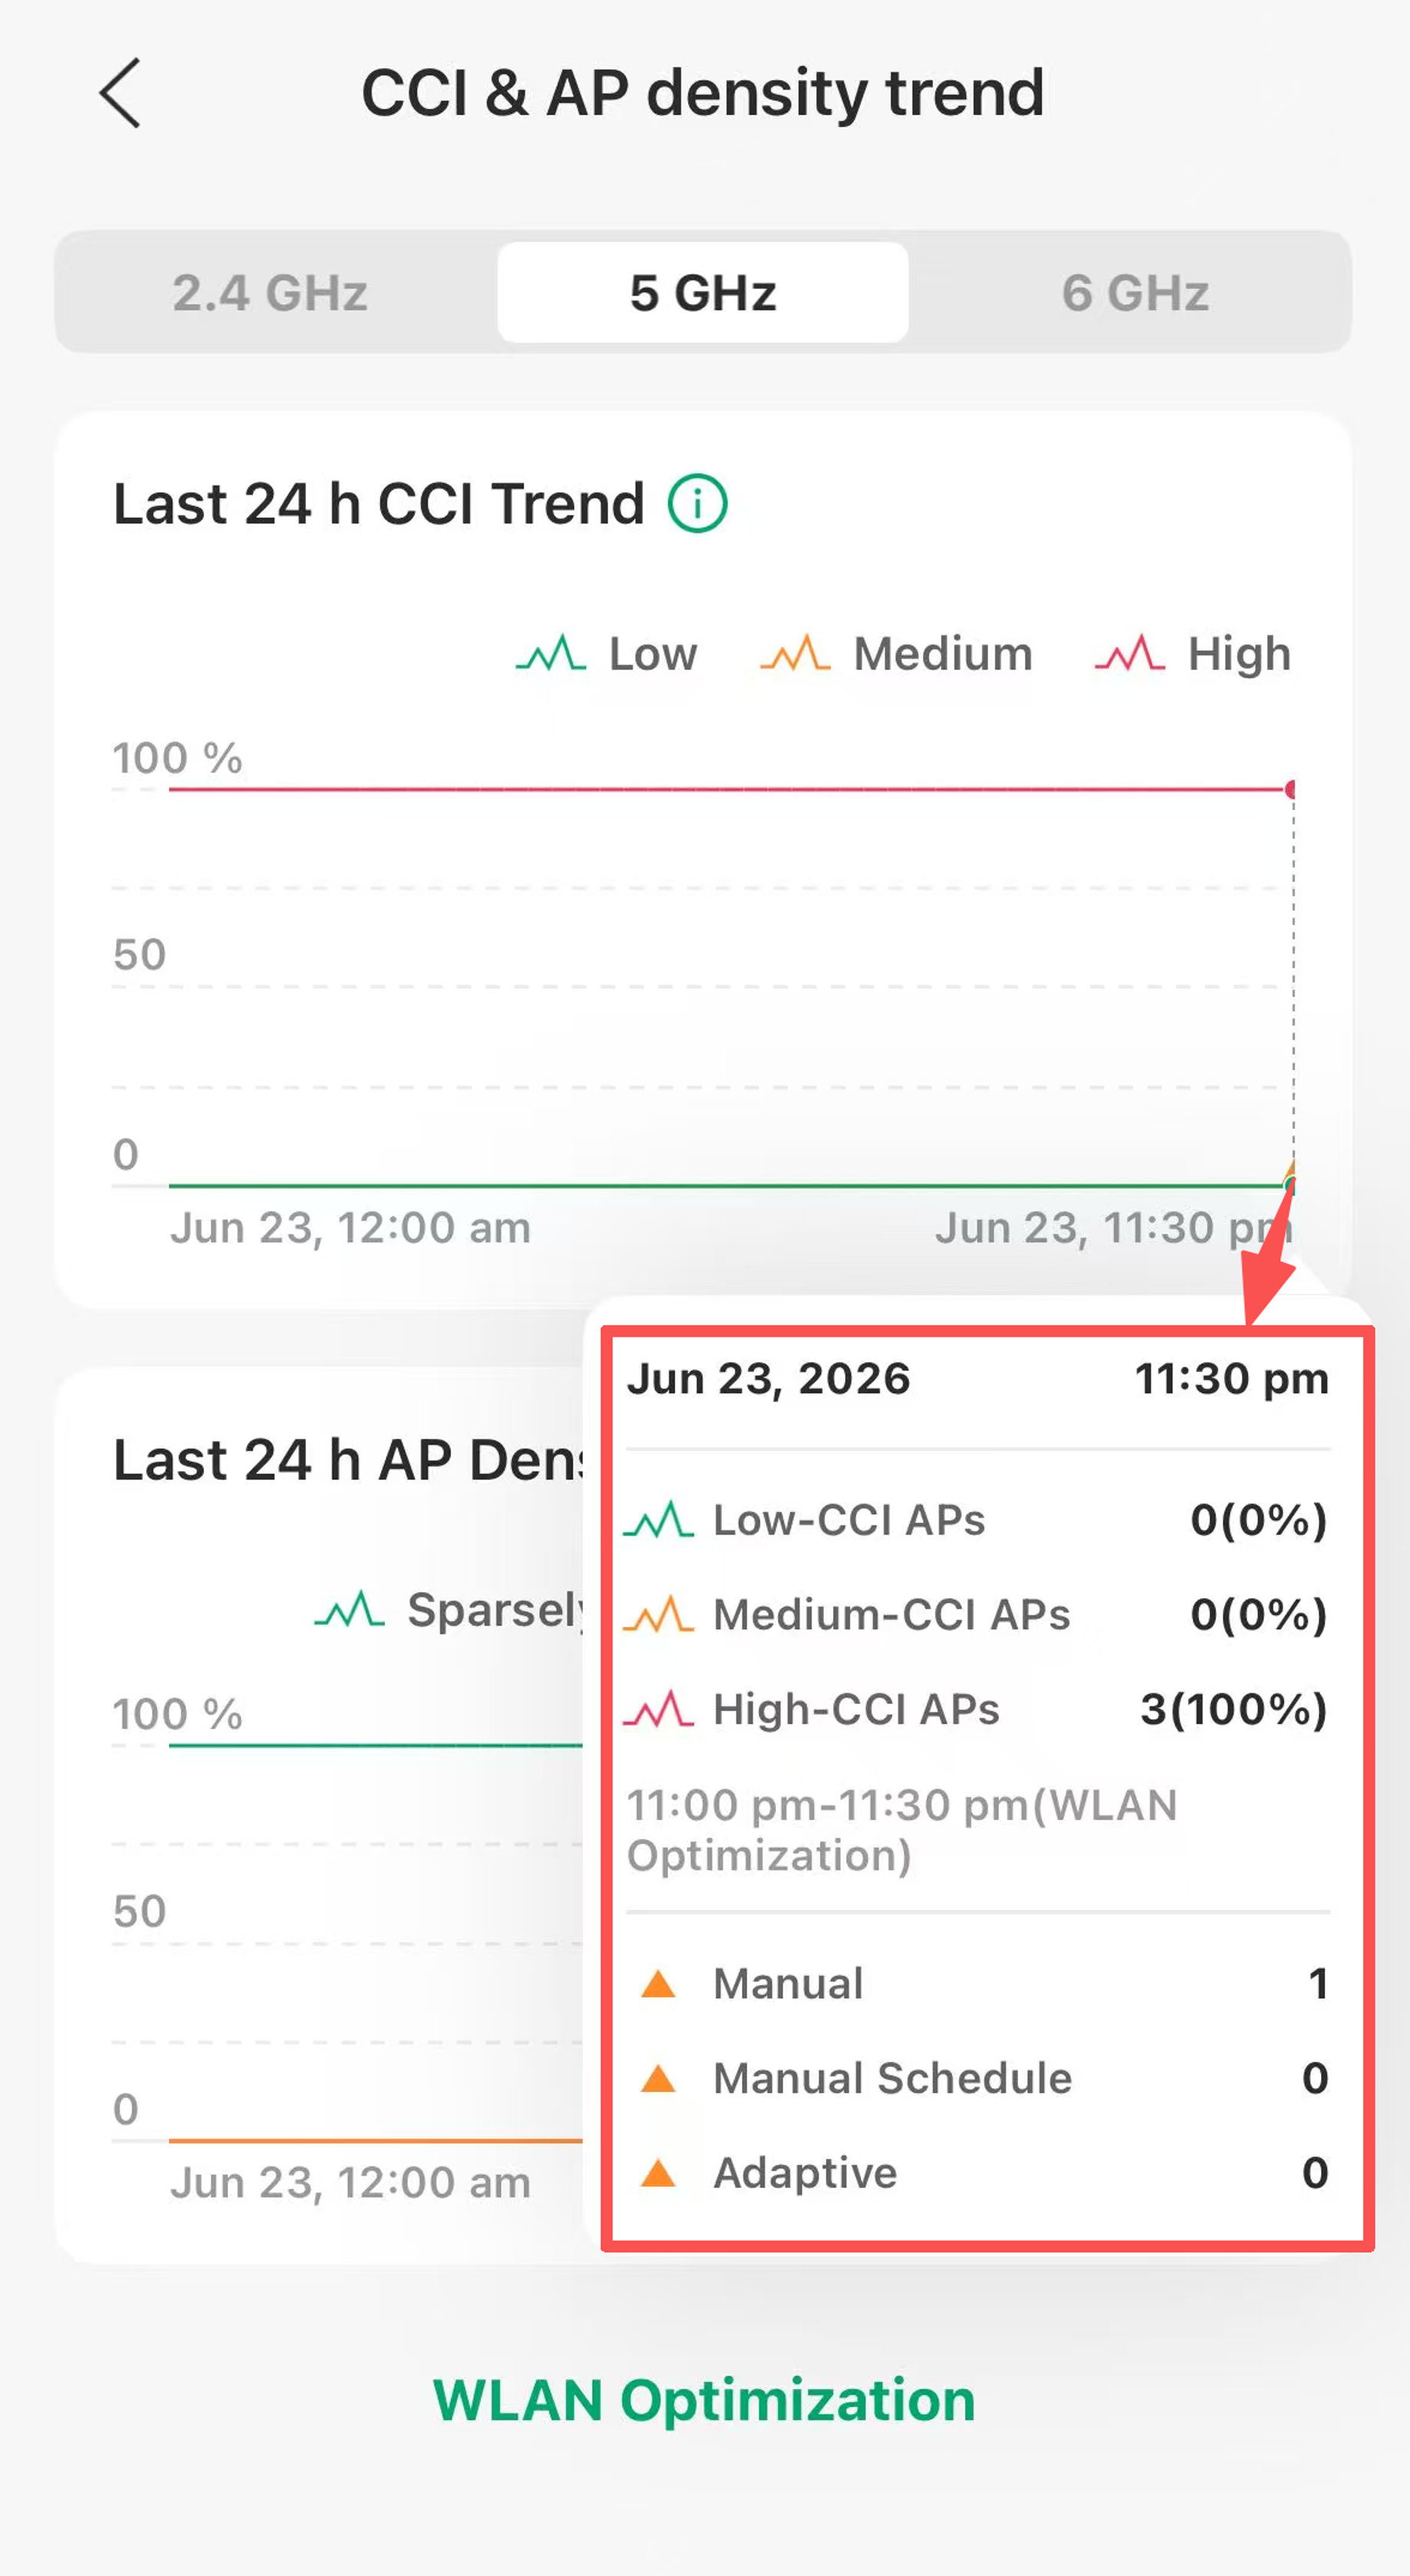
- Co-channel interference (CCI) indicates the degree of interference experienced by APs on the same channel.
- CCI ≥ 70: Strong interference.
- 40 ≤ CCI < 70: Moderate interference.
- CCI < 40: Weak interference.
The line chart shows the trend of APs’ CCI with different levels of interference, with data recorded every 30 minutes. You can switch to 2.4G/5G/6G band.
- AP density is represented by the number of neighboring APs that a single AP can scan, reflecting the deployment status of APs.
- Neighboring APs ≥ 10: Dense deployment
- 5 ≤ Neighboring APs < 10: Normal deployment
- Neighboring APs < 5: Sparse deployment
Verification
Once you complete the configuration of RRM, an optimization will be executed immediately. Waiting for the optimization done, check the Optimization History and you will find a new record, then you have successfully configured RRM.
Conclusion
Configuring Manual/Adaptive WLAN Optimization, it will optimize your WLAN performance based on interference detection.
To learn more about each function and configuration, please visit Support Home to download or check the manual for your product.
Q1: How to choose between two optimization modes?
A1:
Manual: Suitable for immediate optimization and adjustment after the device has just been deployed or after significant changes in the environment.
Adaptive/RRM: Suitable for daily maintenance, optimized through the "Time Window".
Q2: What’s the Common Scenarios with High CCI and High AP Density?
A2:
High CCI (Co-Channel Interference) and AP Density issues are commonly caused by deployment and environmental factors rather than network faults.
Typical Scenarios:
High AP density without proper planning.
Too many APs deployed in a limited area with high transmit power, overlapping coverage, or poor channel allocation.
Heavy use of band channels.
Limited non-overlapping channels lead to severe co-channel contention in medium- to high-density environments.
High external (extra-network) interference.
Dense neighboring Wi‑Fi networks in offices, apartments, or commercial buildings.
Excessive transmit power.
APs cover areas larger than required, increasing the number of devices competing on the same channel.
Overly wide channel bandwidths.
Using 80 MHz or wider channels reduces the number of available channels and increases interference.
High-capacity environments.
Offices, classrooms, conference rooms, and public venues with many users and APs in close proximity.
