


Contents
Objective
This guide provides instructions for using network tools to diagnose the network status.
Requirements
- Omada Controller v6.0 and above.
Introduction
When managing or troubleshooting a network, built-in network tools are essential for quickly identifying issues like connectivity gaps, latency, or configuration errors. The built-in "Network Tools" in the Omada SDN Controller provides a range of commonly used network diagnostic utilities. This FAQ will guide you through using common network diagnostic tools to assess and resolve problems in your network environment.
Configuration
Network Check
Step 1. Enter Network Check page in Site > Network Tools.
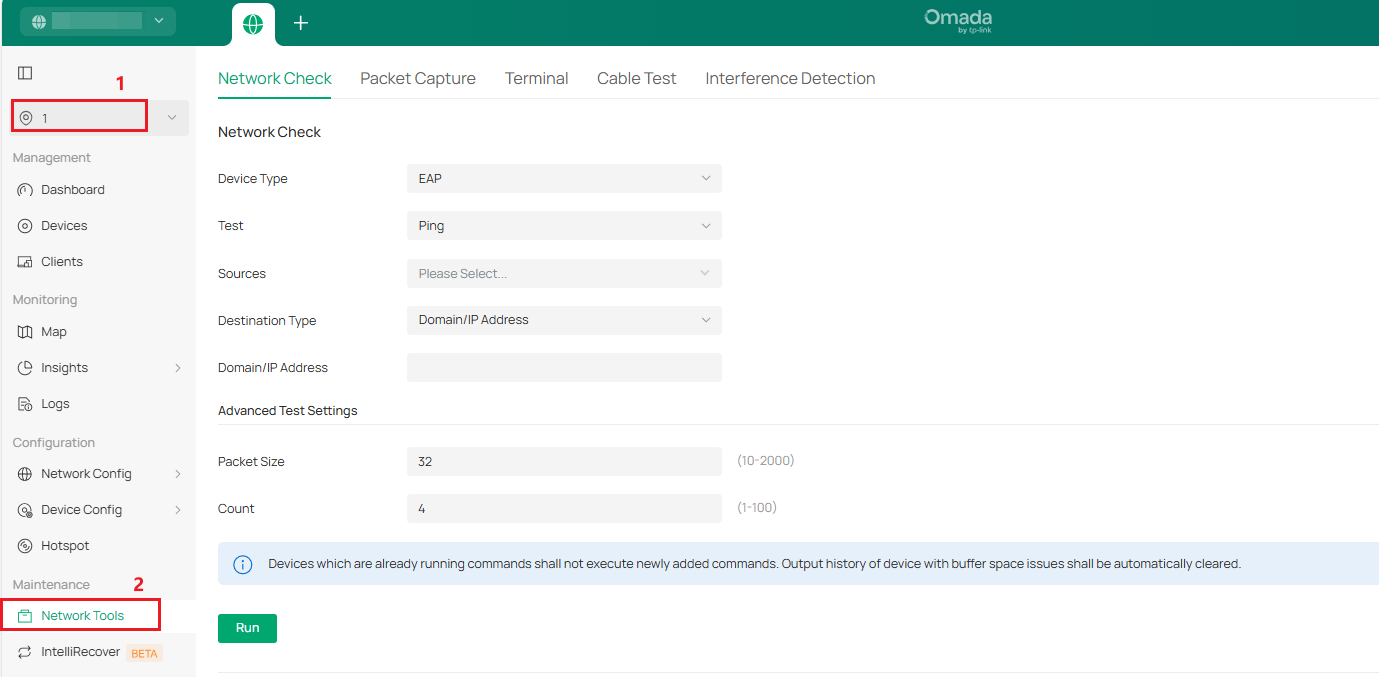
Step 2. Select the device type you want to test.
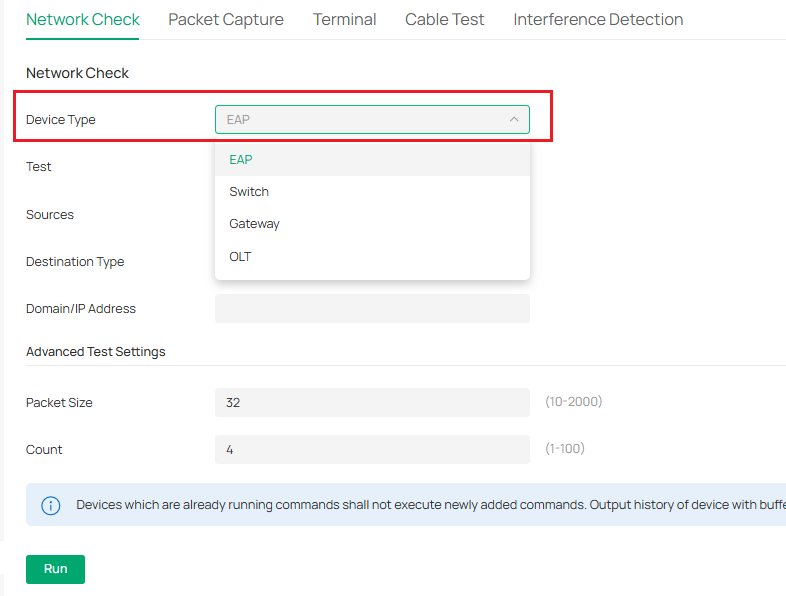
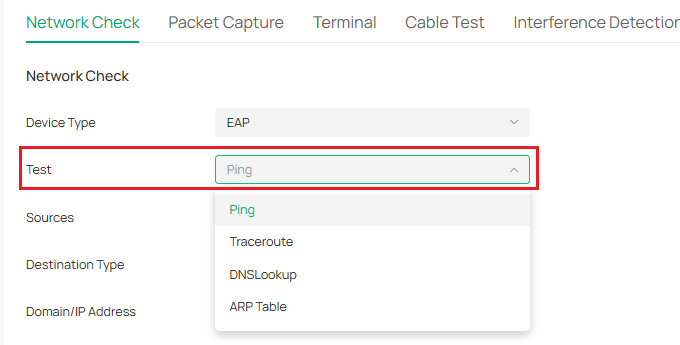
Step 3. Select the testing tool. (There are only Ping and Traceroute when selecting OLT)
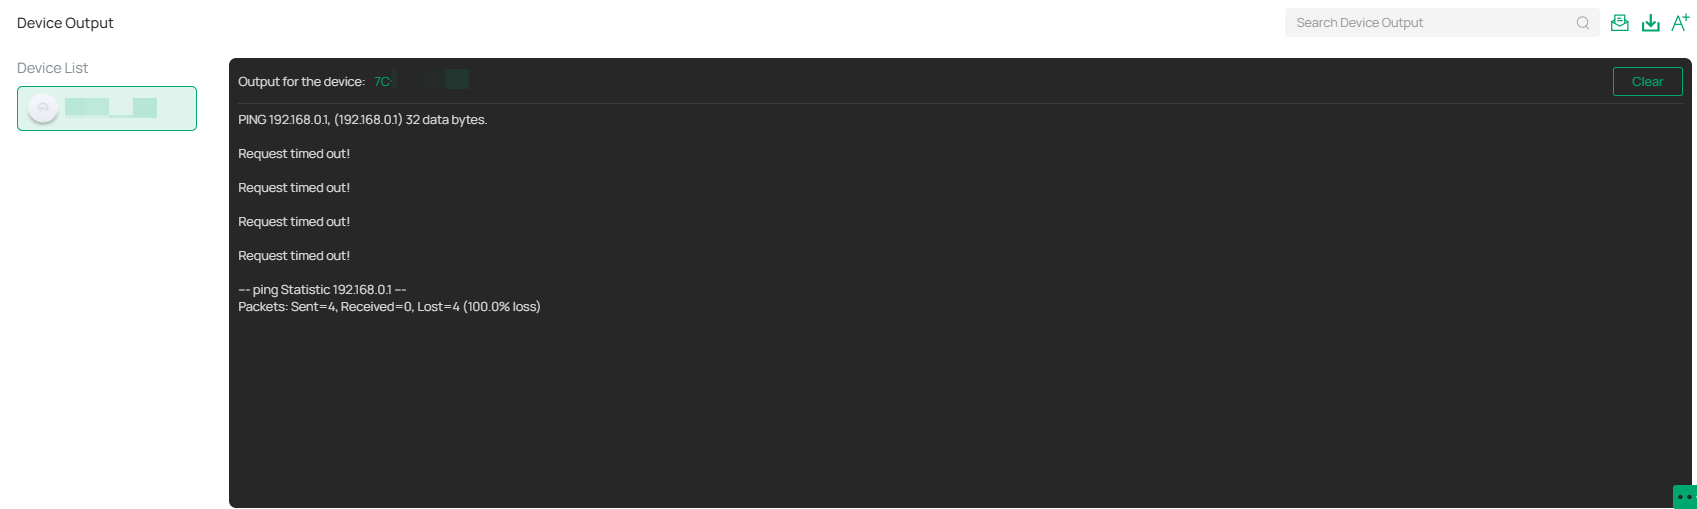
Step 4. If you use the Ping tool, select the source device, and configure the target domain/IP. And if you want to customize the testing, you can configure the size and count of the packet. Then click the Run button.
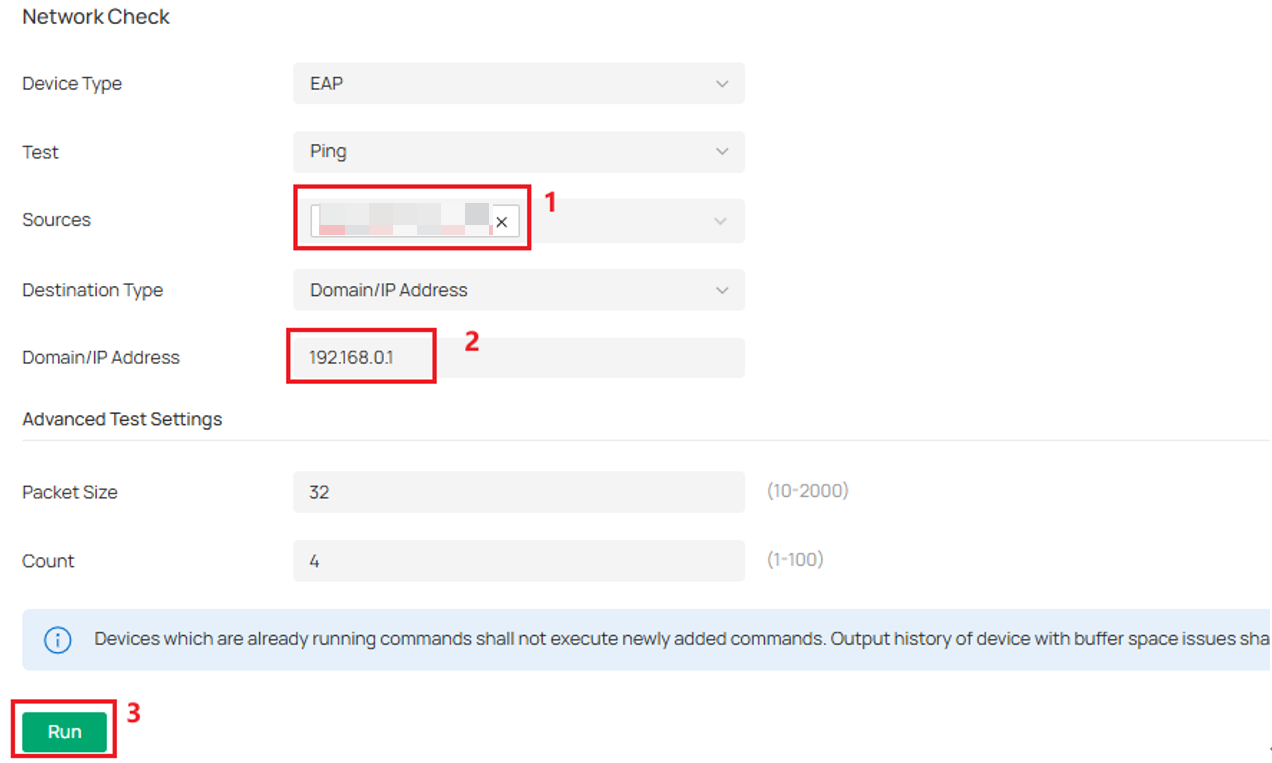
Then you can check the Ping result in the output window.
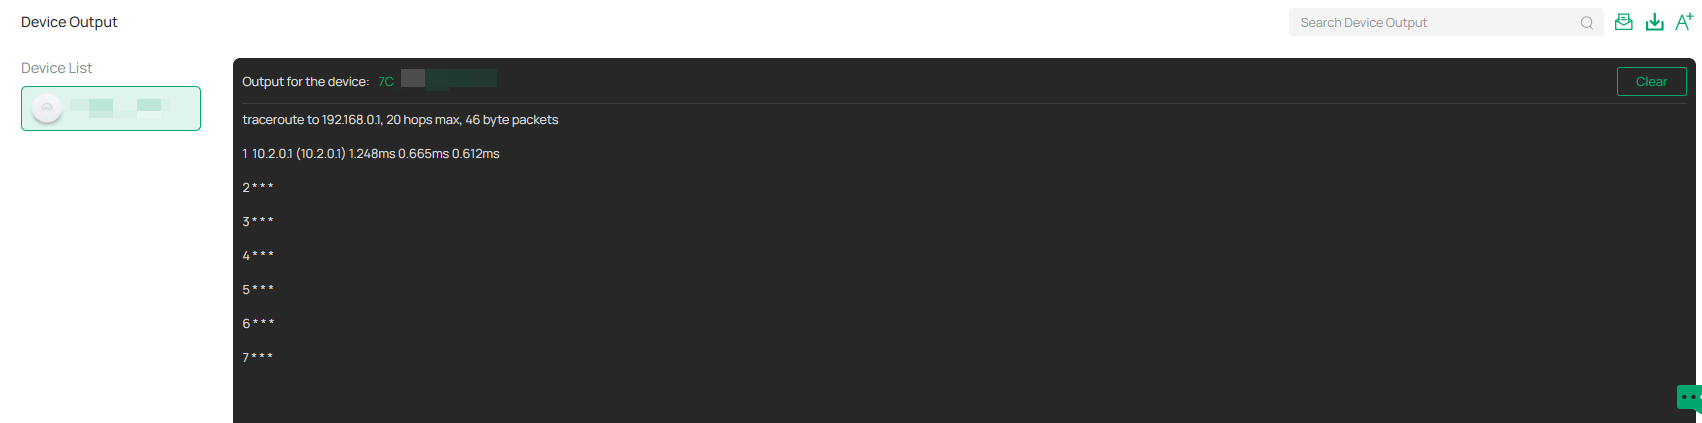
Step 5. If you use the Traceroute tool, select the source device, and configure the target domain/IP. Then click the Run button.
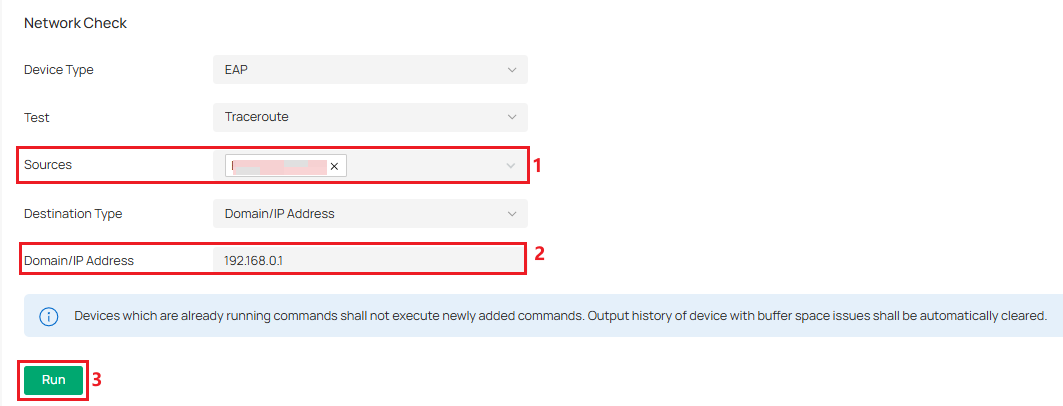
Then you can check the Traceroute result in the terminal.
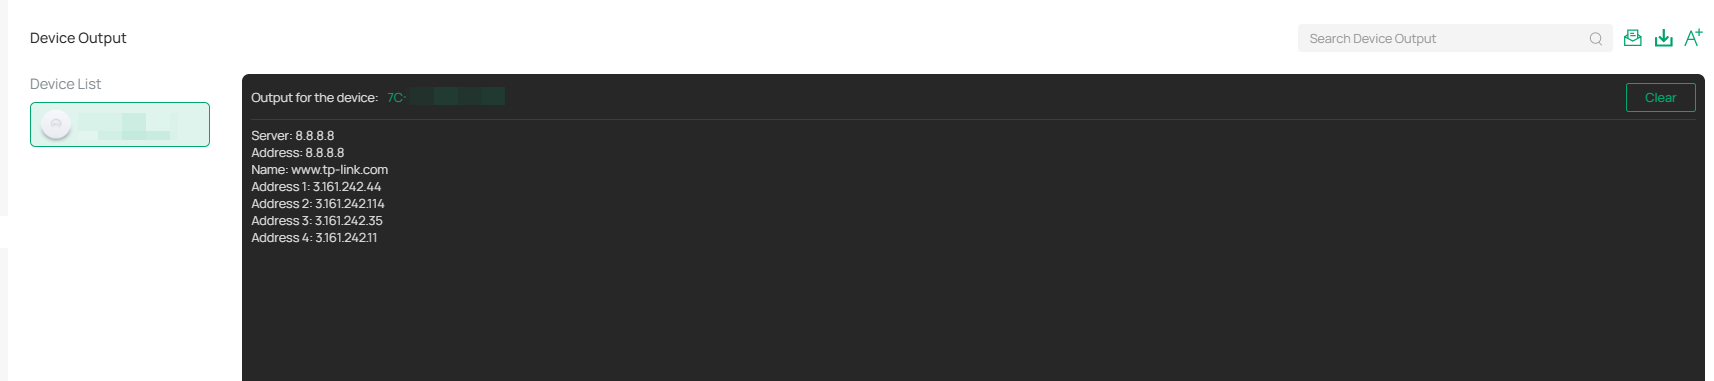
Step 6. If you use the DNSLookup tool, select the source device, and configure the target domain/IP. Then click the Run button.
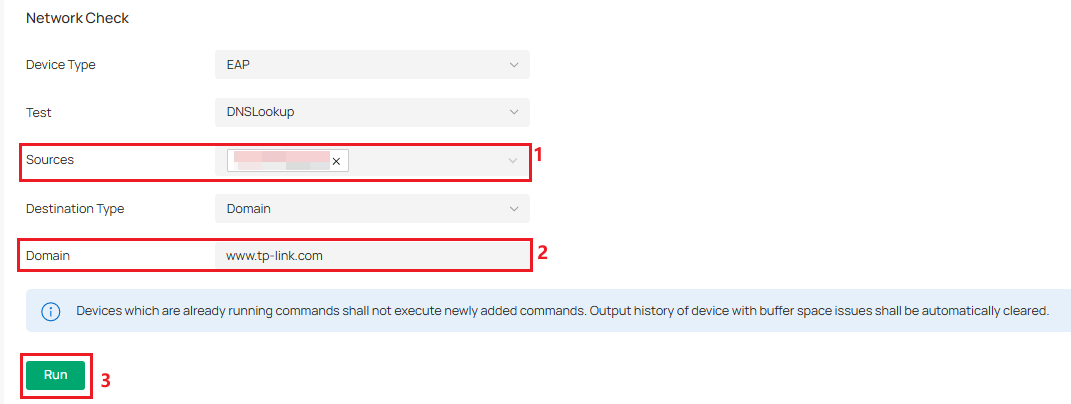
Then you can check the DNSLookup result in the terminal.
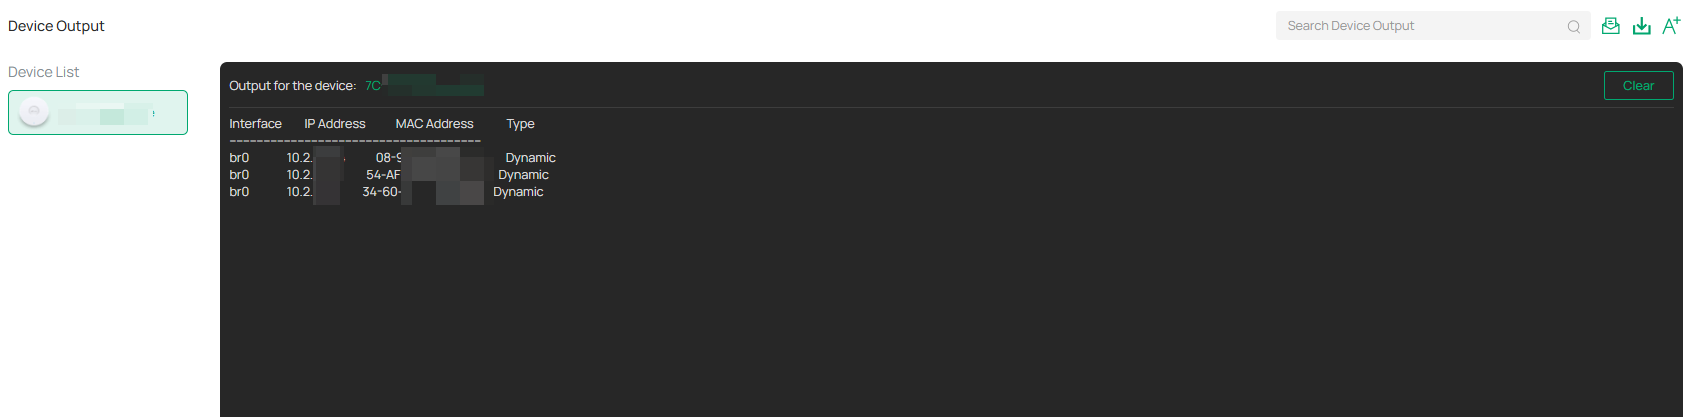
Step 7. If you use the ARP Table tool, select the source device. Then click the Run button.
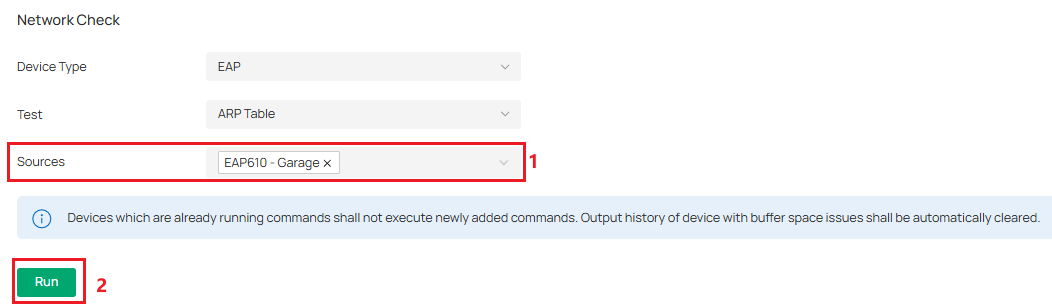
Then you can check the ARP Table in the terminal.
Packet Capture
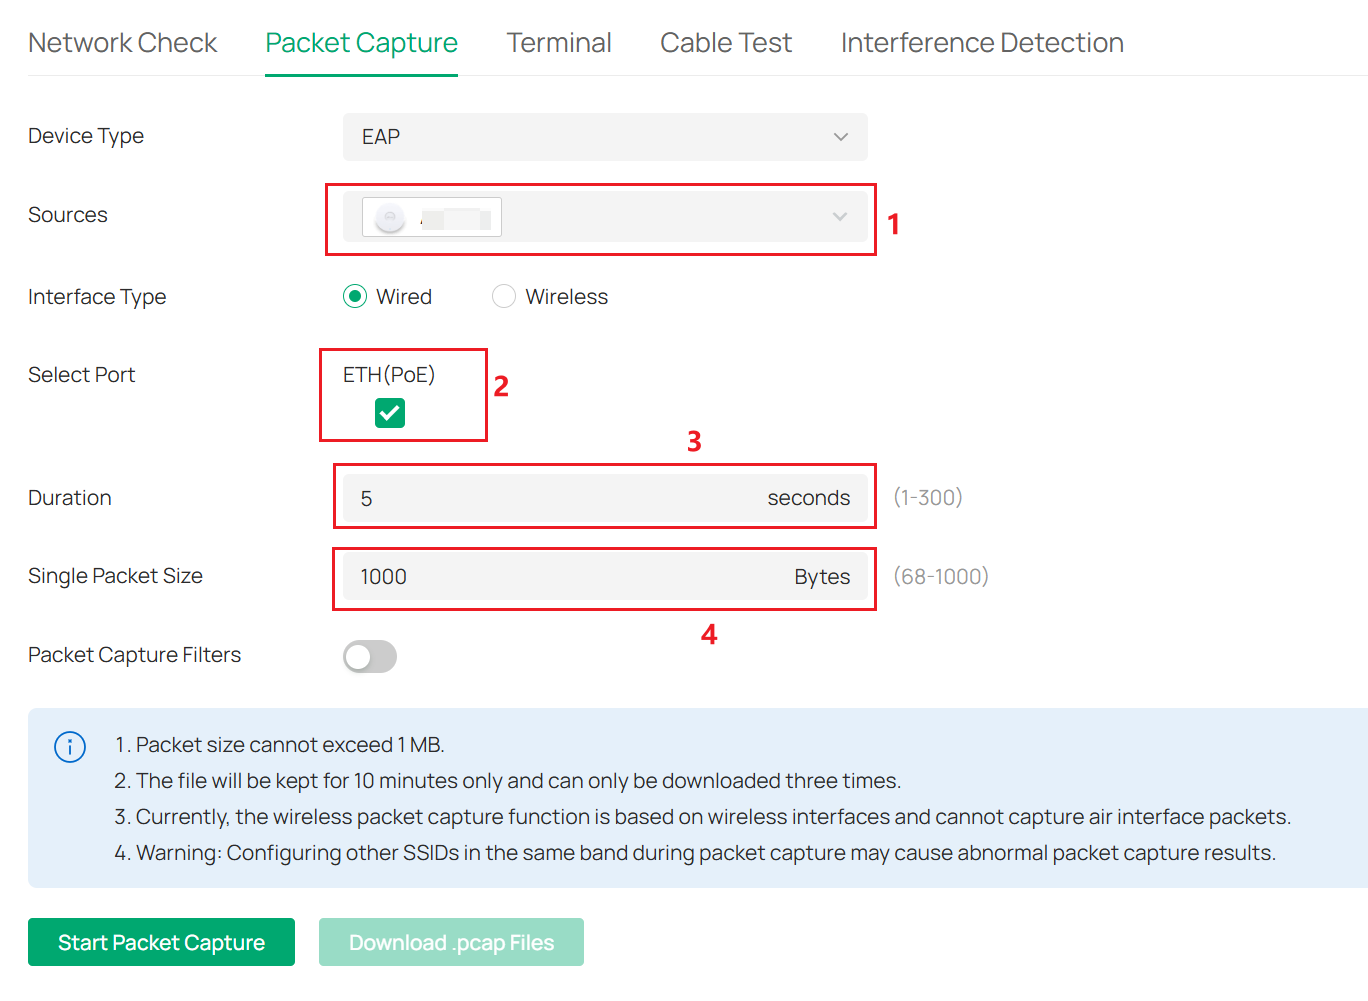
Step 1. Enter Network Check page in Site > Network Tools > Packet Capture.
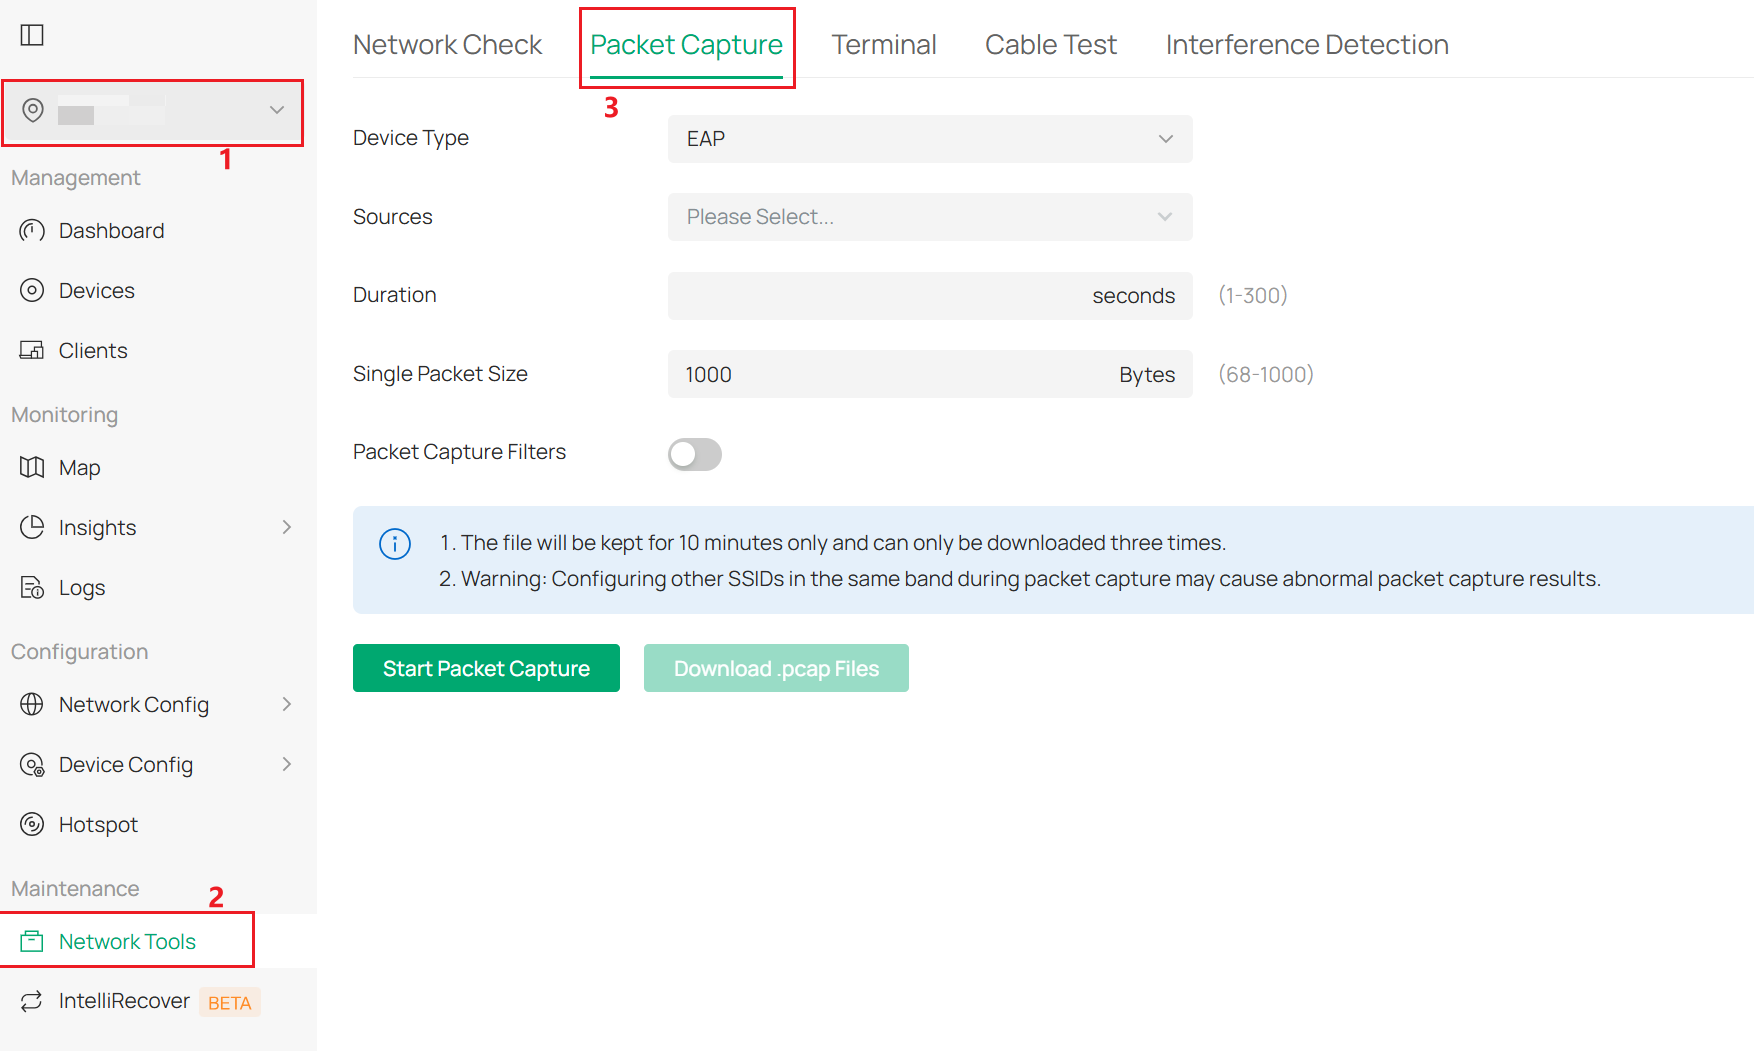
Step 2. Select the source device and the port, then configure the duration and packet size.
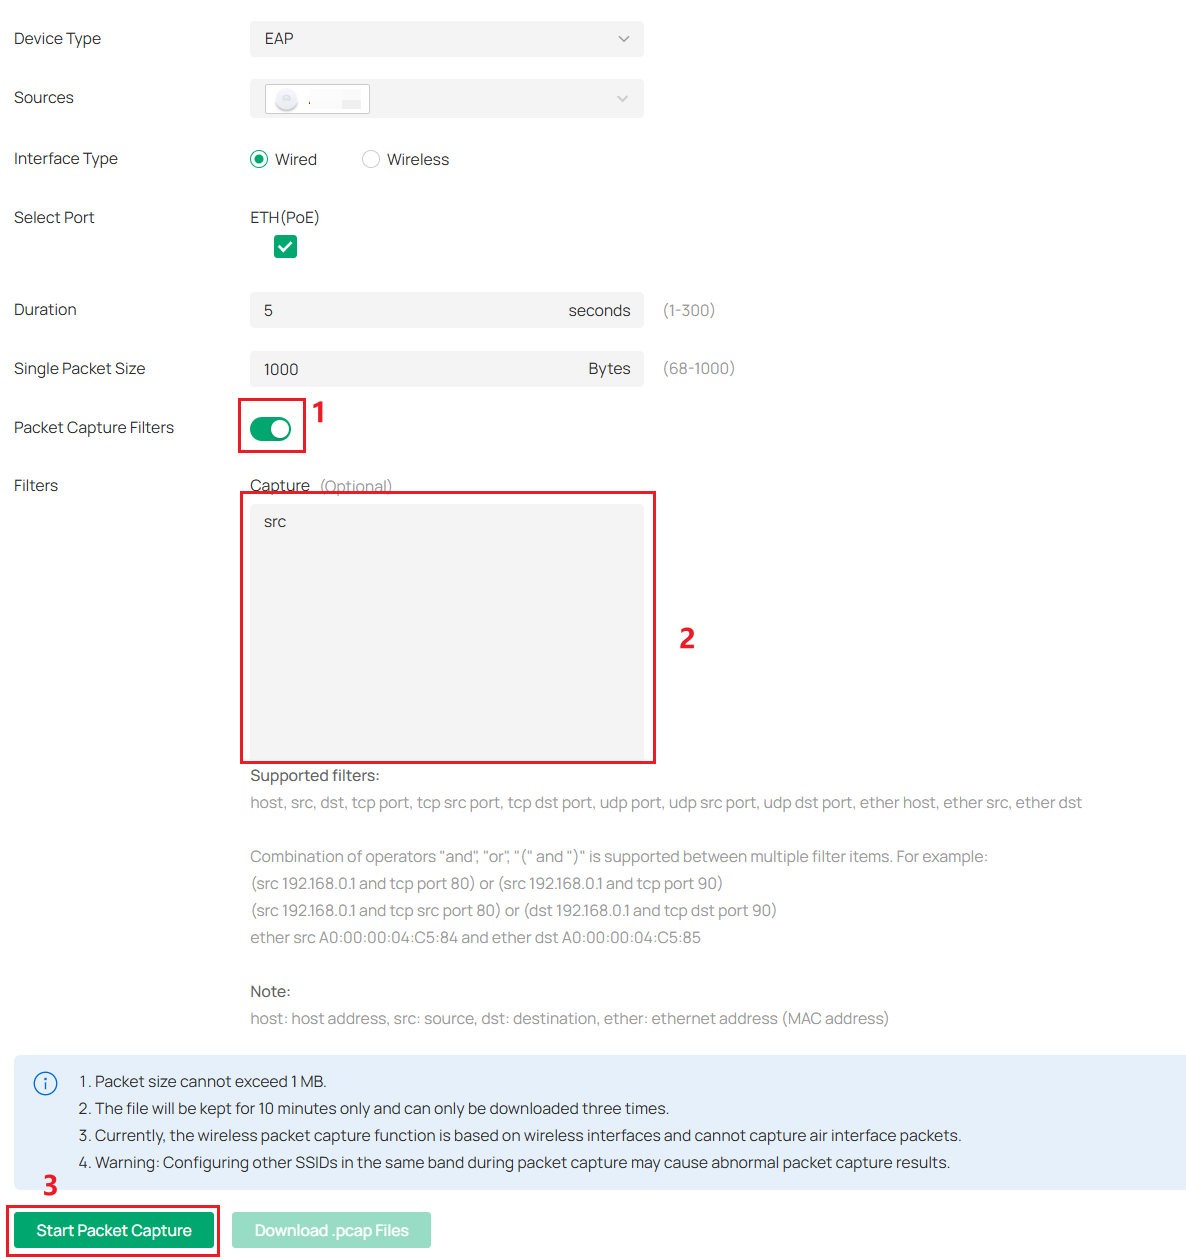
Step 3. If you only need the specific package, you can use the Packet Capture Filters. Enable the function and enter the specific filtering criteria. Click Start Packet Capture to start.
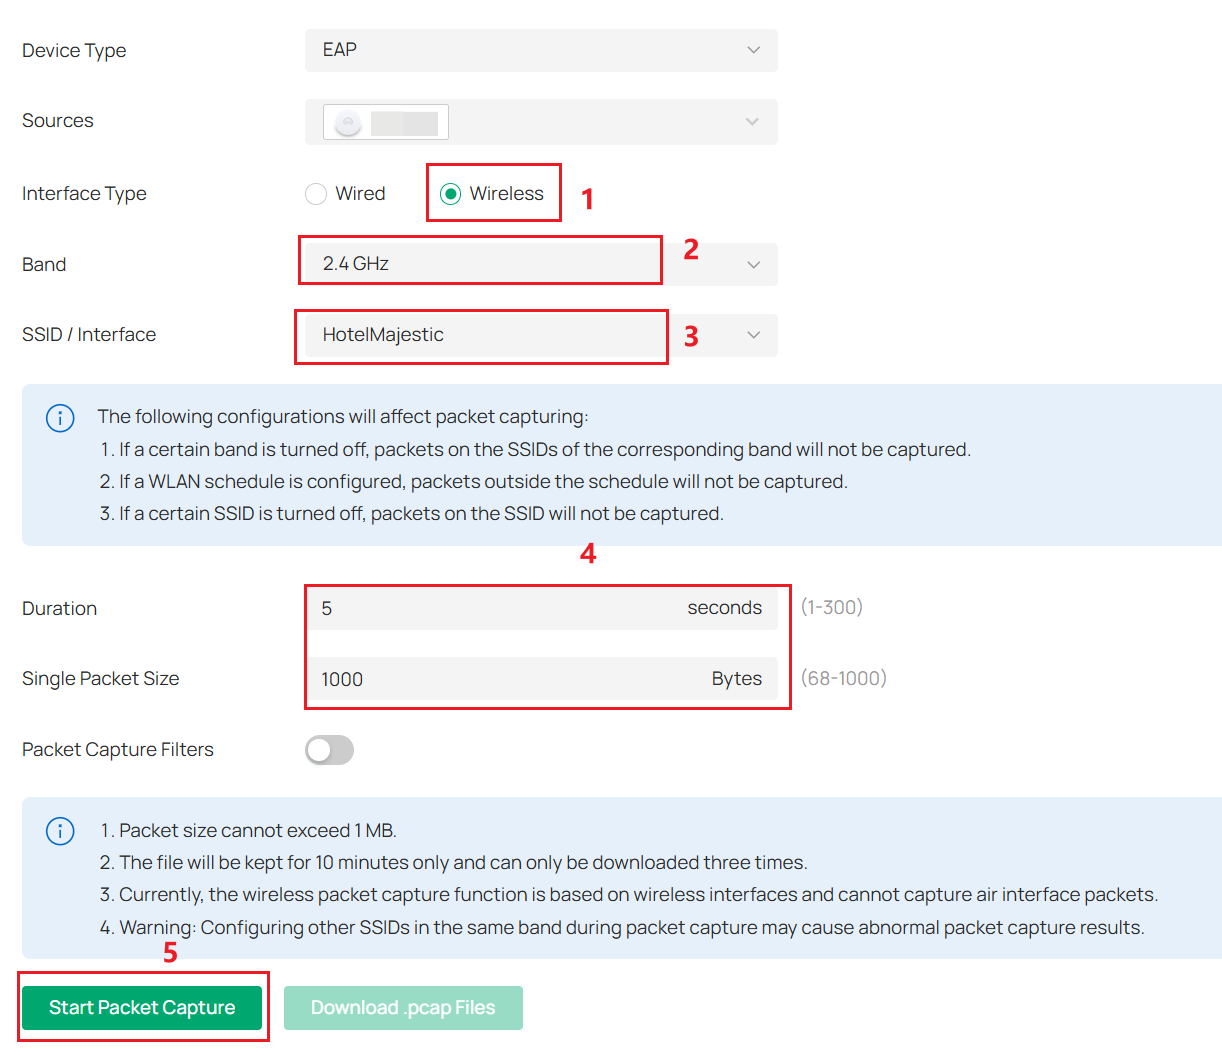
Step 4. If you want to perform wireless packet capture, you should select the wireless mode first. Then select the band and SSID to be captured. And configure the duration and packet size. Click Start Packet Capture to start.
Step 5. If you want to use the packet capture feature on the gateway, the Controller currently allows you to capture network packets based on the WAN port or VLAN, which helps with network diagnostics. Select the Gateway type and device. For Network Type, you can choose either WAN Port or VLAN. Then select the target WAN port or VLAN ID. Click Start Packet Capture to start.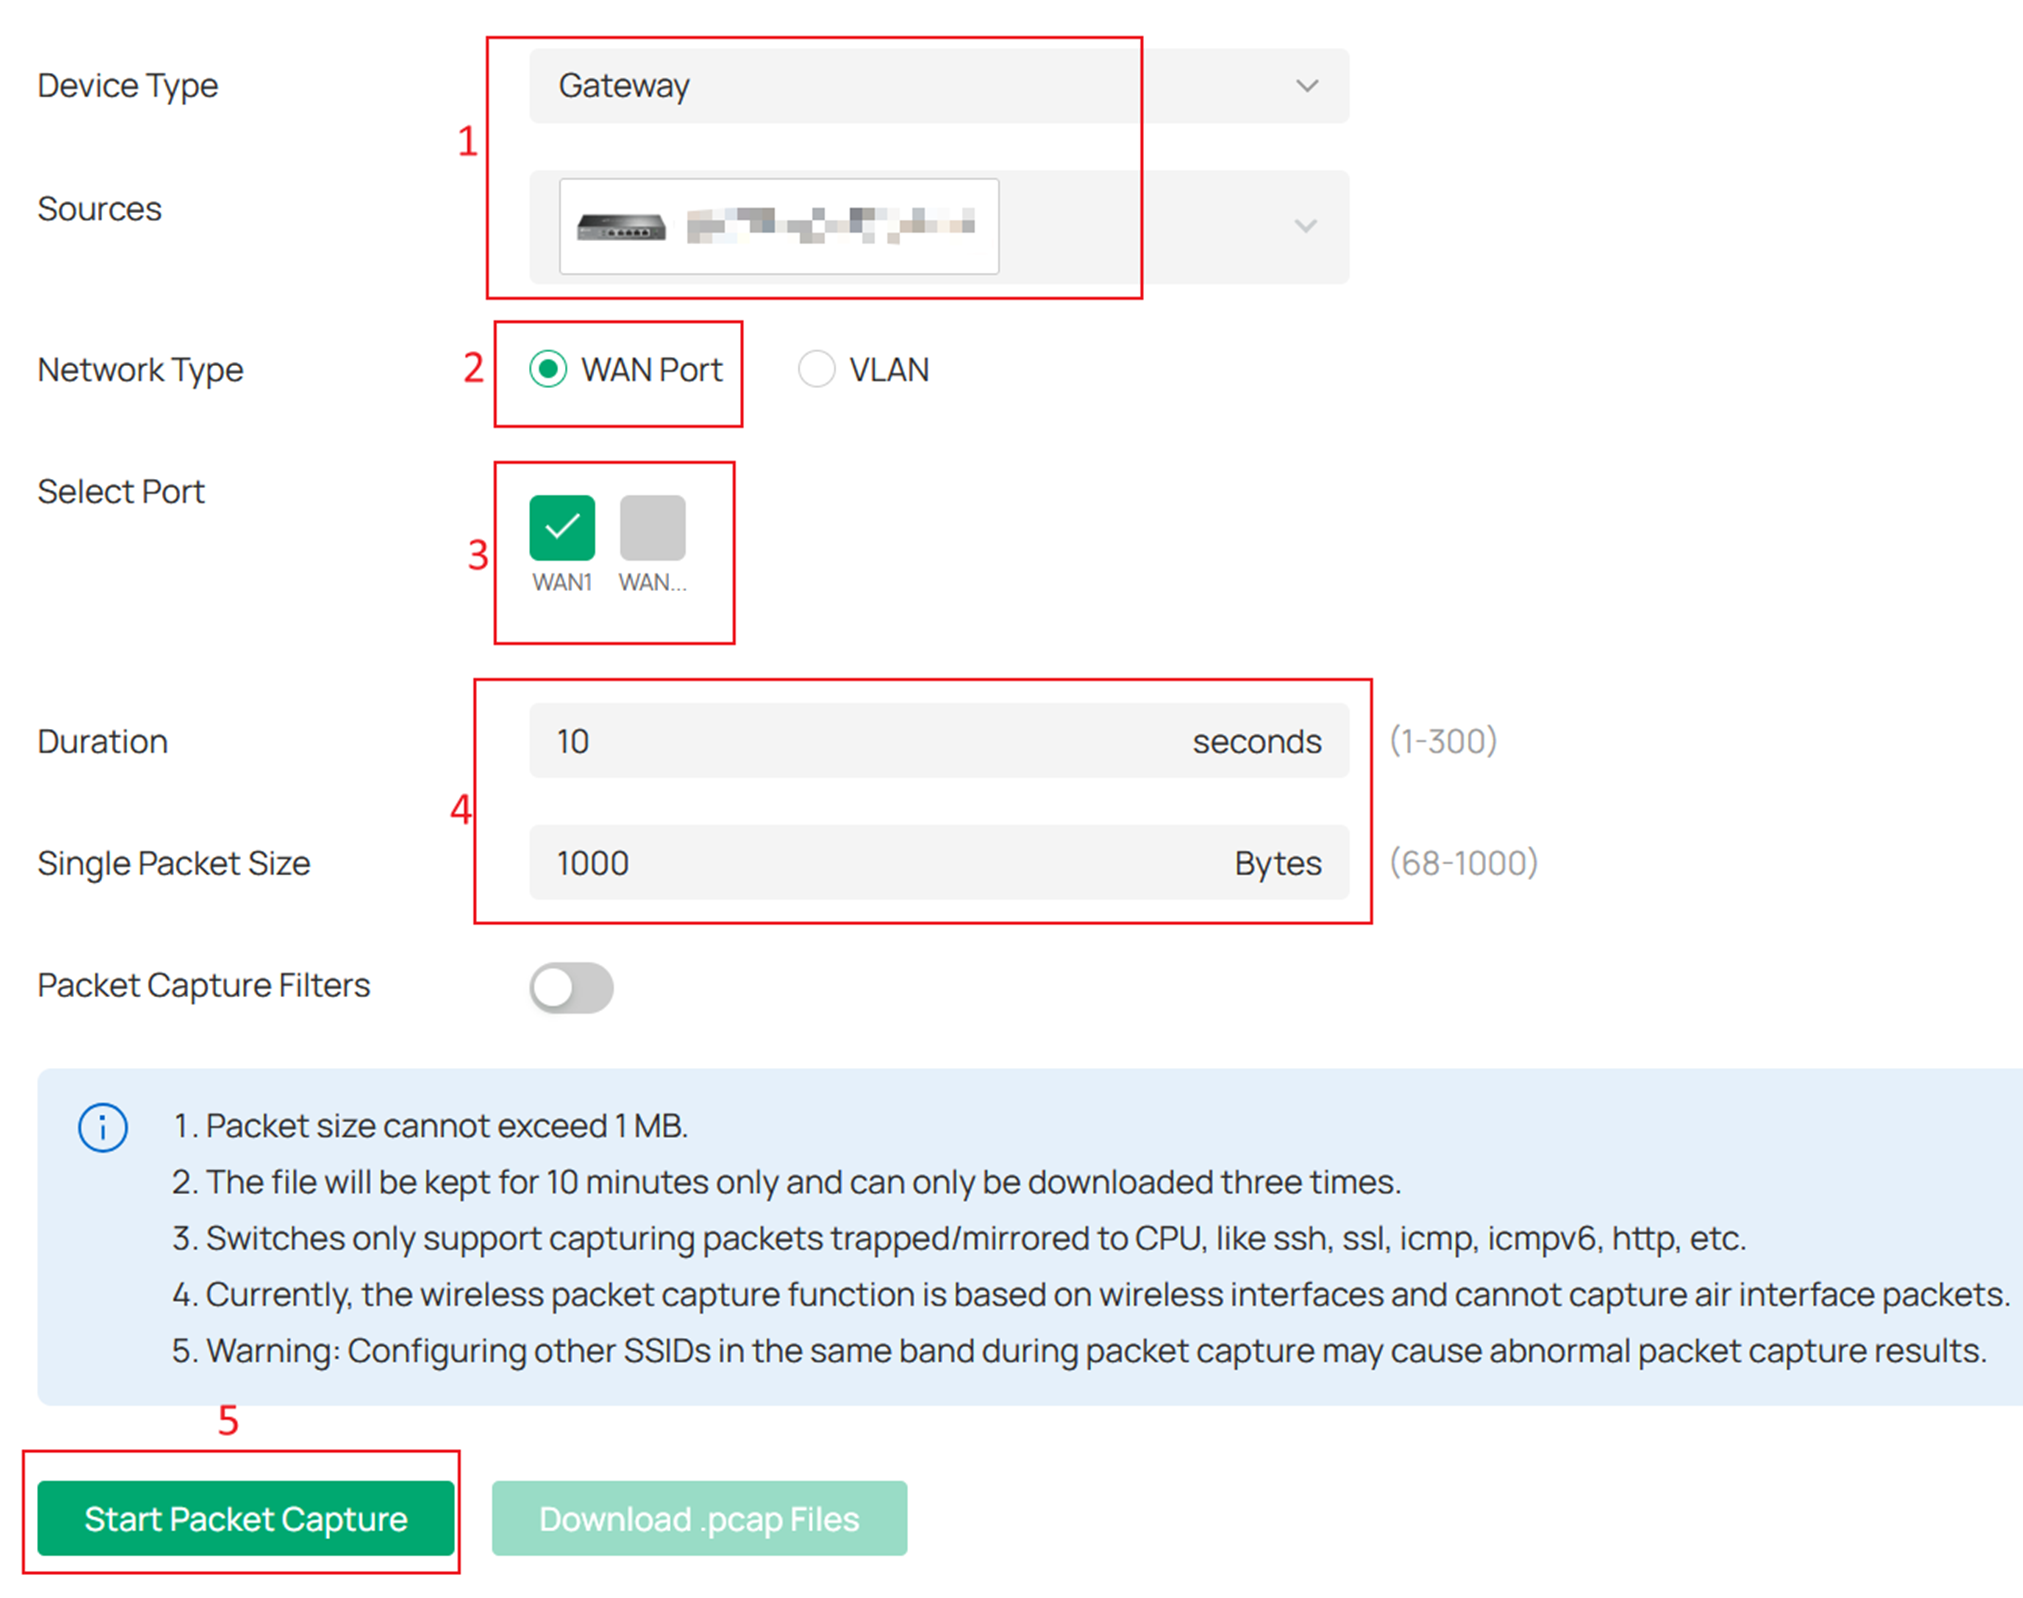
Terminal
Step 1. Enter Network Check page in Site > Network Tools > Terminal.
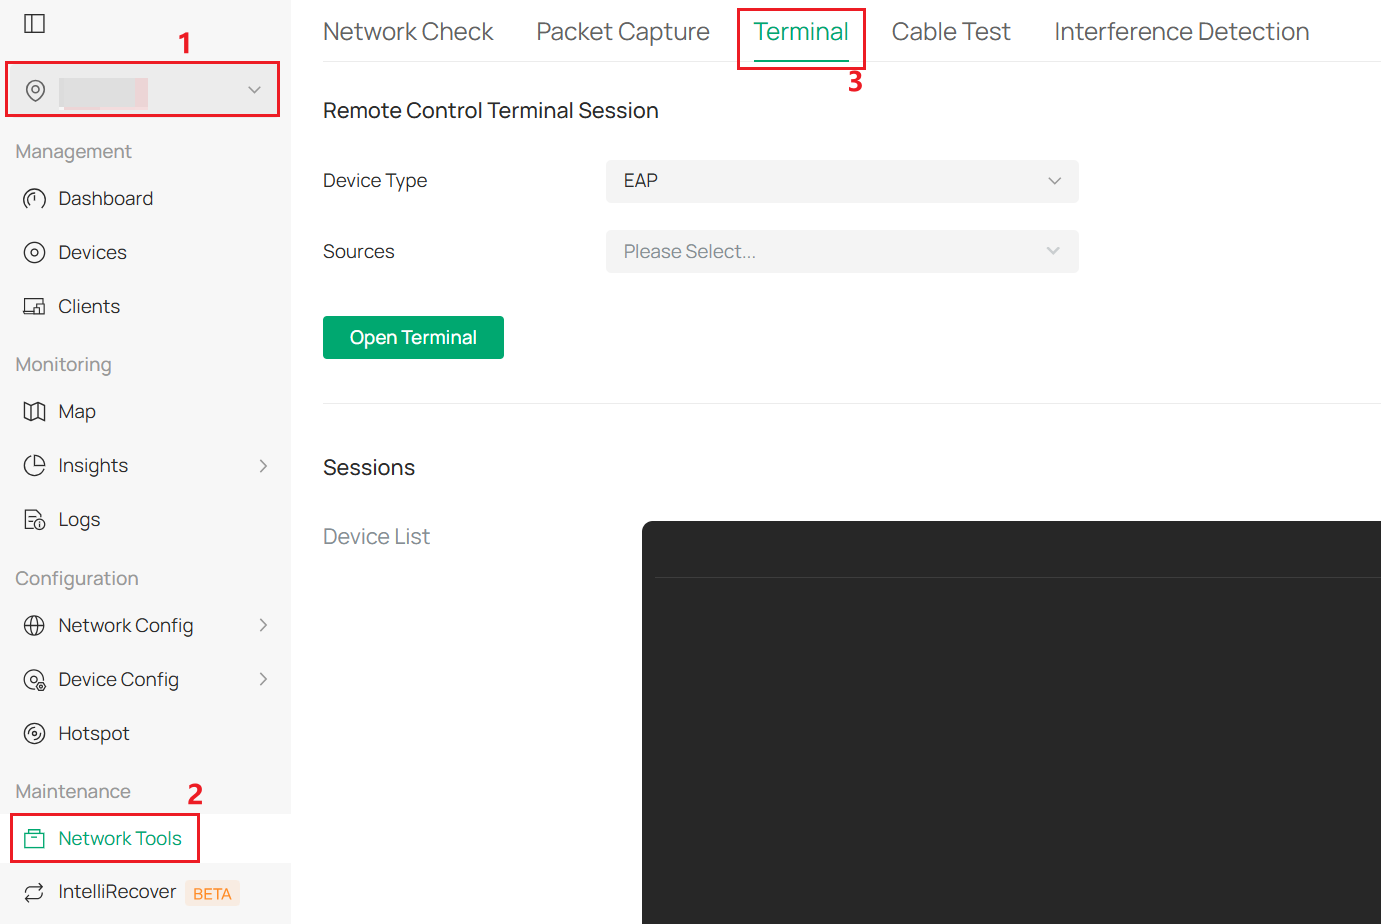
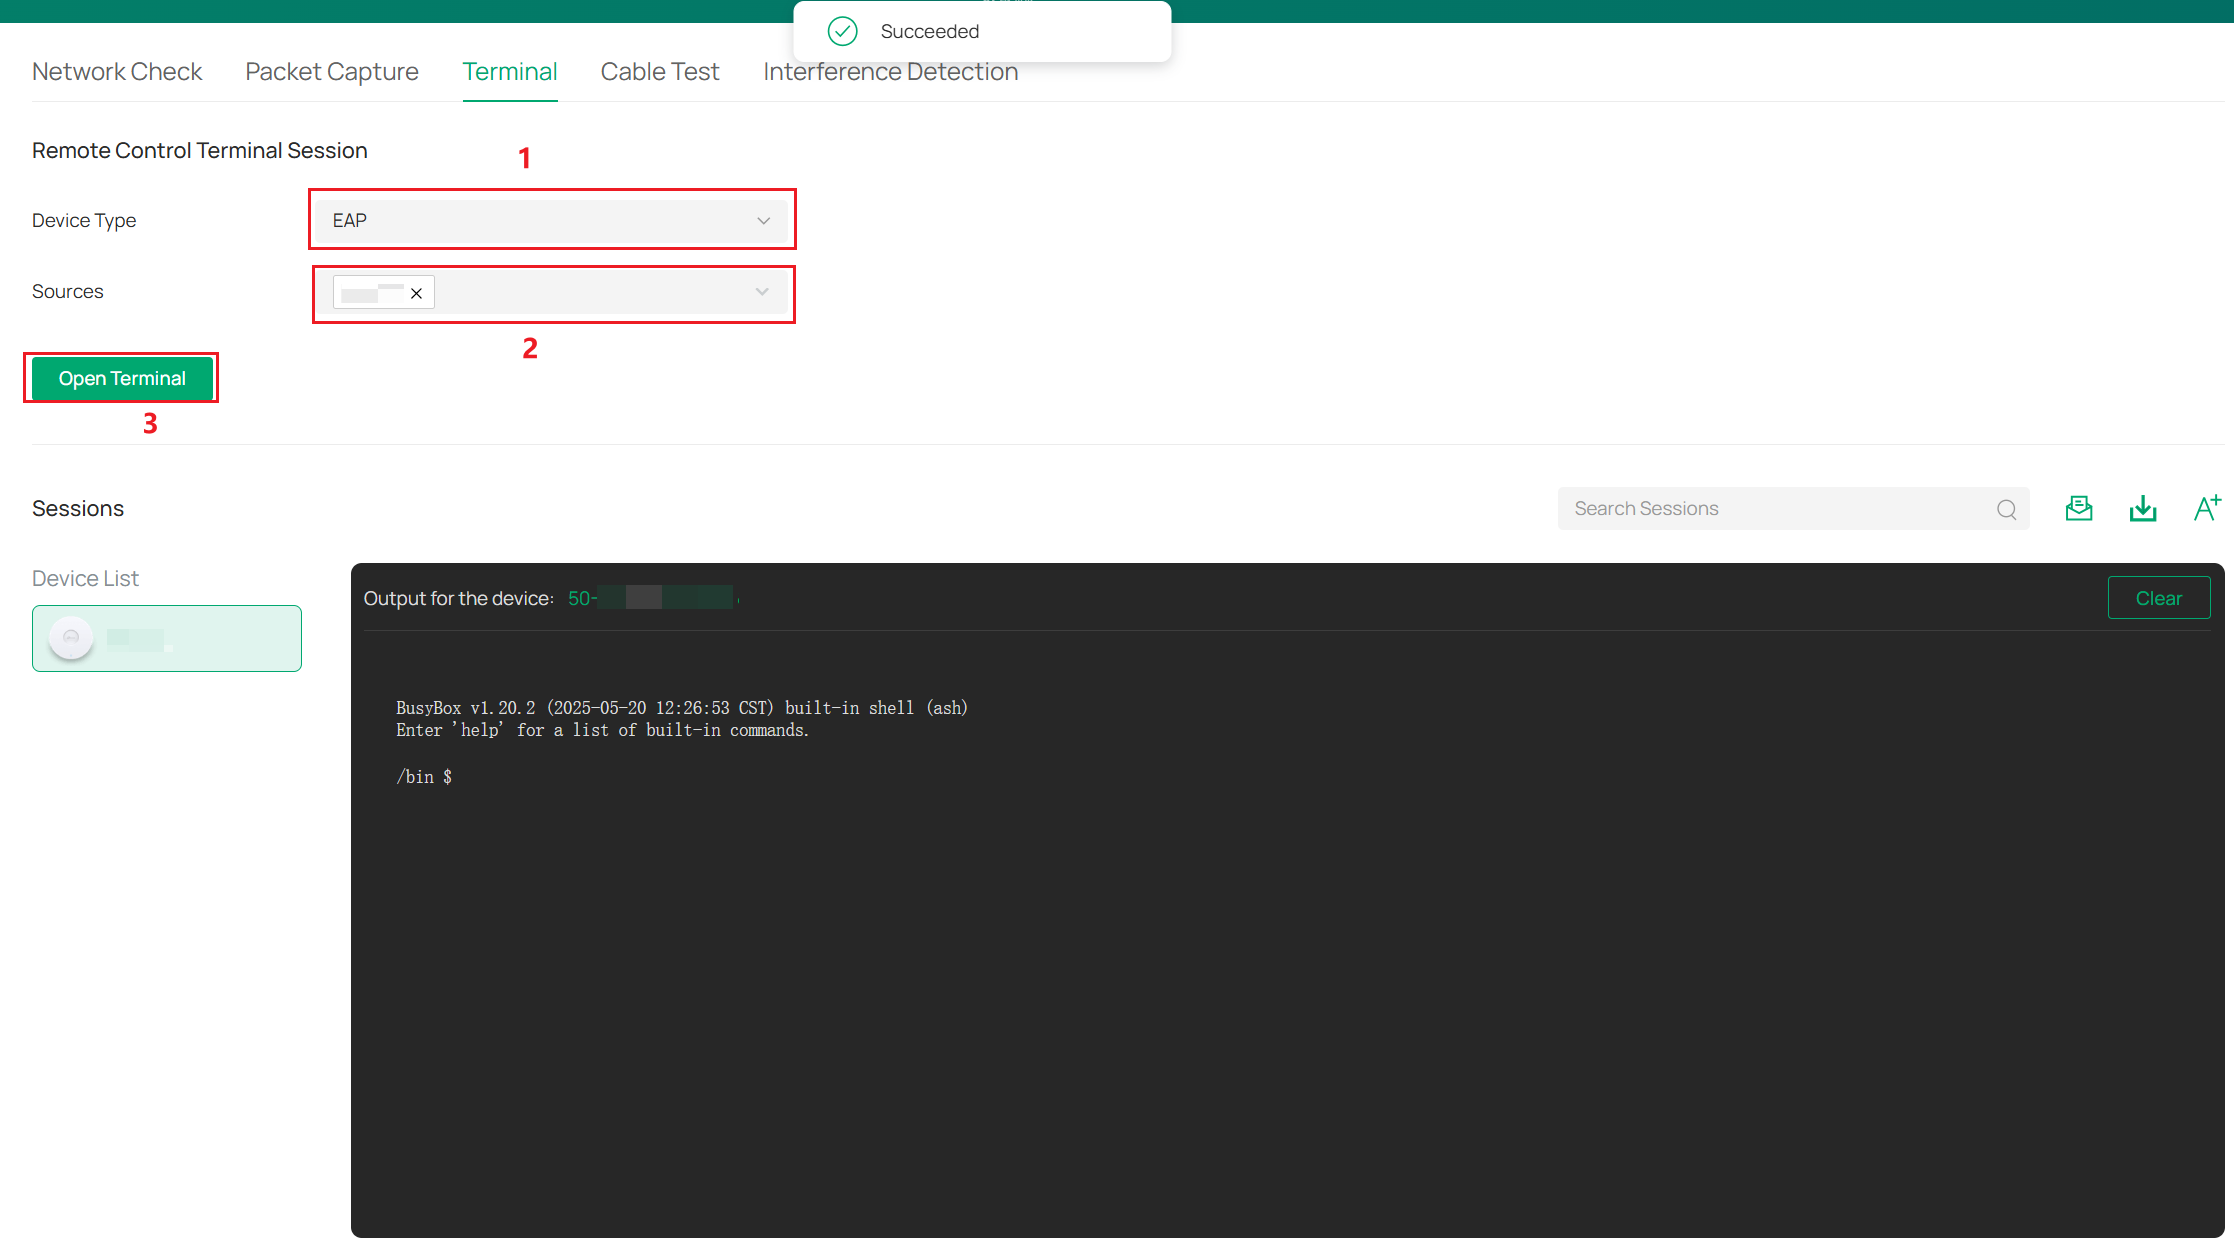
Step 2. Select the Device Type and Sources, then click Open Terminal. After pressing "succeed", you can then use the terminal in the pane at the bottom right of the page.
Cable Test
Step 1. Enter the Network Check page in Site > Network Tools > Cable Test.
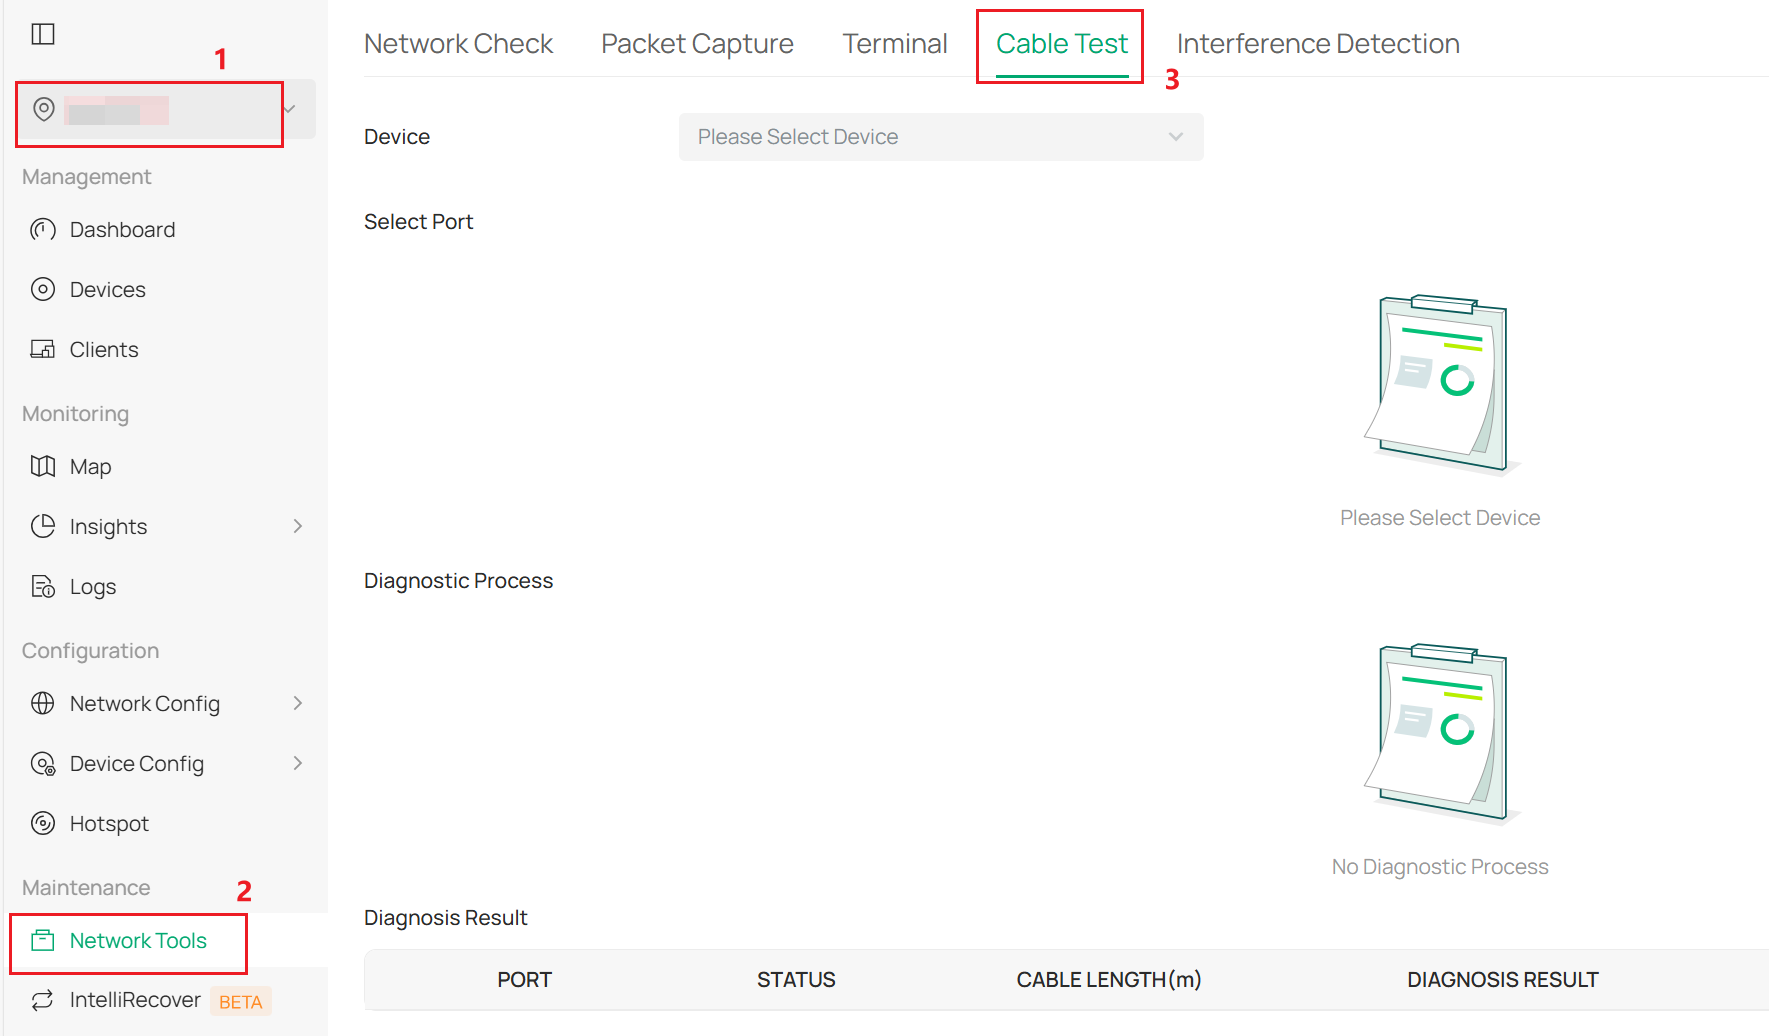
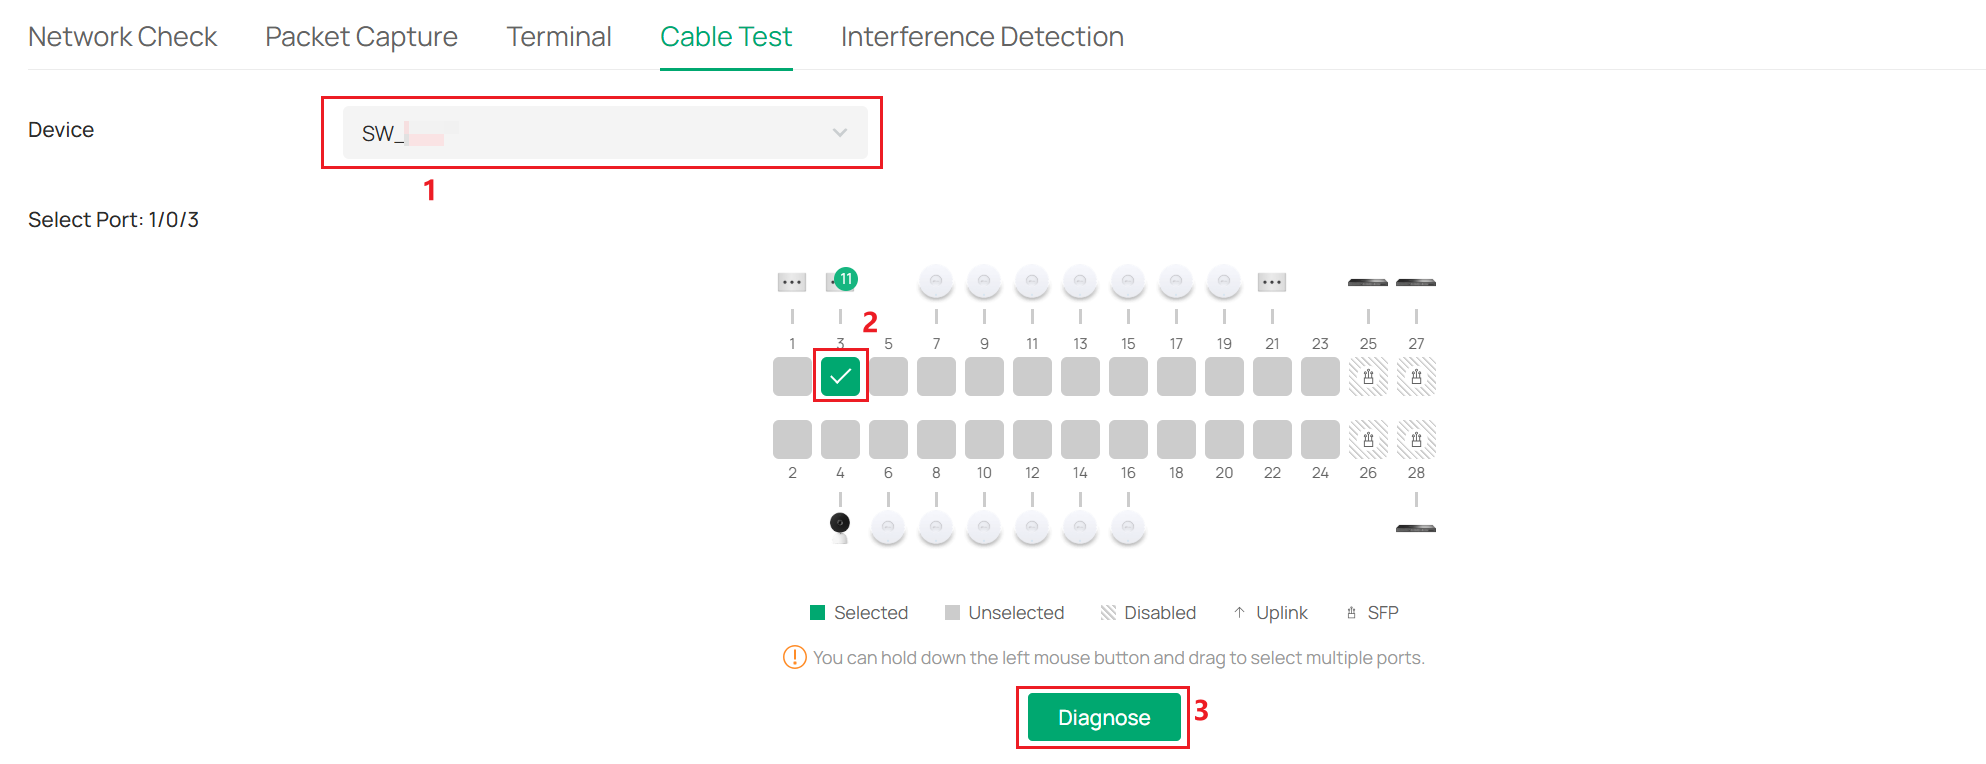
Step 2. Select the device and port to diagnose, then click Diagnose to start.
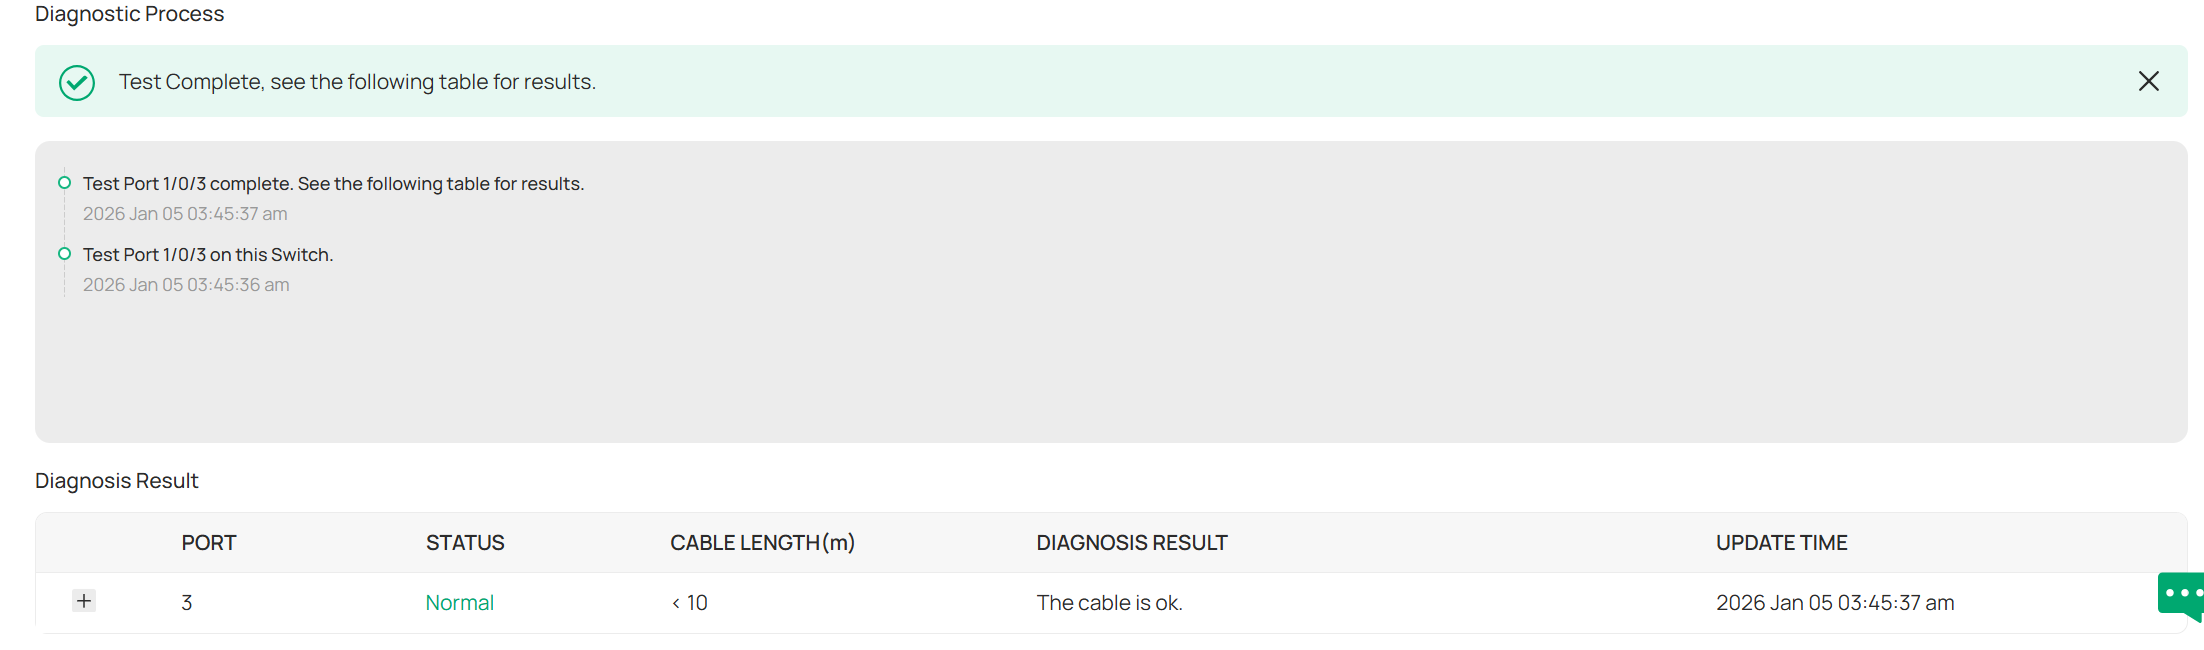
Step 3. Then you can check the process in the Diagnostic Process. When the diagnosis is finished, you can find the result in the Diagnosis Result.
Interference Detection
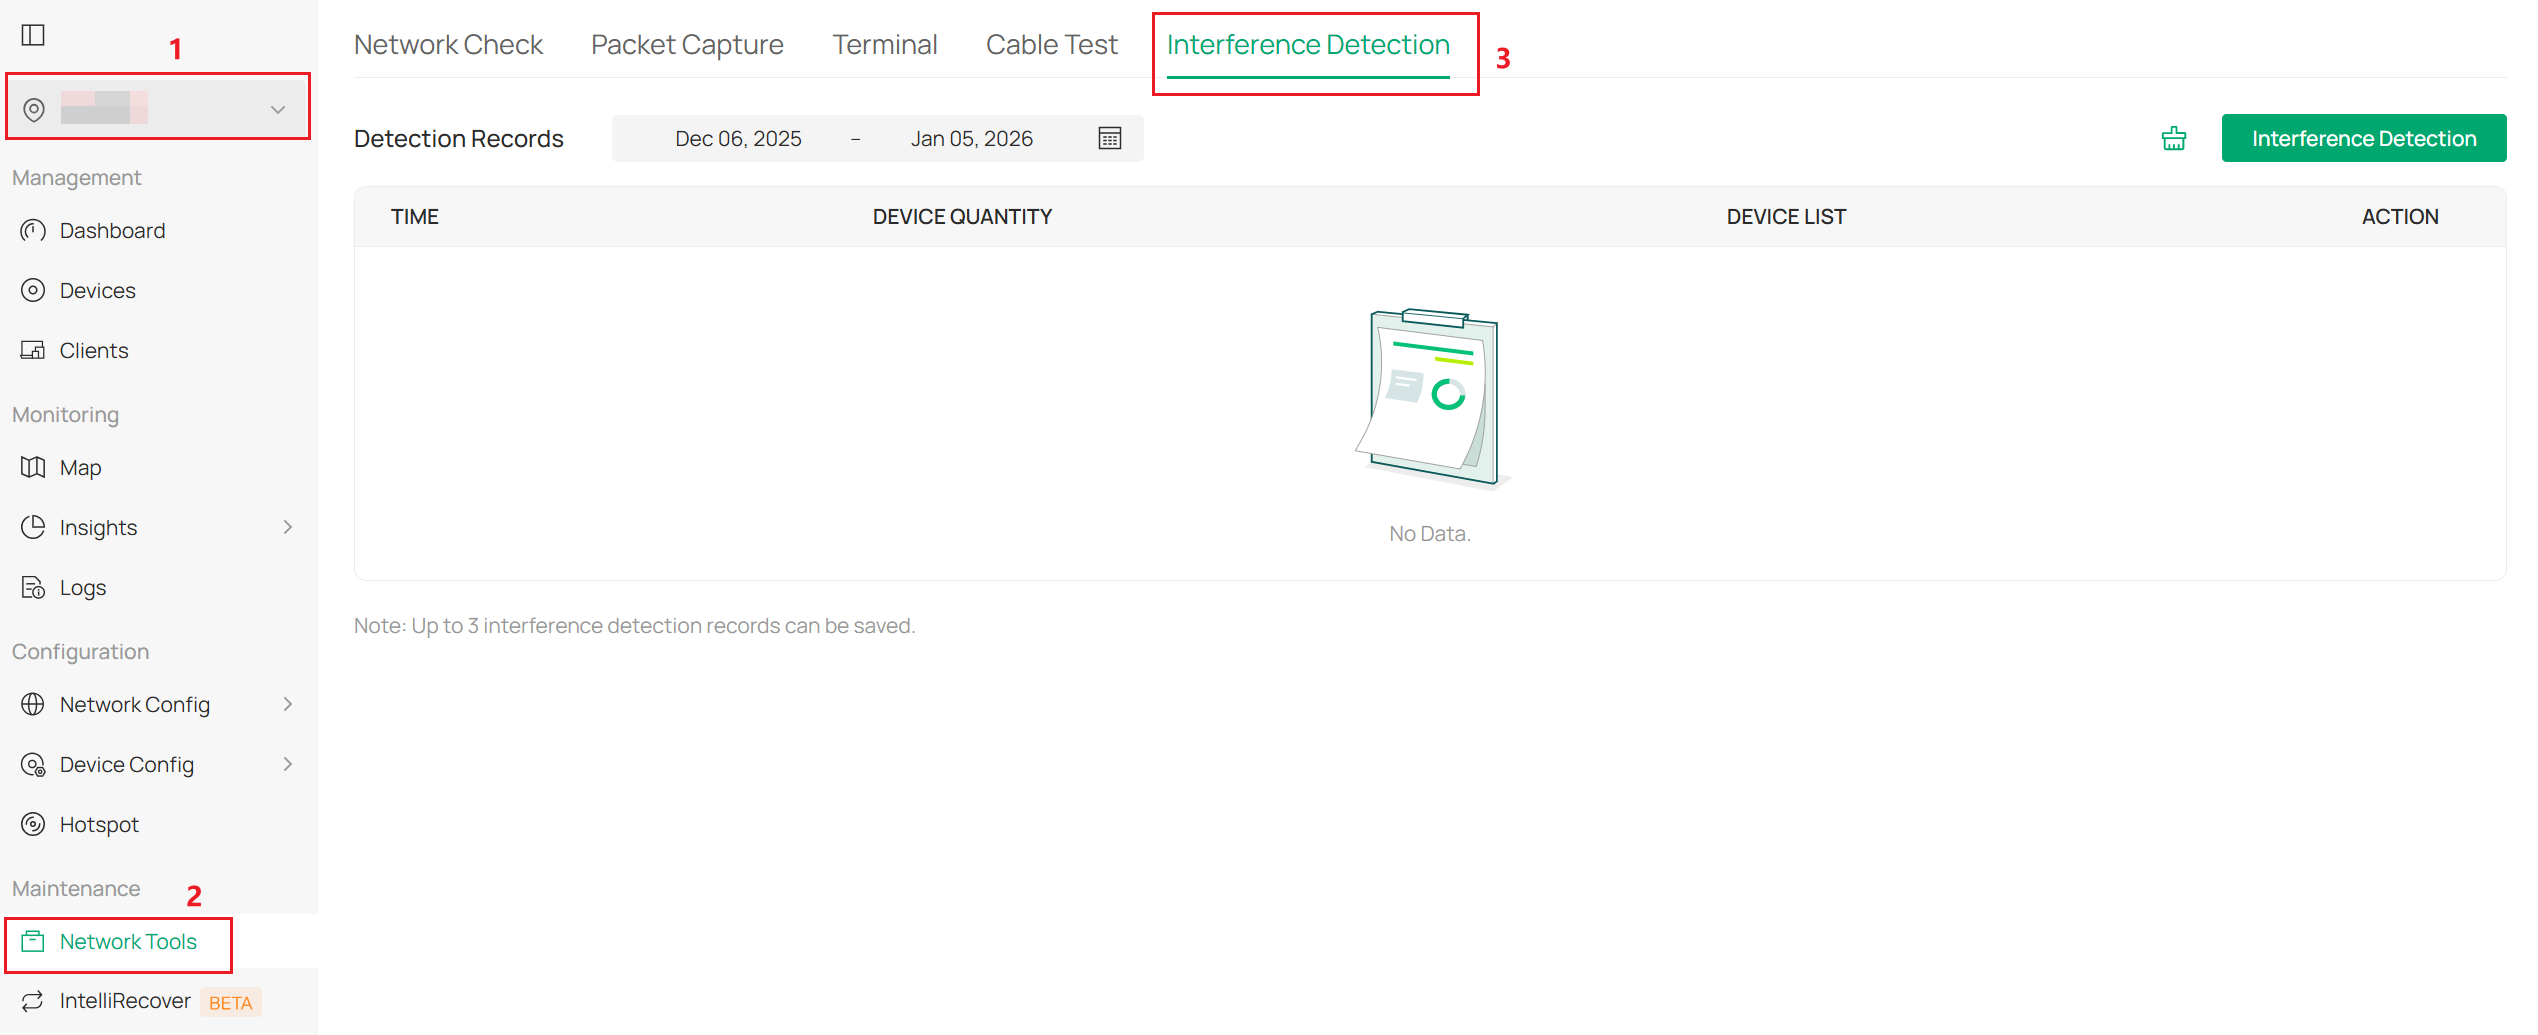
Step 1. Enter Network Check page in Site > Network Tools > Interference Detection.
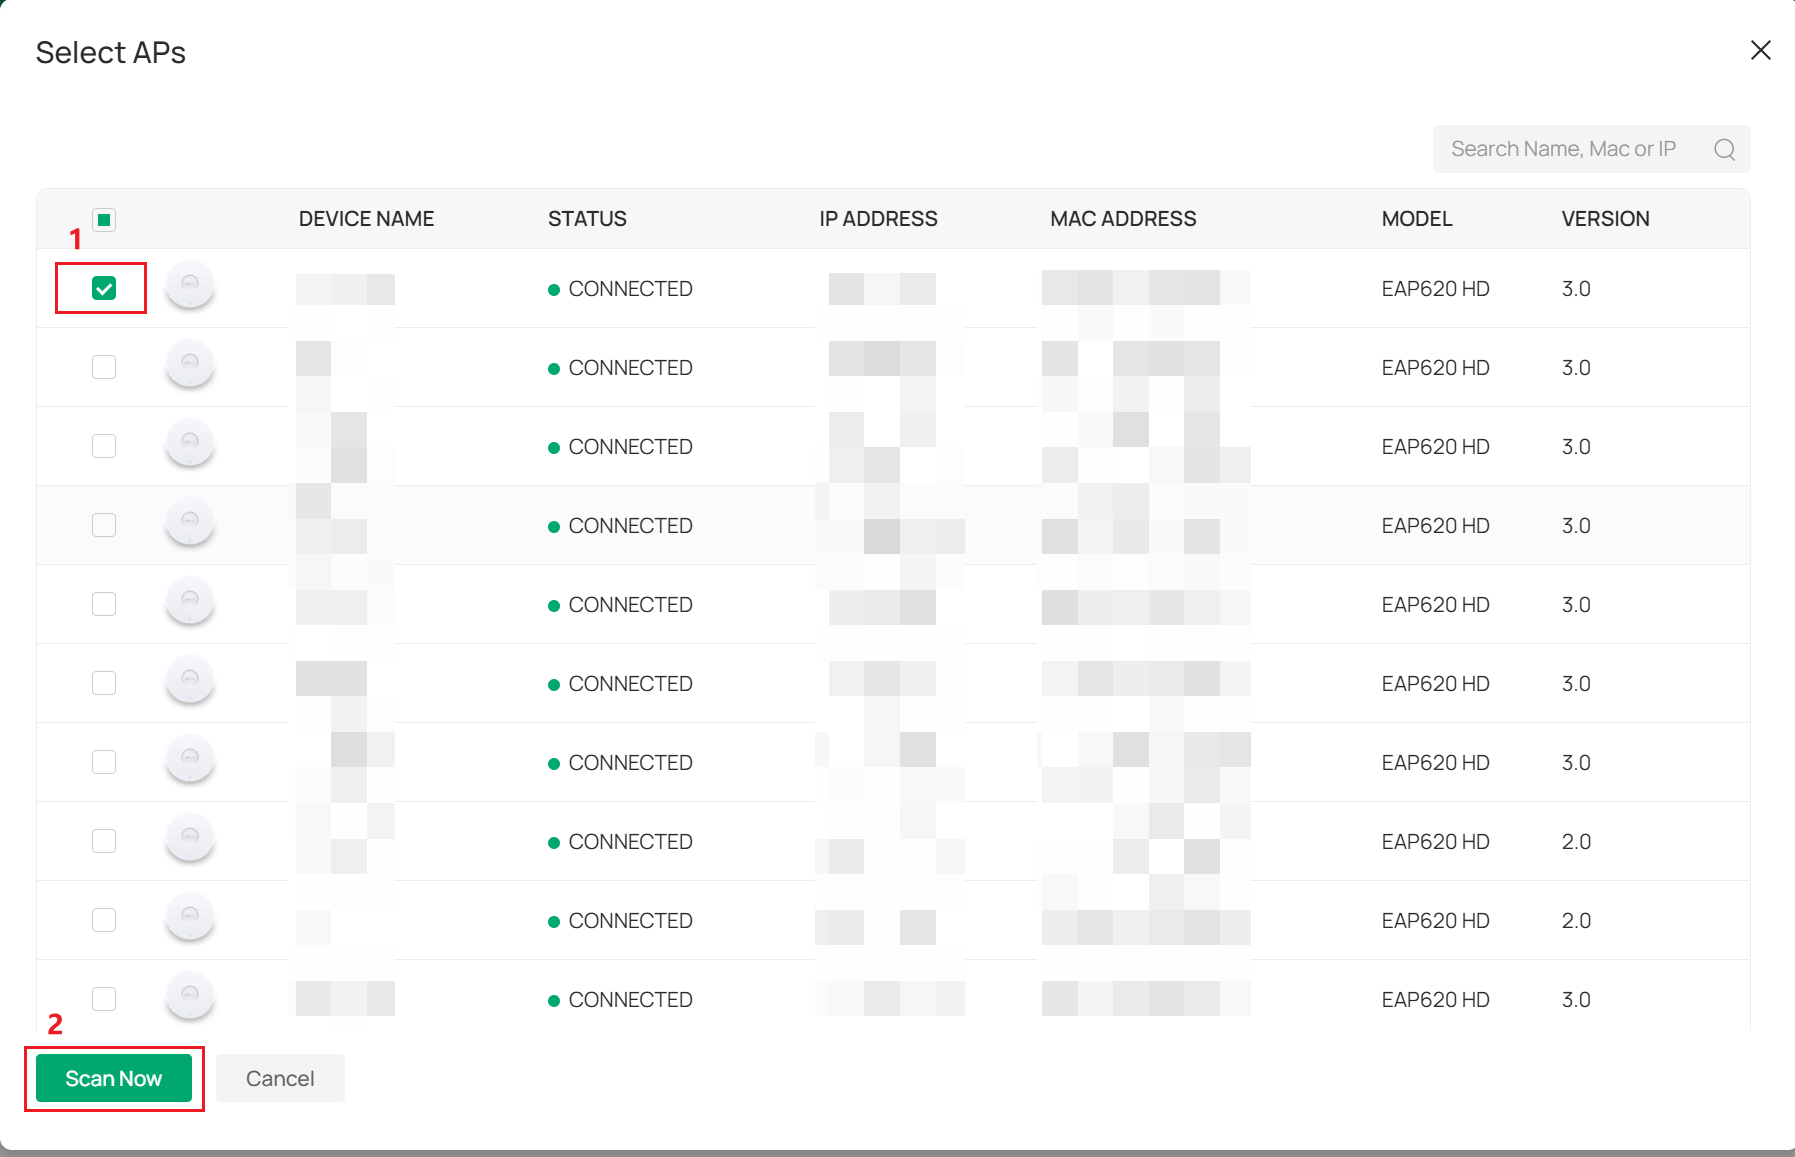
Step 2. Click Interference Detection, select the AP, then click Scan now.
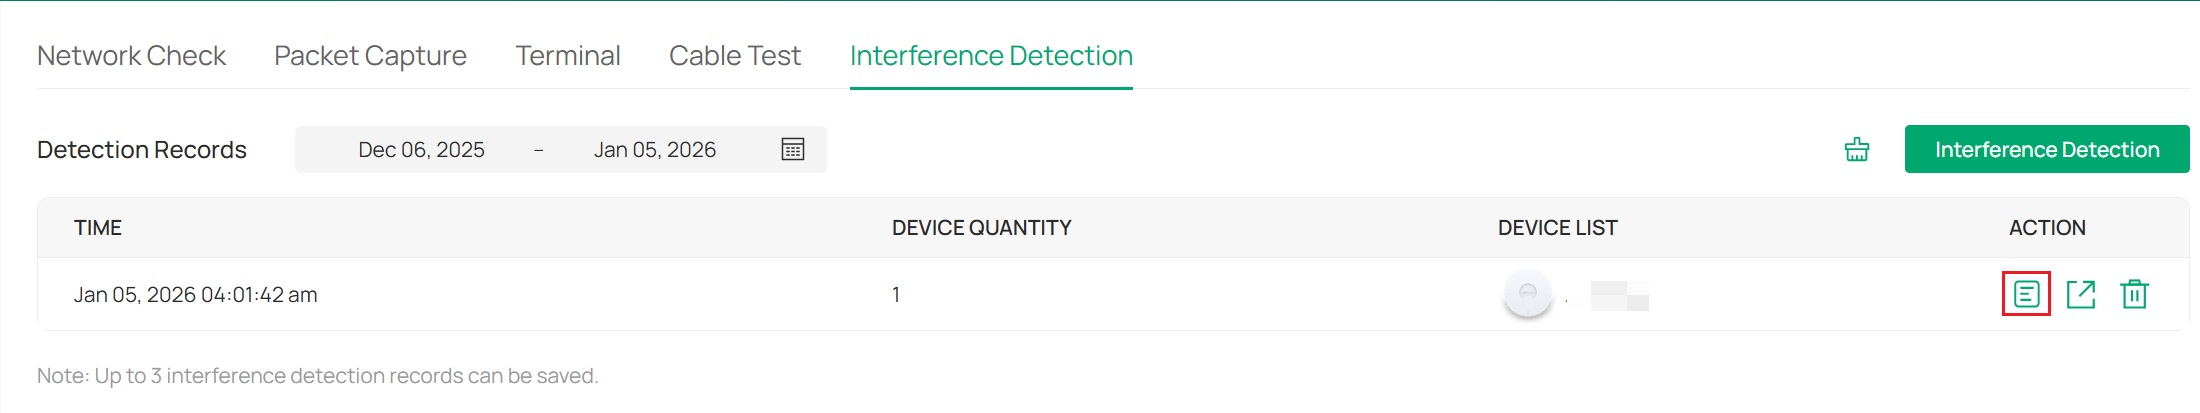
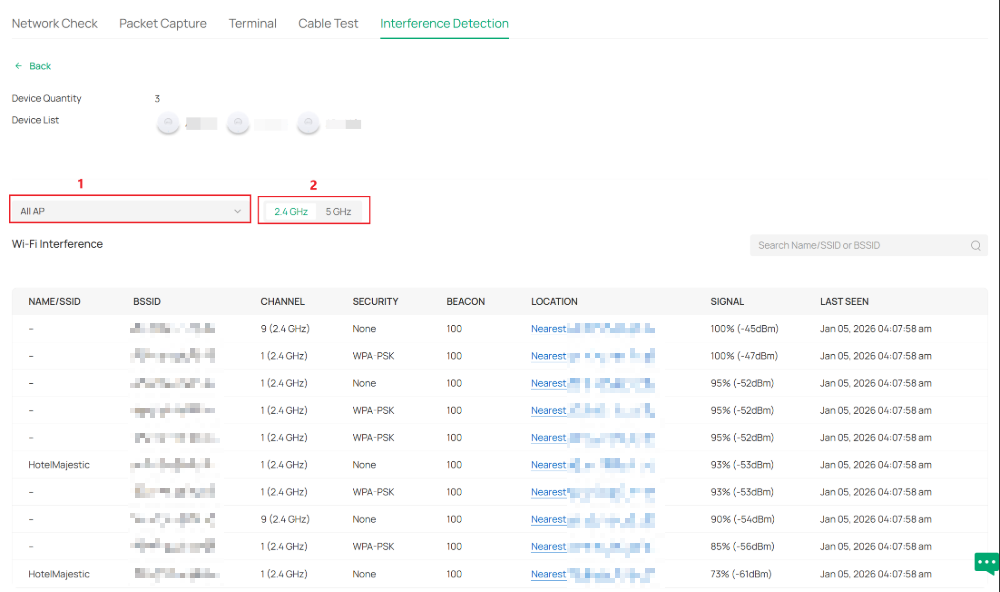
Step 3. Then you can check the result in the Detection Records. And click the detail button to check the details of the interference detection.
Step 4. Select the completed AP and the band you want to check. Then you can see the detection result.
Conclusion
This FAQ mainly introduces several functions under Network Tools on the Controller, including Network Check, Packet Capture, Terminal, Cable Test, and Interface Detection.
Get to know more details of each function and configuration please go to Download Center to download the manual of your product.
