


Contents
Configure abnormal incident thresholds and severity levels on the Controller
Configure incident notifications
Understand incident categories and coverage
Analyze incident root causes and maintenance suggestions
Introduction
In Controller v6.3, the Intelligent Incident Detection module has been extended from Omada Pro Controller to a broader deployment scope, making advanced network diagnostics available to more users. This release also introduces significant improvements in user interaction and overall usability, along with optimizations to several anomaly events to enhance detection accuracy and clarity.
Compared with the Controller Pro page structure, the Incidents section has undergone significant changes in both event categorization and event types. Please refer to the Tutorial for detailed information and guidance on the updated organization, classifications, and functionality.
The Intelligent Incident Detection system continuously monitors network behavior to identify issues such as Client slow to connect, DHCP servers conflict and AP high noise floor. It automatically records faults and precisely locates their root causes, enabling IT administrators to quickly detect, analyze, and resolve problems with greater efficiency.
Each anomaly is clearly presented with comprehensive insights, including detailed records, impact scope analysis, and root cause analysis. The system further provides actionable maintenance recommendations, allowing users to identify and troubleshoot network issues in a simple, intuitive, and reliable manner.
In addition, Controller v6.3 introduces an optimized classification system with nine categories, refined and consolidated from the original ten categories in Controller Pro: Access, Authentication, Roaming, Wireless Environment, Wired Environment, Link, WAN & Services, Device Status, and Security.
Some aspects of this article follow the design of Pro Controller and can be used as a reference: How to Configure Abnormal on Omada Pro Controller
Requirements
- Omada Controller v6.3 and above (Software / Hardware / Cloud-Based)
- Omada Devices firmware required v6.3 and above (Gateway / Switch / EAP)
Configuration
Configure abnormal incident thresholds and severity levels on the Controller
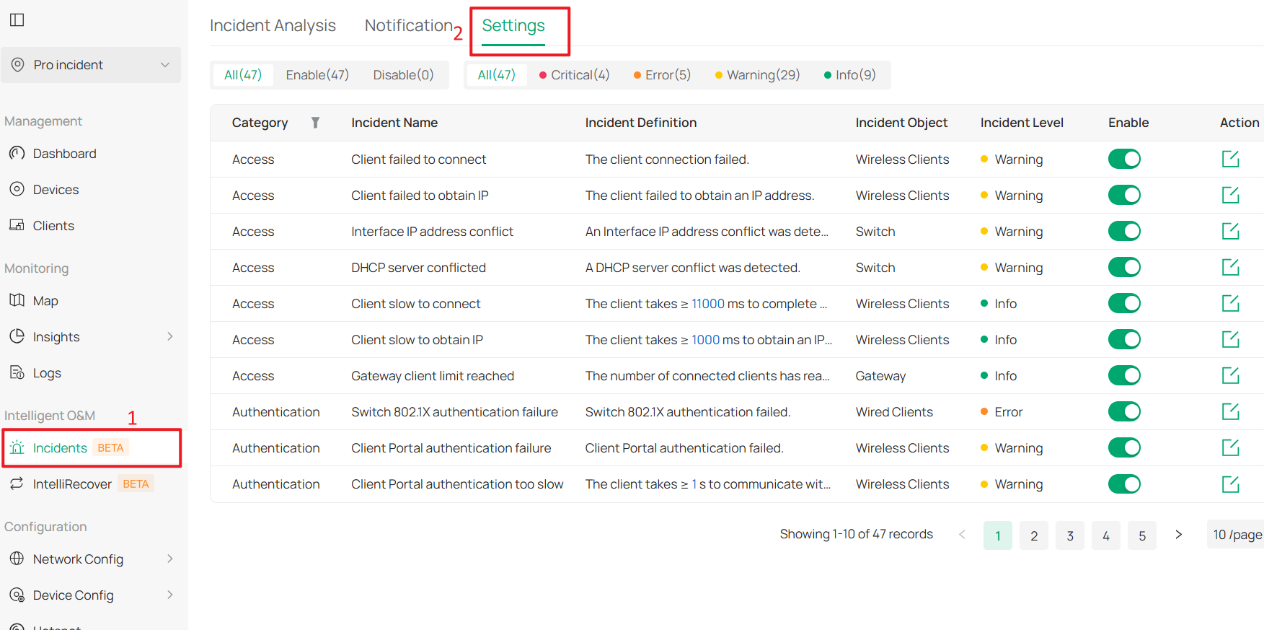
Step 1. Go to: Site View > Incidents > Settings. Here you can find the Edit button in the Action column.
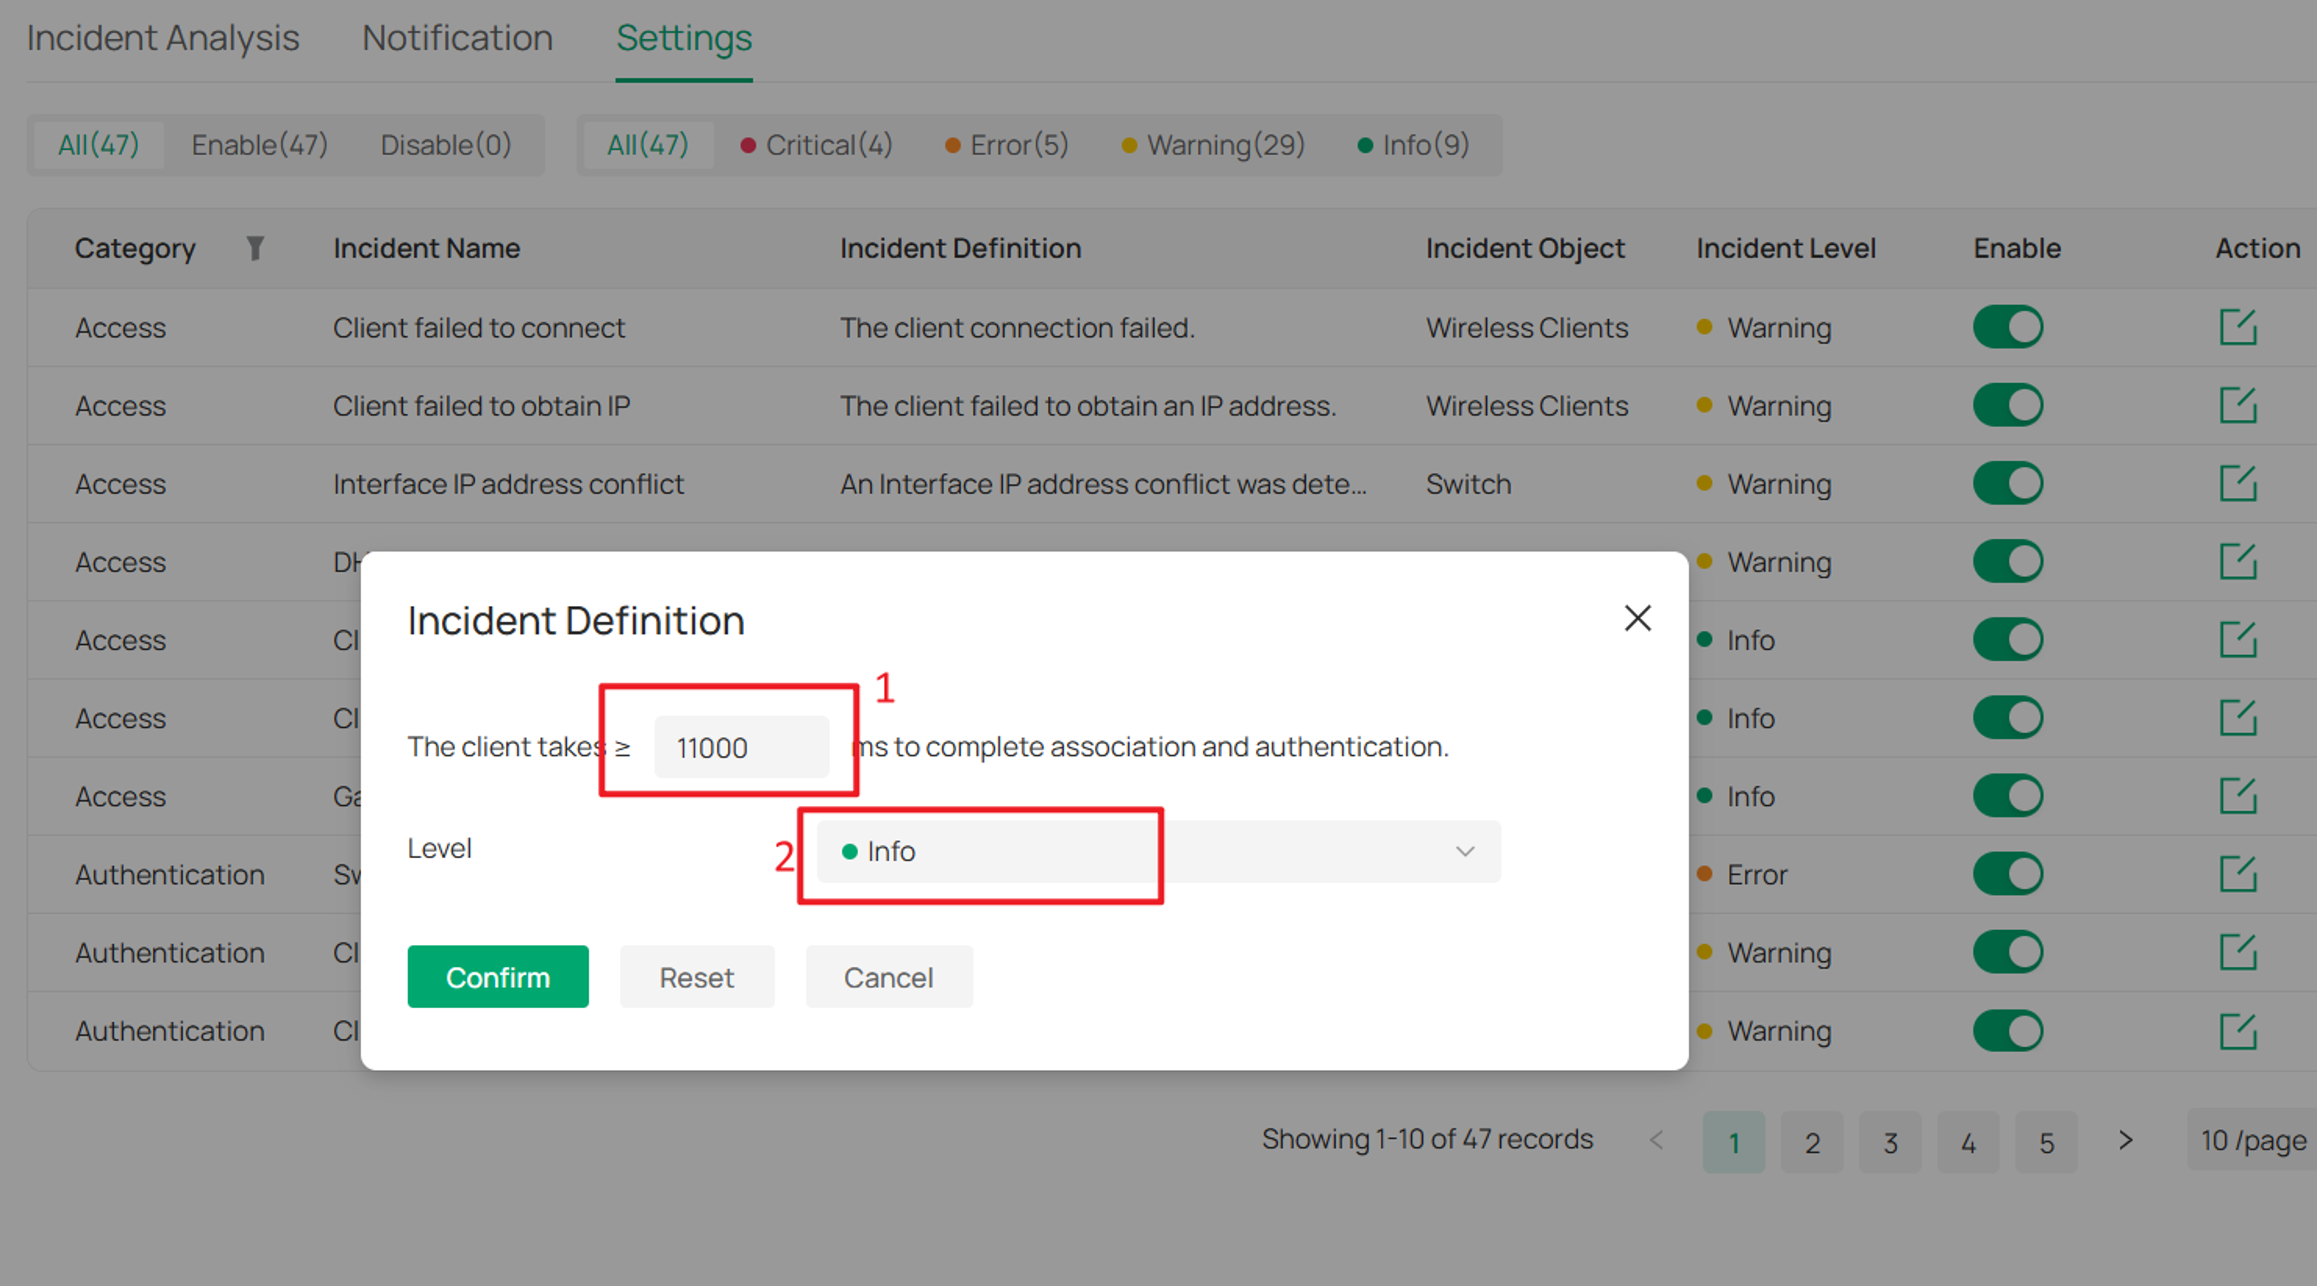
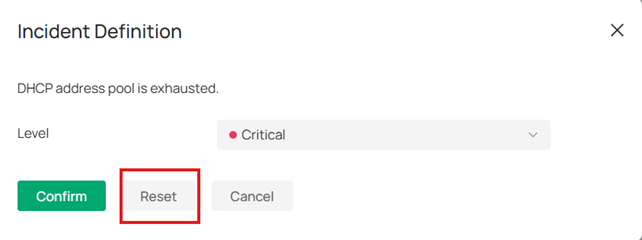
Step 2. Click the Edit button and the Incident Definition window will pop up. Specify the threshold in the Trigger Event field (if applicable) and select the Level for incident severity. Click Confirm to save your configuration.
Configure incident notifications
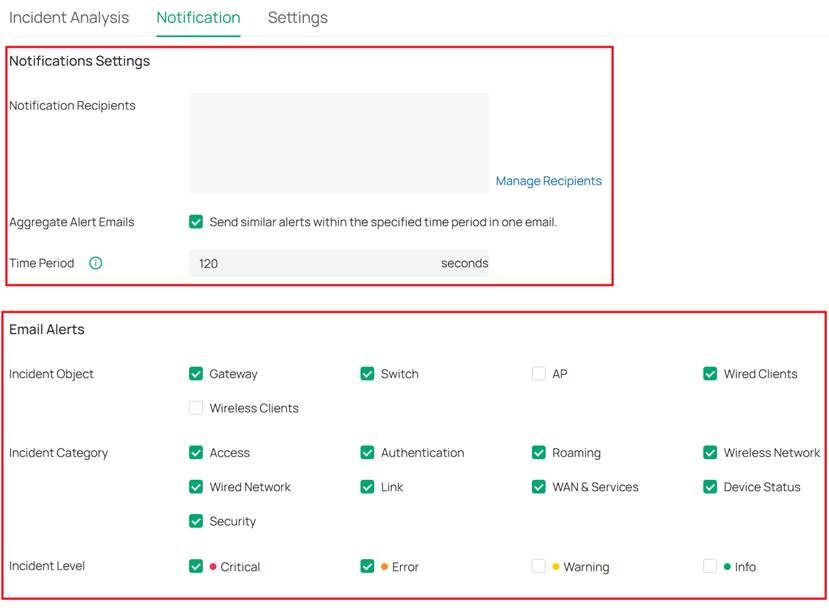
Step 1. Log in to the Controller via web browser and go to Site View > Incidents > Notification.
Select which incidents trigger email notifications. You can filter notifications by Incident Object (Gateway, Switch, AP, Wired Clients, Wireless Clients), Incident Category (such as Access, Authentication, Roaming, Device Status, and Security), and Incident Level (Critical, Error, Warning, or Info). Only incidents matching the selected criteria will be included in notification emails.
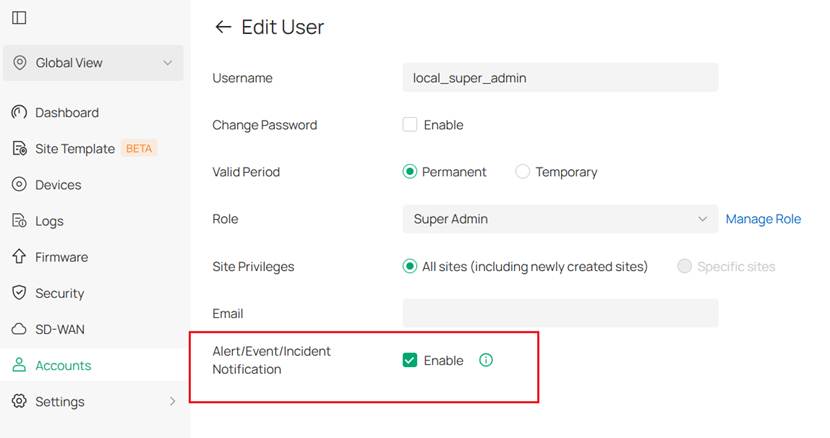
Step 2. Go to Global > Account > User > Alert/Event/Incident Notification and enable notifications for the required users.
This configuration applies only to Controller users. The recipients must be added to the Controller and have valid TP-Link ID email addresses. If you want to send notifications to other email addresses that are not configured as Controller users or do not have TP-Link ID accounts, configure an Email Server and specify the desired recipients there.
Understand incident categories and coverage
This section provides an overview of the types of issues covered under each incident category. It helps users quickly understand how Incidents detection in Controller v6.3 spans across APs, switches, gateways, and clients, and what kinds of problems are monitored within each category.
|
Category |
Coverage |
|
Access |
Covers client access and IP allocation issues, including DHCP server conflicts, interface IP conflicts, client connection failures or slow connections, and failures or delays in obtaining IP addresses, as well as device capacity limits. |
|
Authentication |
Covers authentication-related issues such as 802.1X authentication failures or delays, and Client Portal authentication failures or slow responses when interacting with devices or external services. |
|
Roaming |
Focuses on wireless client roaming experience, including frequent ping-pong roaming, sticky clients that cannot roam properly, and so on. |
|
Wireless Network |
Monitors wireless radio conditions, including high channel utilization, high noise floor, high interference, low client SNR, and abnormal client negotiation rates. |
|
Wired Network |
Covers switching and forwarding issues such as illegal multicast packets, ARP/routing/multicast table overflows, high port utilization, traffic imbalance in LAG groups, packet loss, and storm control events. |
|
Link |
Focuses on link stability and Layer 2 connectivity issues, including loop detection, ports receiving error packets, ports frequently going up and down, LACP failures, and frequent MAC migrations. |
|
WAN & Services |
Covers WAN performance and service availability, including DDNS abnormalities, high bandwidth utilization, high latency, and VPN connection failures. |
|
Device Status |
Reflects device health, including AP batch offline events, high CPU utilization (AP/gateway/switch), PoE power limit exceedance, and abnormal optical module parameters. |
|
Security |
Covers security-related risks, including unauthorized login attempts on gateways or switches and detection of attack packets on WAN or LAN ports. |
Analyze incident root causes and maintenance suggestions
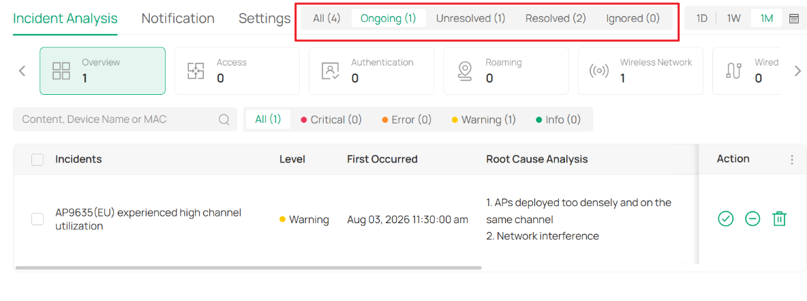
Step 1. Log in to the Controller via a web browser and go to Site View Settings > Incidents > Incident Analysis > Overview. This page lists all detected abnormal incidents, including incident details, affected device, first occurrence time, and severity level.
Note: V6.3 uses an incident aggregation counting mechanism, whereas Controller Pro uses event count–based statistics. In V6.3, repeated occurrences of the same event type on the same device are aggregated and counted as a single incident.
For example, if a device reports the "Loop Detected" event 100 times, the Unresolved count in Controller Pro would be 100. In V6.3, these repeated events are aggregated into a single incident, so the Unresolved count would be 1.
You can update the incident status to Solve or Ignore, delete records in the Action column, and search by content, device name, or MAC address.
Incidents can be filtered by severity level, category, and status.
Status definitions:
• Ongoing: The issue is currently active and detected by the Controller; it will be marked as Resolved once no longer detected.
• Unresolved: The incident has occurred but has not yet been addressed.
• Resolved: The issue is no longer active and has been automatically or manually marked as solved.
• Ignored: The incident has been dismissed and requires no further action.
Step 2. Click an incident entry and the Incident Detail page will pop up on the right.
Incident Detail: Here presents an overview of the incident category, content, and start time.
Incident analysis: Here records the detailed time and possible cause of each incident. You can modify the incident status singly or in batches on this page.
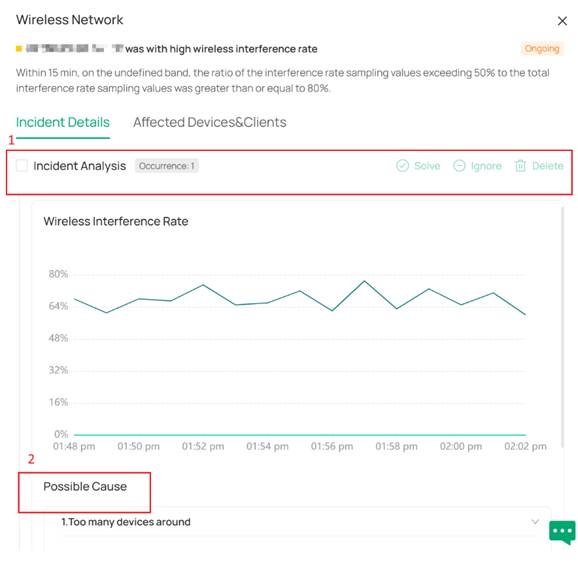
Alternative formats for abnormal incidents and root cause visualization:
• Curves: Show changes in key parameters such as CPU, memory, and RSSI.
• Timeline: Present event status over time, such as device online/offline states or port UP/DOWN events.
• List: Display detailed information for specific scenarios. For example, high AP traffic shows a top client traffic list, while high switch load shows protocol usage distribution over time.
• Protocol Replay: Show step-by-step authentication results when a client fails authentication.
• PoE Status: Display PoE power usage per switch port and total PoE consumption.
For ongoing incidents, the detail page also shows incident duration and the most recent data from the latest reporting cycle.
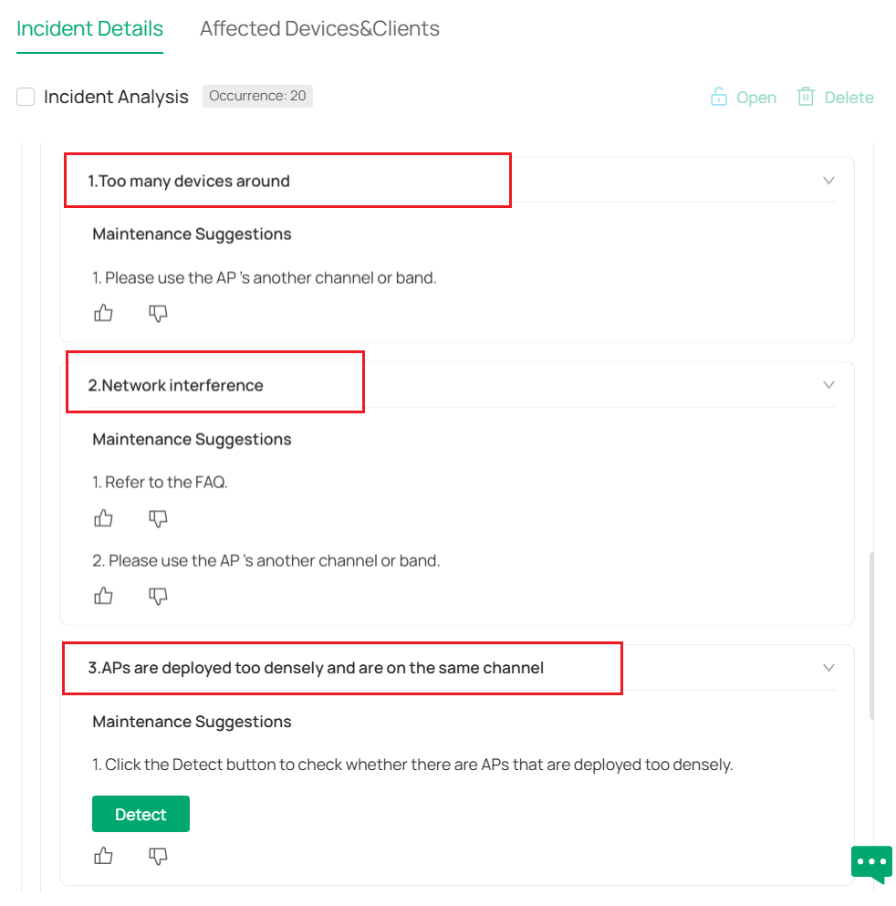
Step 3. Expand Incident Analysis to view more detailed information about the incident, including the description, inferred cause, and maintenance suggestions. Click the dropdown icon on the right to view the maintenance suggestions. The content of anomalies and root causes can be presented in various forms.
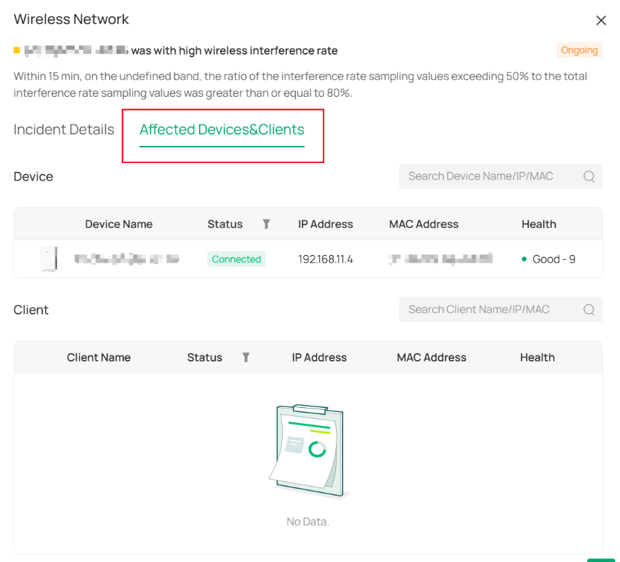
Step 4. Navigate to the Affected Devices & Clients page to view the devices and clients impacted by this incident. From here, you can directly click on a device to access its detailed configuration page.
Conclusion
By completing the steps above, you can successfully configure and use the Intelligent Incident Detection feature on Omada Controller v6.3 and above to monitor, analyze, and troubleshoot network issues.
To learn more about each function and configuration, please visit Support Home to download or check the manual for your product.
QA
Q1: How can I restore the default configuration after customizing the settings?
A1: You can click the Reset button to restore the default configuration. Remember to click Confirm to save the configuration.
Q2: Why do I receive alert emails before the specified time period?
A2: When the number of incidents reaches 100, alert emails will be sent immediately even before the time period you set.
Q3: Why can’t I see certain types of anomalies?
A3: This may be due to disabled detection switches, unsupported device models, incompatible firmware versions, or no anomalies occurring within the selected time range.
