


本文介紹 DPI 的運作原理以及如何透過 Omada 控制器在 Omada 路由器上設定此功能。
- Omada 控制器(軟體控制器/硬體控制器/雲端控制器)
- Omada 路由器(支援 DPI)
深度封包檢測(DPI)可以幫助使用者辨識、分析和控制網路中的應用層流量。DPI 引擎包含最新的應用程式辨識簽名,用於追蹤哪些應用程式使用最多的頻寬。使用者可以透過 DPI 更好的管理和分配網路流量。啟用 DPI 後,設備會將轉發的流量傳送至本地 DPI 引擎進行分析,進而判斷並辨識流量的類型。當Log Switch或log流量啟用時,設備將收集並儲存流量的分析結果。
啟用此功能將減少用戶端連線數量,OC200/220 的最大用戶端數量為 500;OC300 為 5,000;OC400 則為 10,000
獨立模式
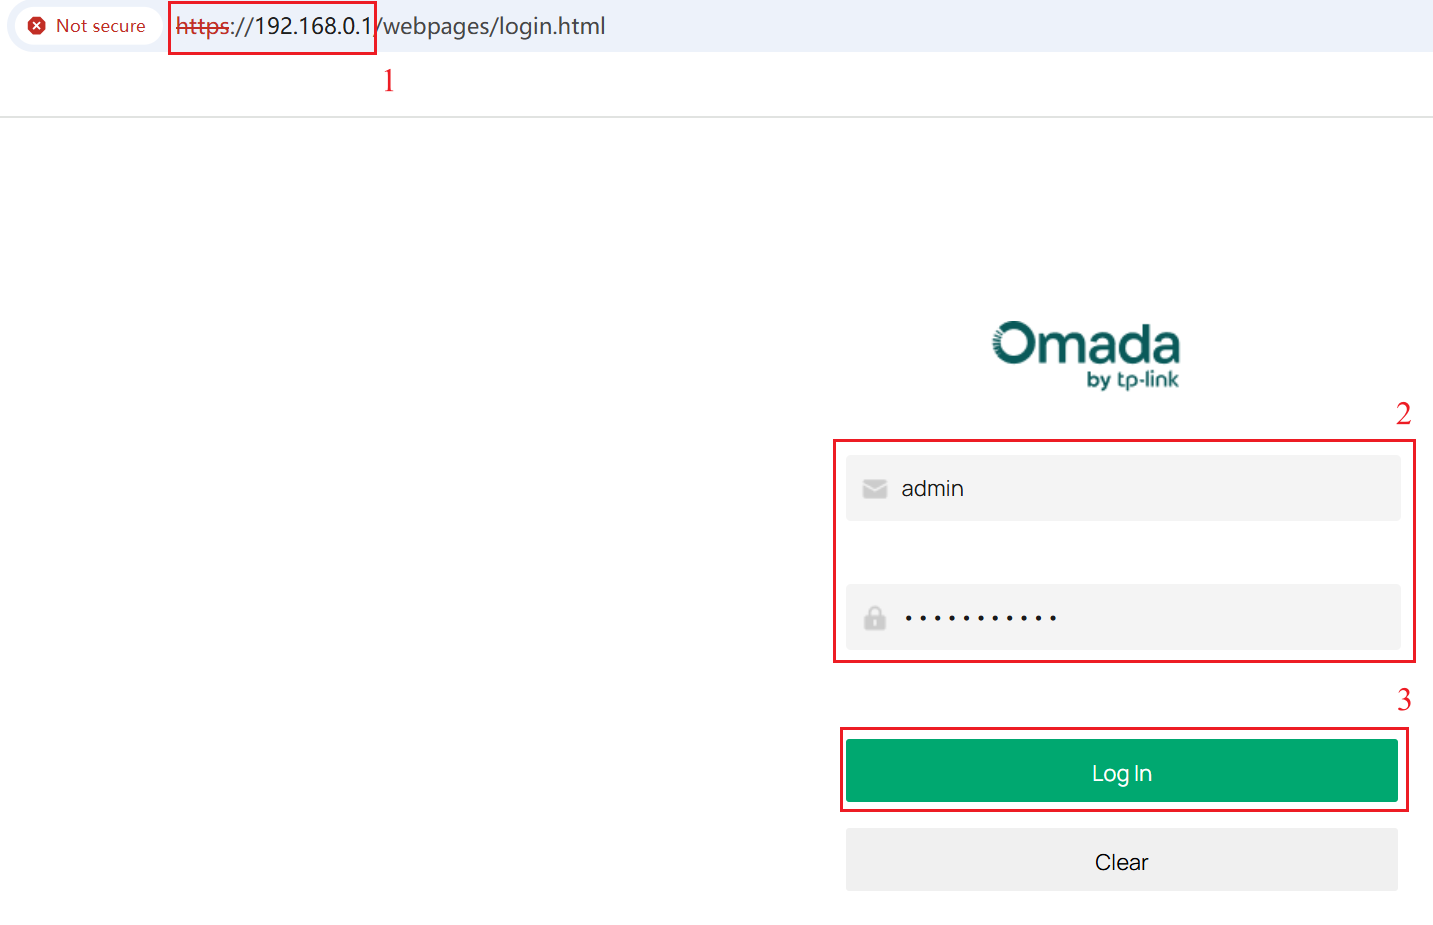
步驟 1、輸入路由器 IP(預設為192.168.0.1)、帳號及密碼後點擊Log in 進到介面
步驟 2、 前往 Firewall > Application Control > DPI Settings. 啟用 Deep Packet Inspection 和 Log Switch,點擊 Save儲存設定。
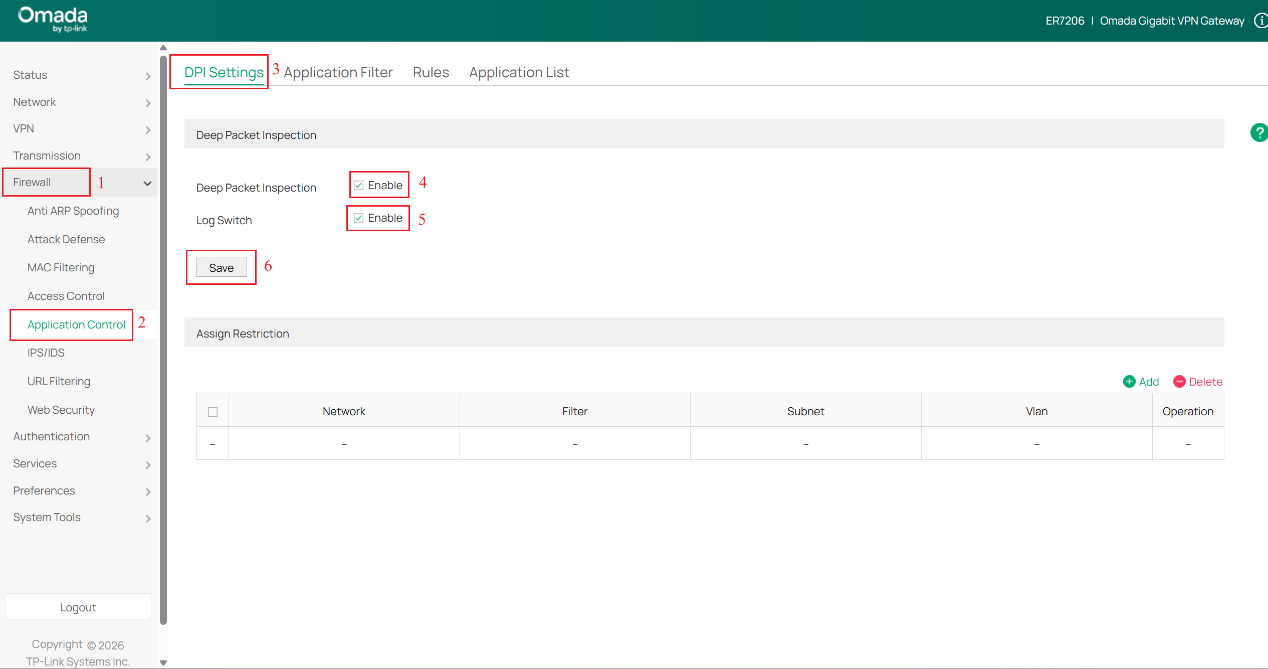
留意: 啟用 DPI 只會啟動偵測功能,如要針對特定應用程式進行流量阻擋或控管,需進行額外的設定。 “Log Switch” 決定是否紀錄DPI應用程式的統計日誌。
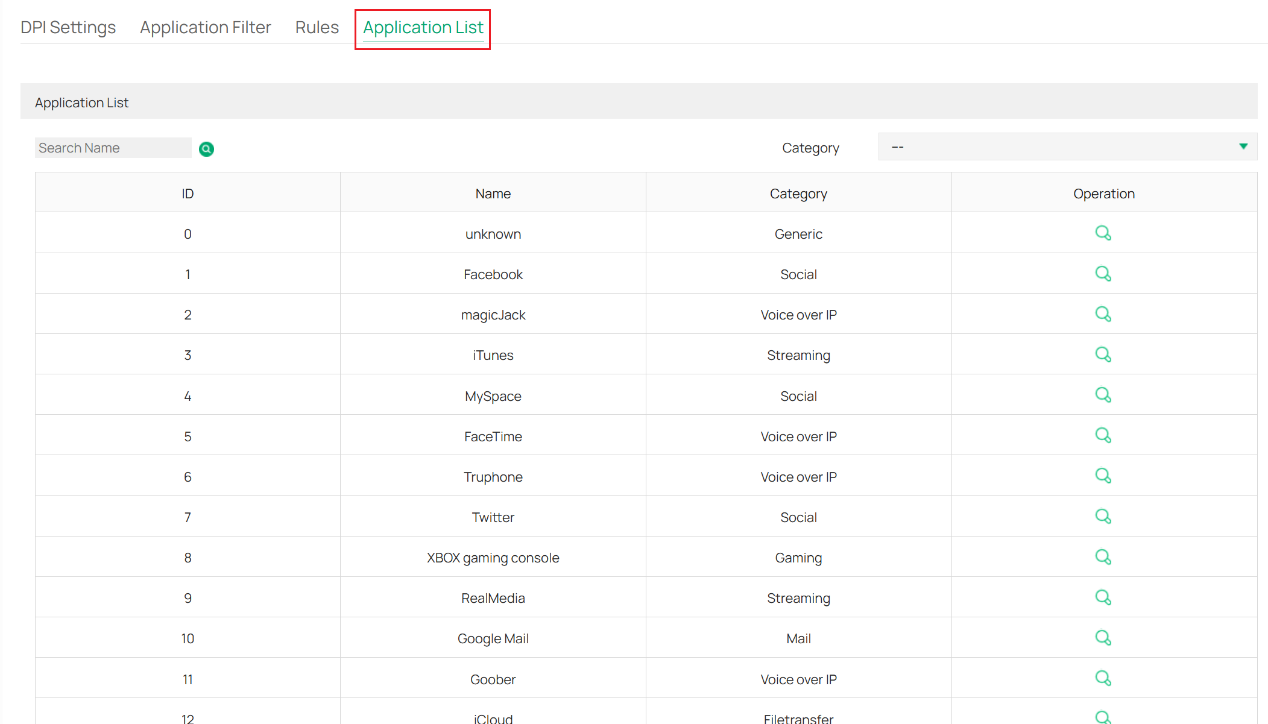
Application List 介面可查詢所有支援的應用程式,如下。
步驟 3、 前往 Rules 頁面, 點擊 +Add 建立 New Rule, 填入 Rules name 選擇 Schedule,點擊 Select 按鈕,在 Select Apps 視窗,依需求選擇要新增到規則的應用程式。完成選擇後,點擊視窗內的OK後,再點擊頁面中的OK 儲存規則。
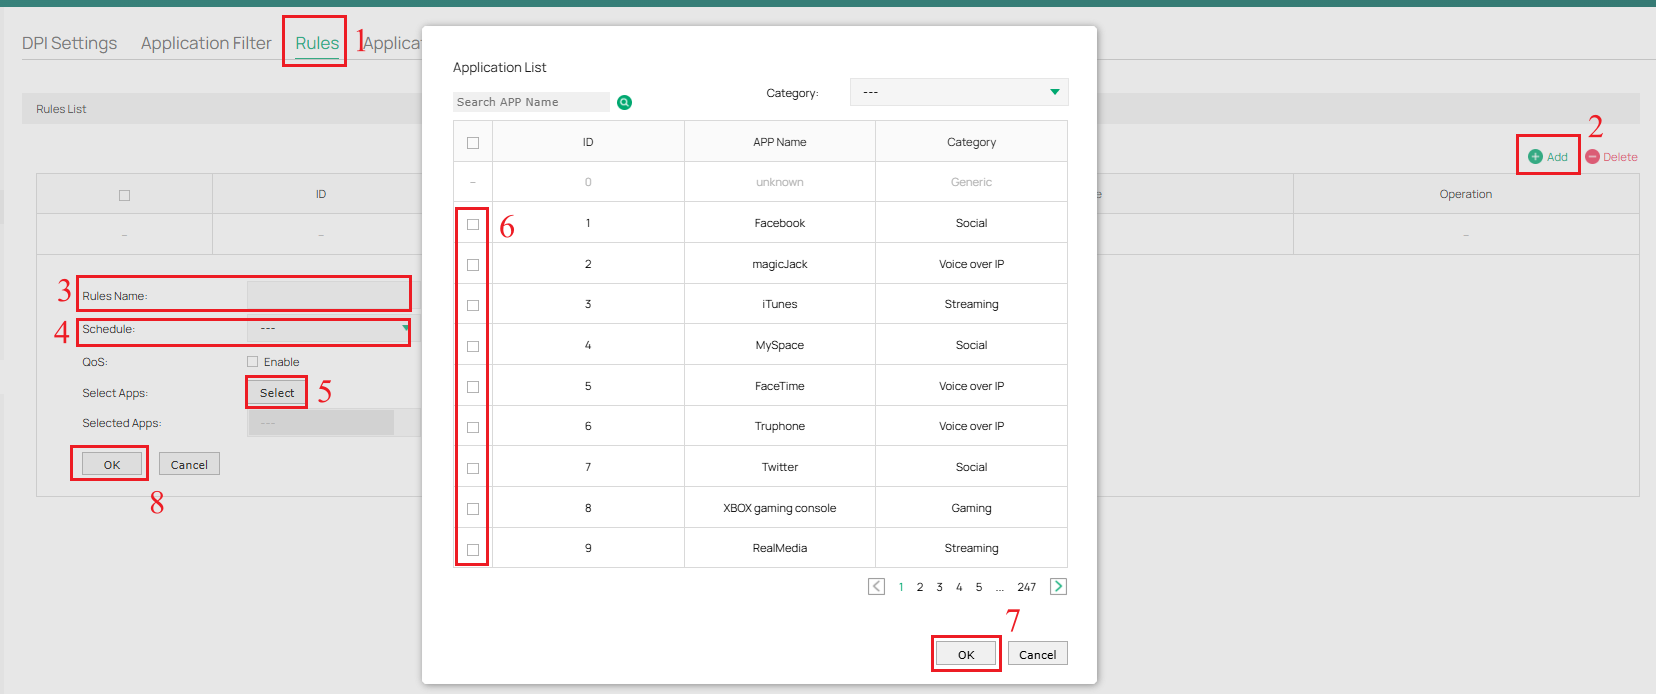
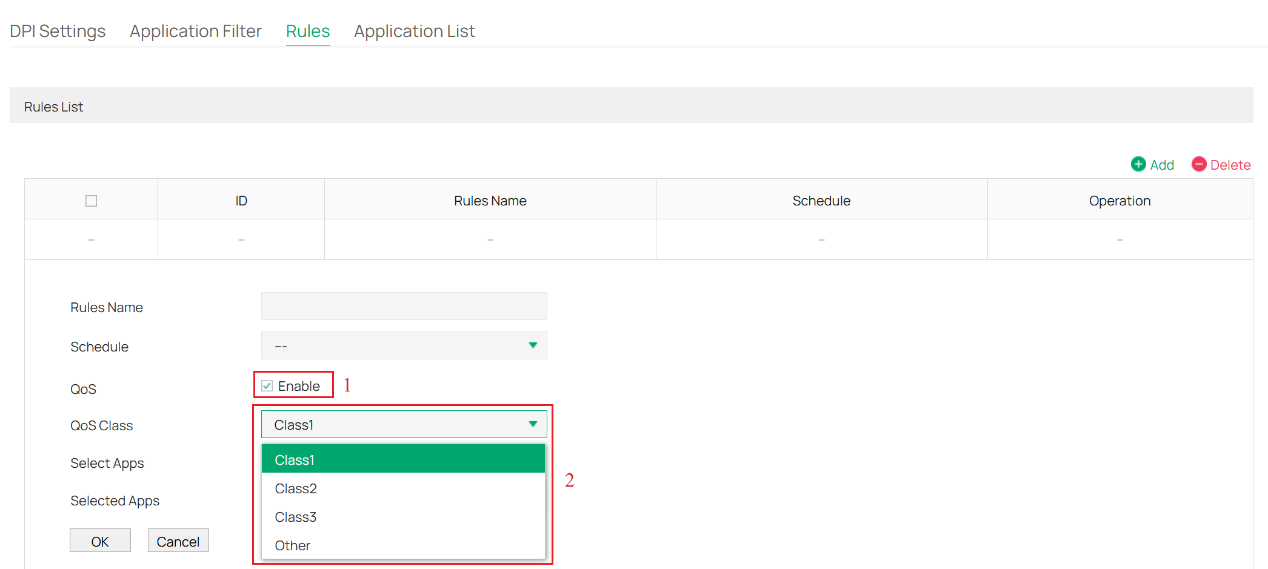
注意: schedule是指為該規則設定的生效時段,如有另外啟用QoS,則需選擇QoS Class; 規則中的應用程式將會被加入相對應的QoS class,以限制傳輸速率。
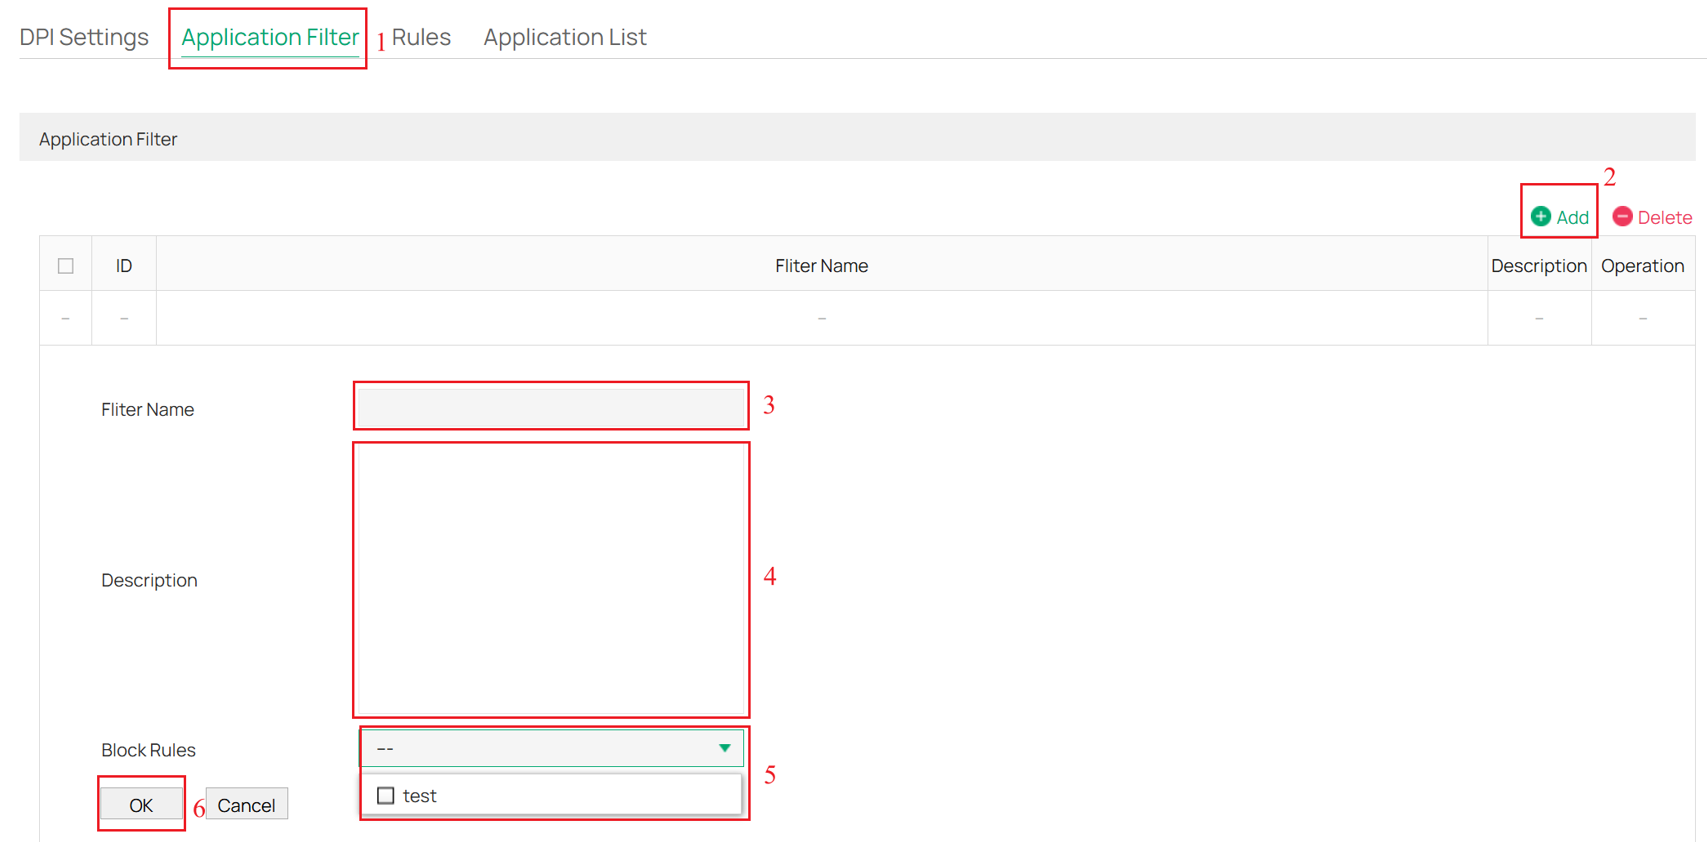
步驟 4、 點擊 Application Filter,選擇 +Add 按鈕以建立New Application Filter。填入相關欄位資訊,於Block Rules帶入步驟3內建立的規則,點擊 OK 後儲存。
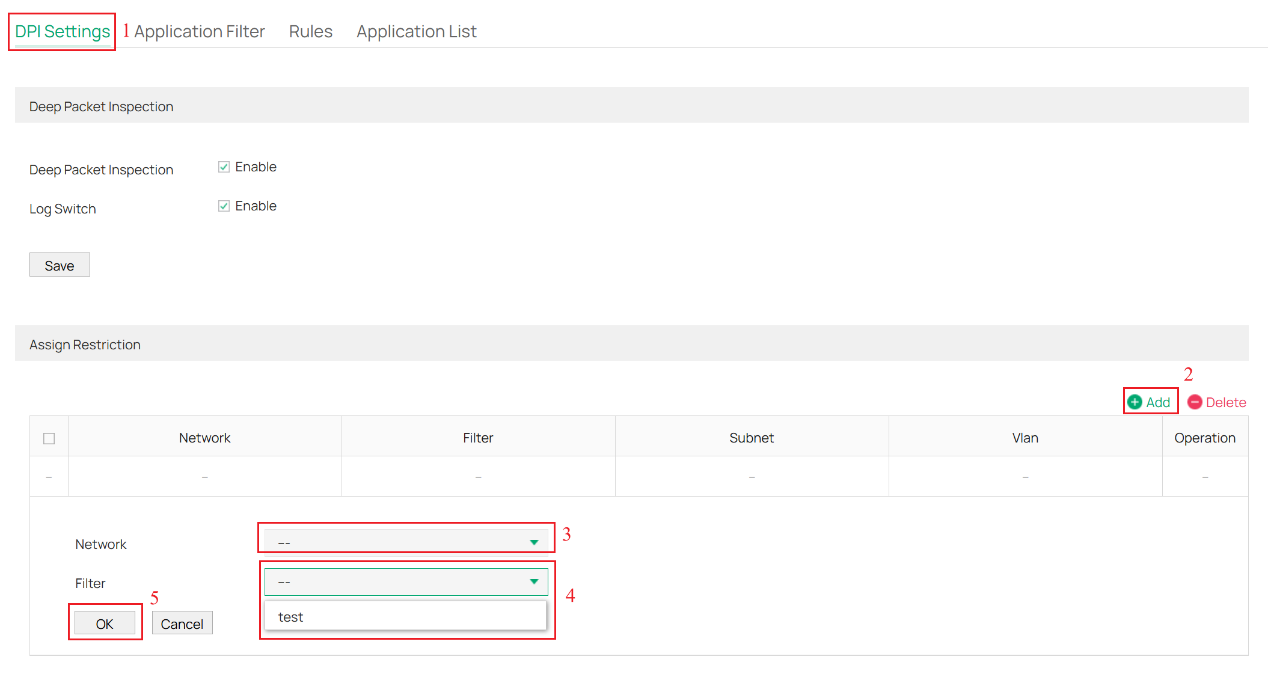
步驟 5、 前往 DPI Settings頁面,點擊 +Add 建立New Assign Restriction,帶入步驟4建立的資訊後點擊OK儲存設定,該策略將生效並阻擋應用程式。
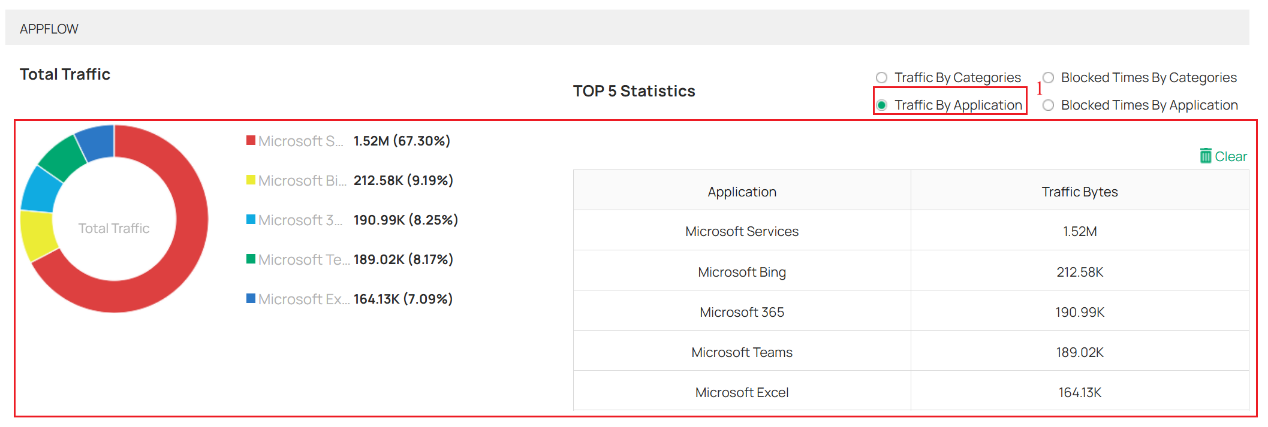
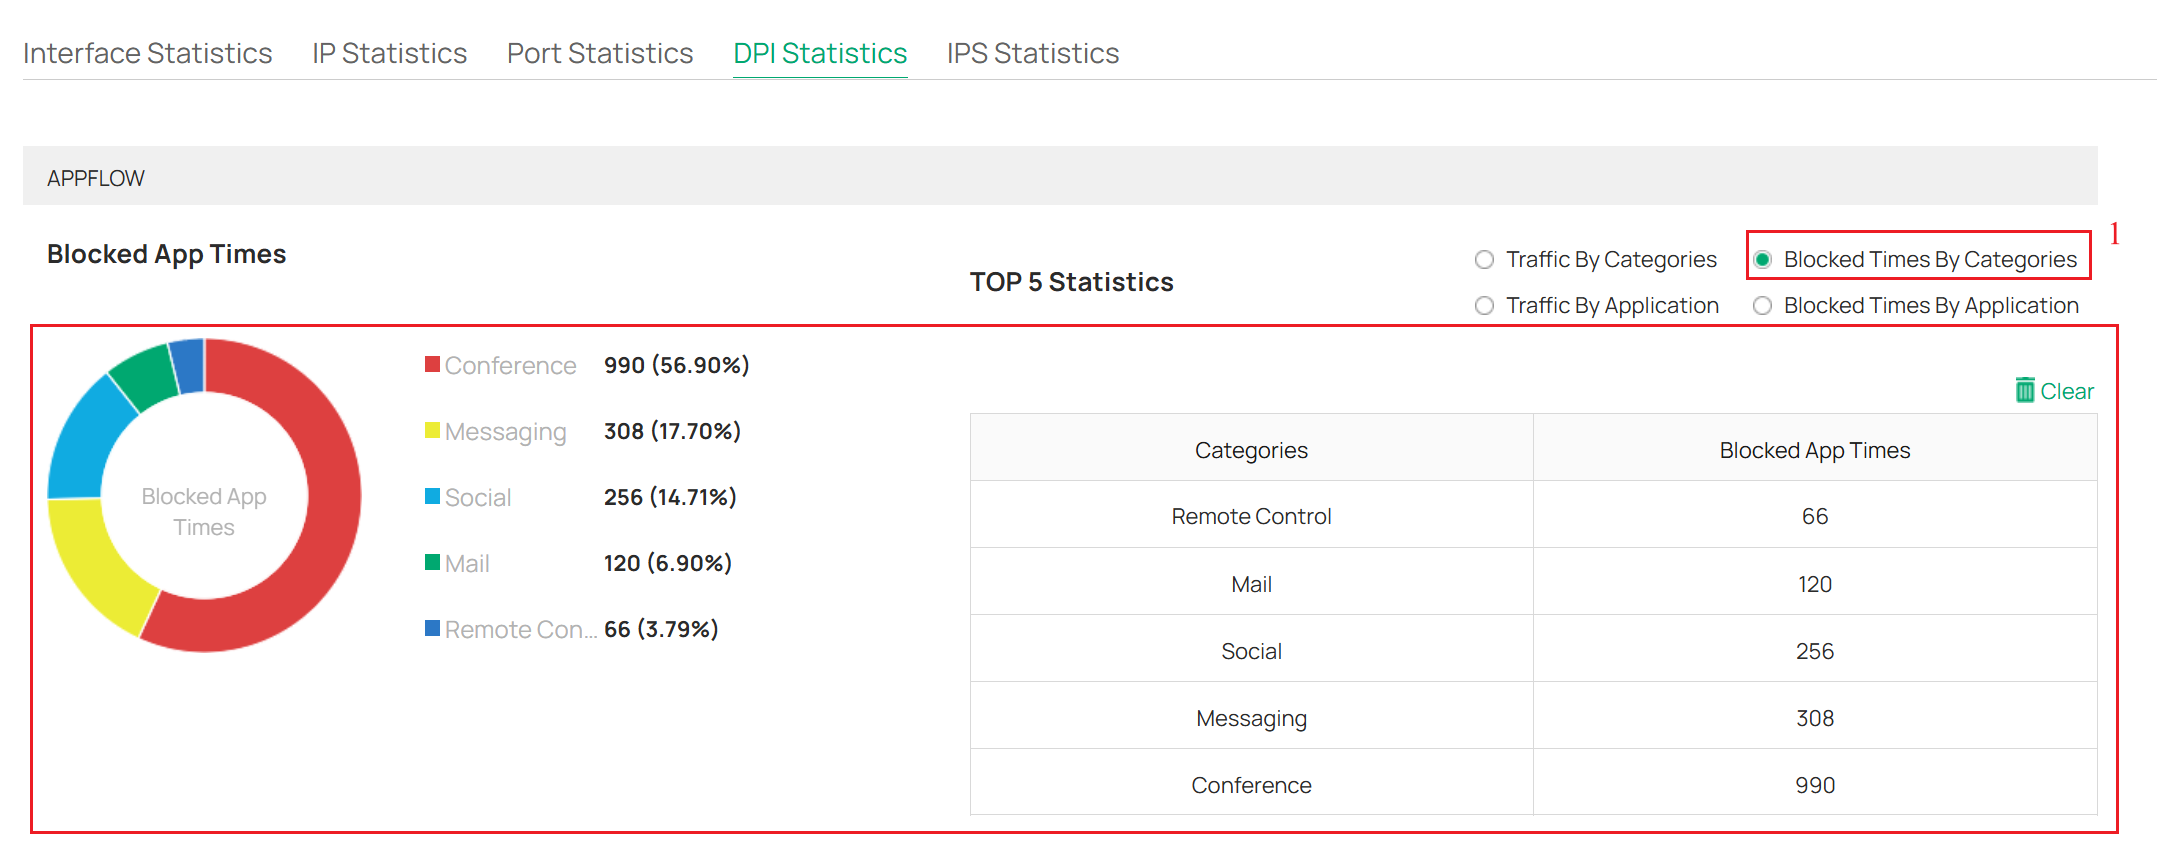
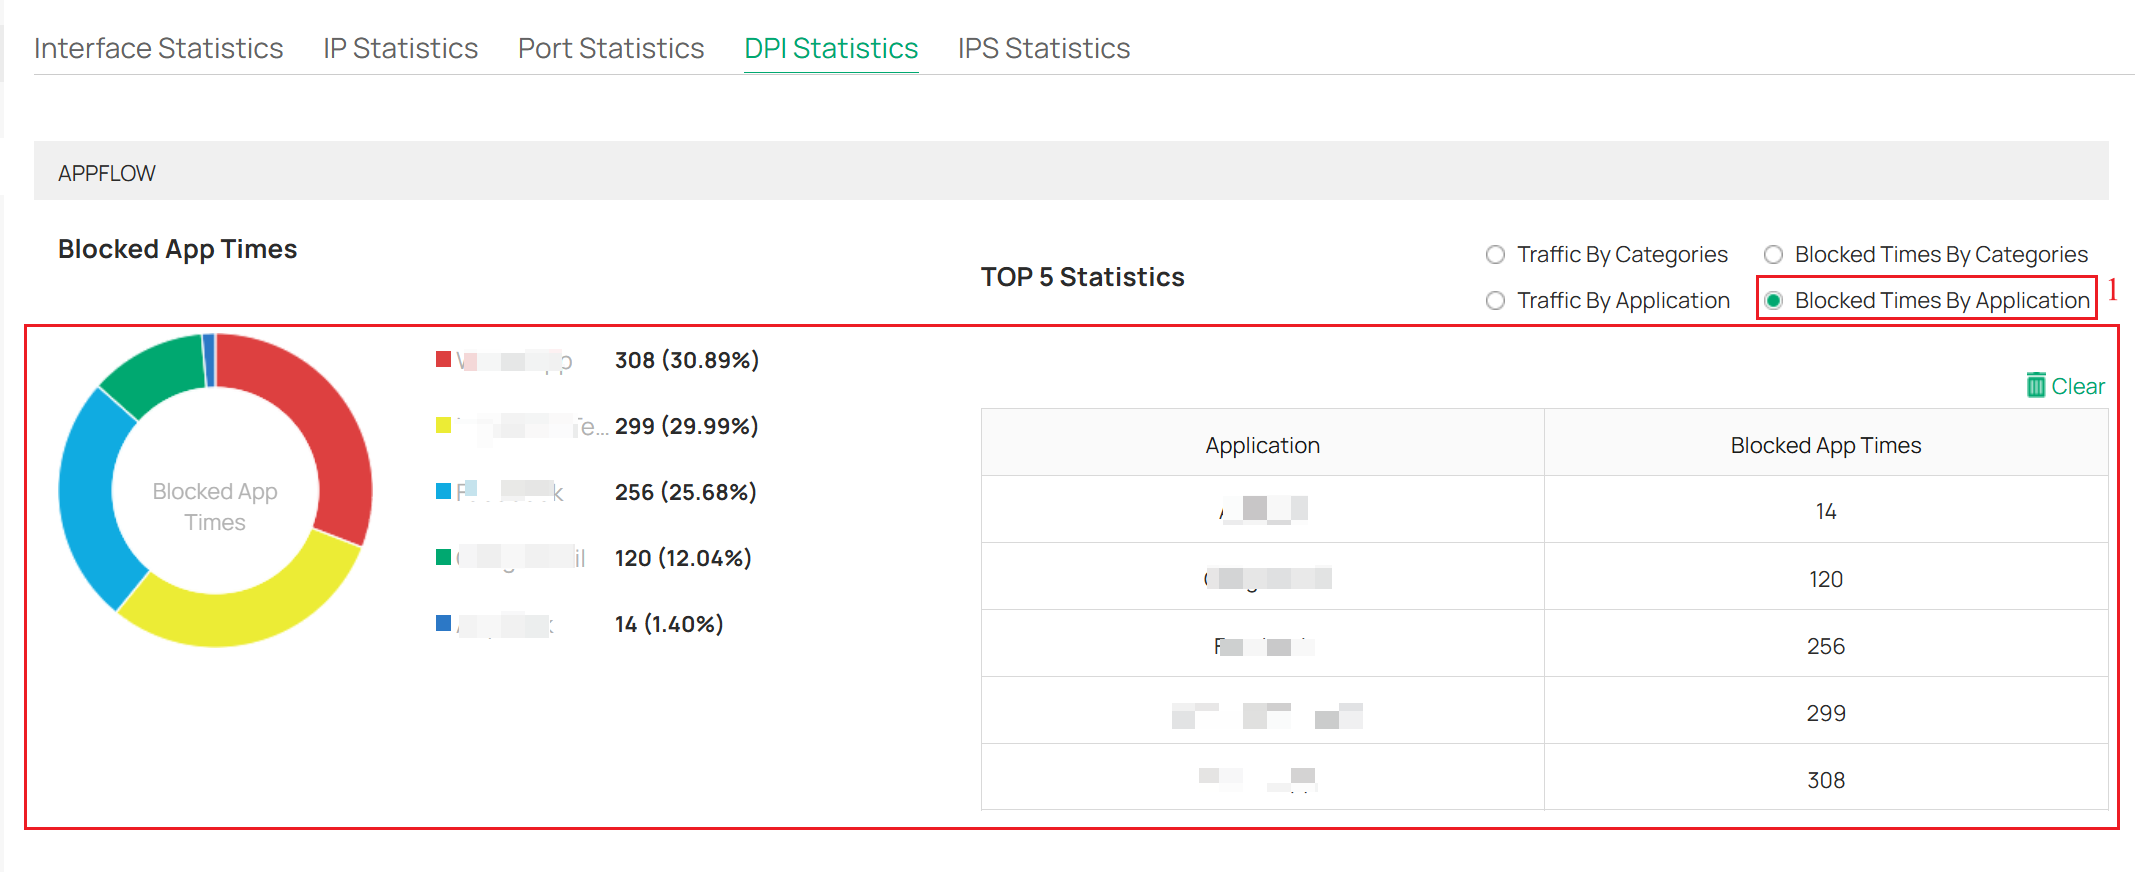
步驟 6、 若在步驟2有啟用Log Switch, 可前往Status > Traffic Statistics > DPI Statistics 查看預設下選擇不同類別的Categories
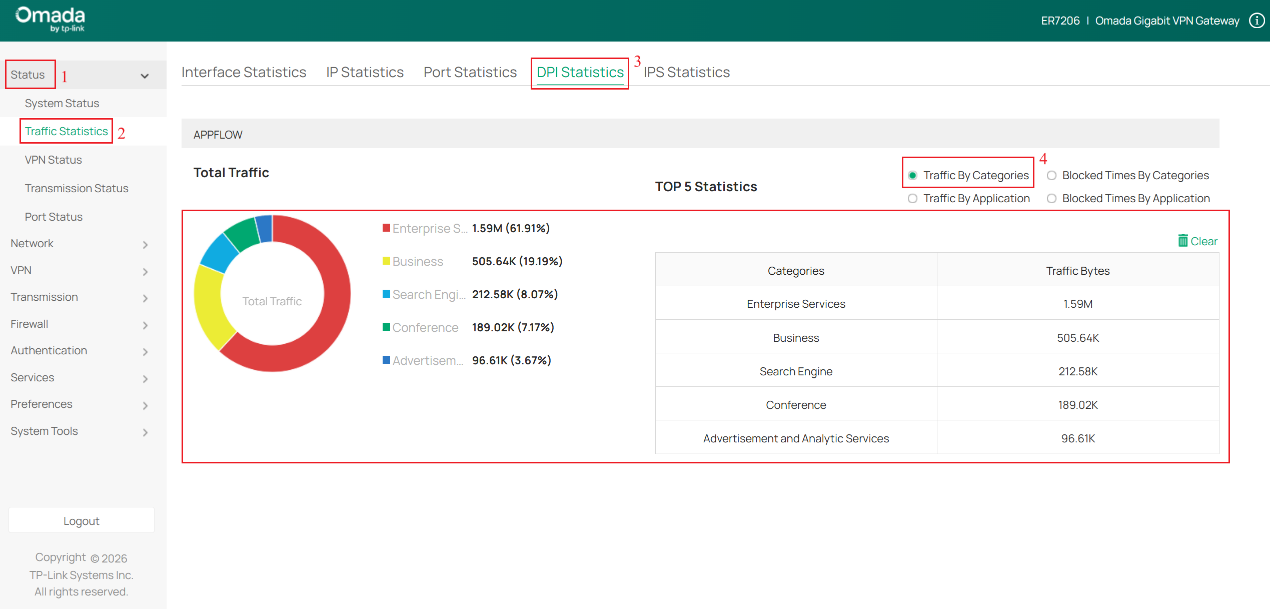
- Traffic By Application 能查看不同應用程式的流量統計資料
- 選擇Blocked Times By Categories 查看路由器依Categories統計的阻止存取嘗試次數。
- 選擇Blocked Times By Application查看路由器依Application統計的阻止存取嘗試次數
Omada Controller
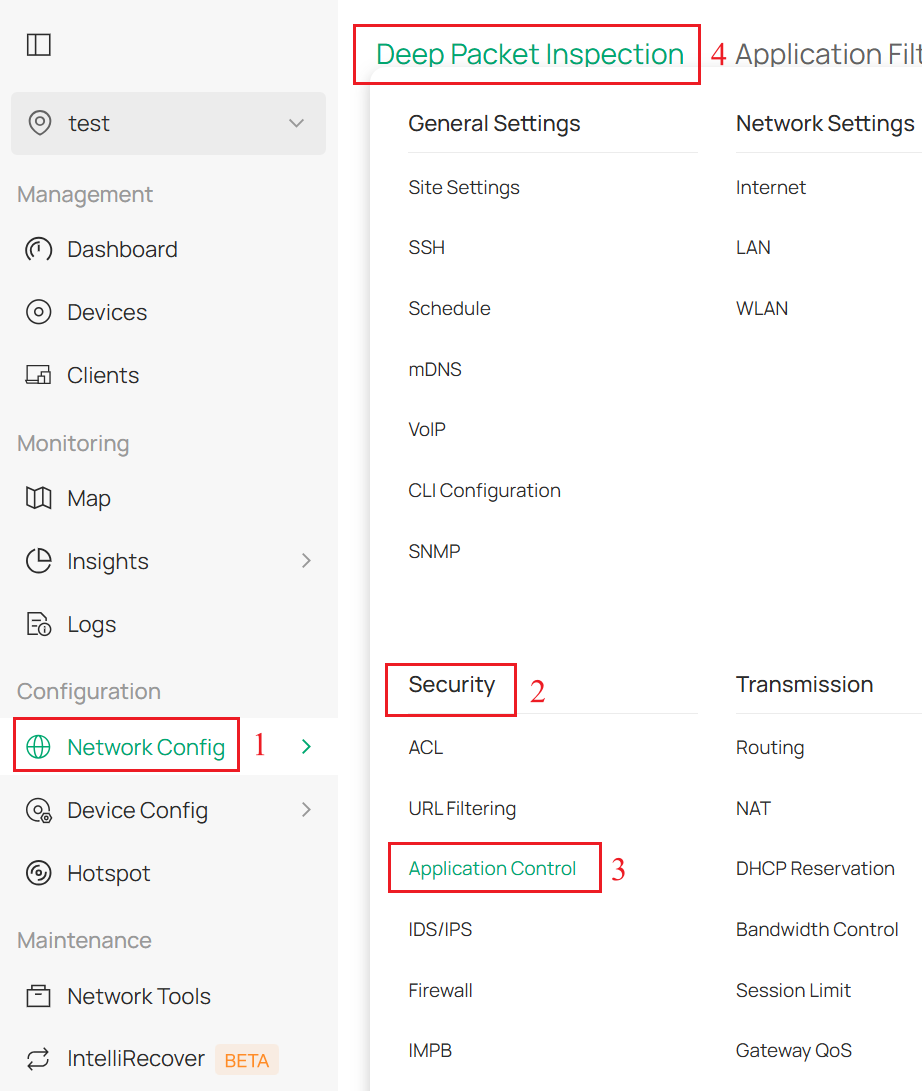
Step 1. Launch the Omada Controller and navigate to Network Config > Security > Application Control > Deep Packet Inspection.
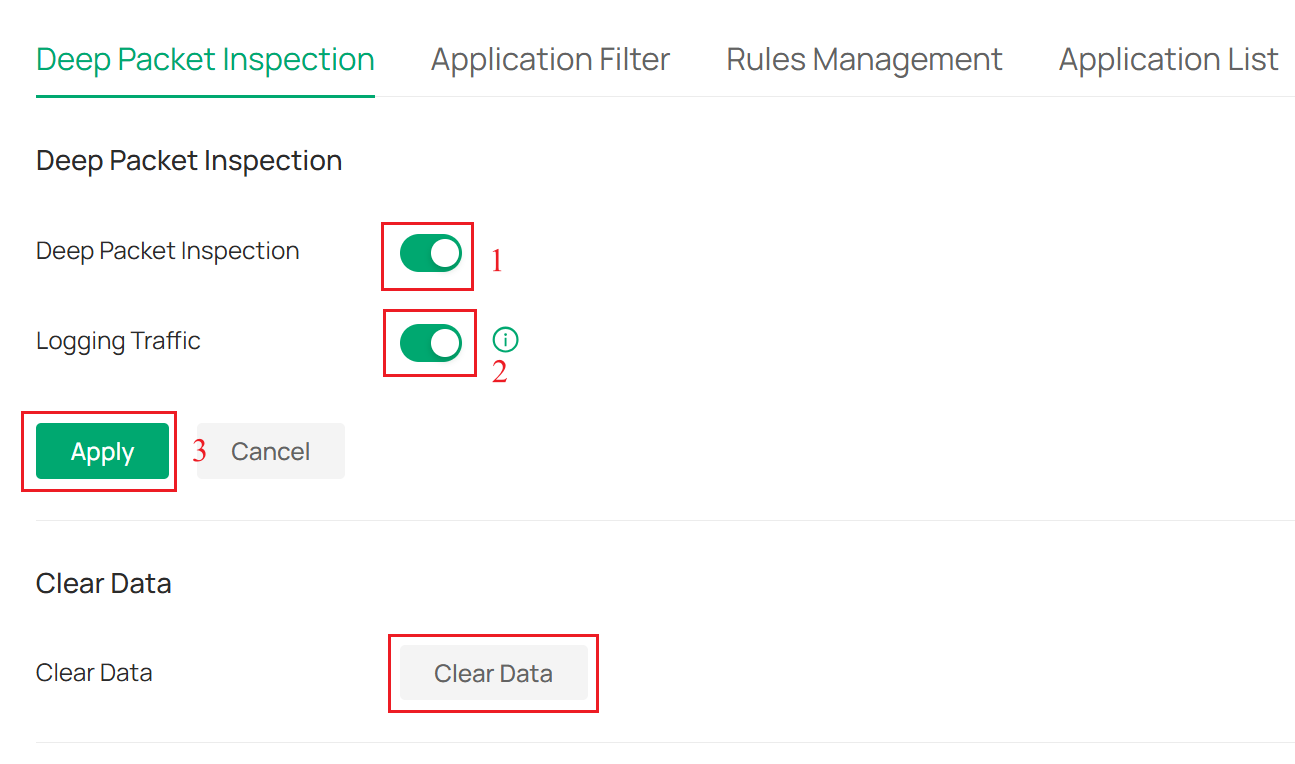
Step 2. Enable Deep Packet Inspection. Note that enabling DPI only activates the inspection capability. If you need to block or control the traffic of certain applications, further configuration is required. Enabling Logging Traffic determines whether to record the DPI application statistics logs. Click Apply to save the configuration. Clear Data allows you to select and clear the logged DPI data records.
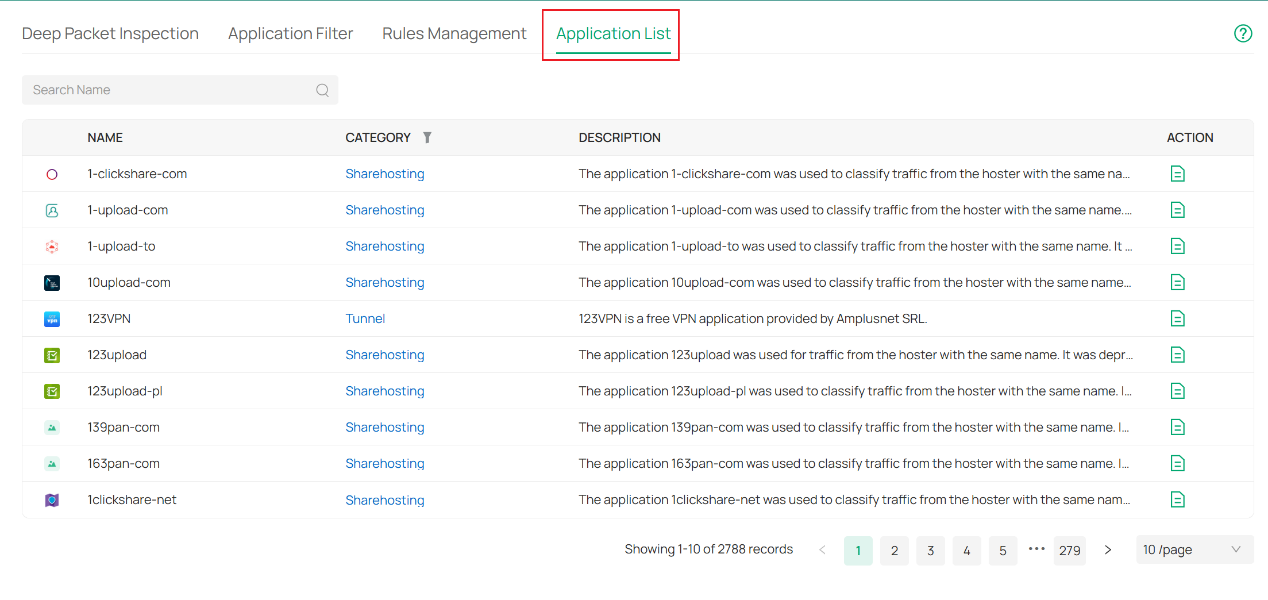
The Application List page allows you to view all the supported applications, as shown in the following figure.
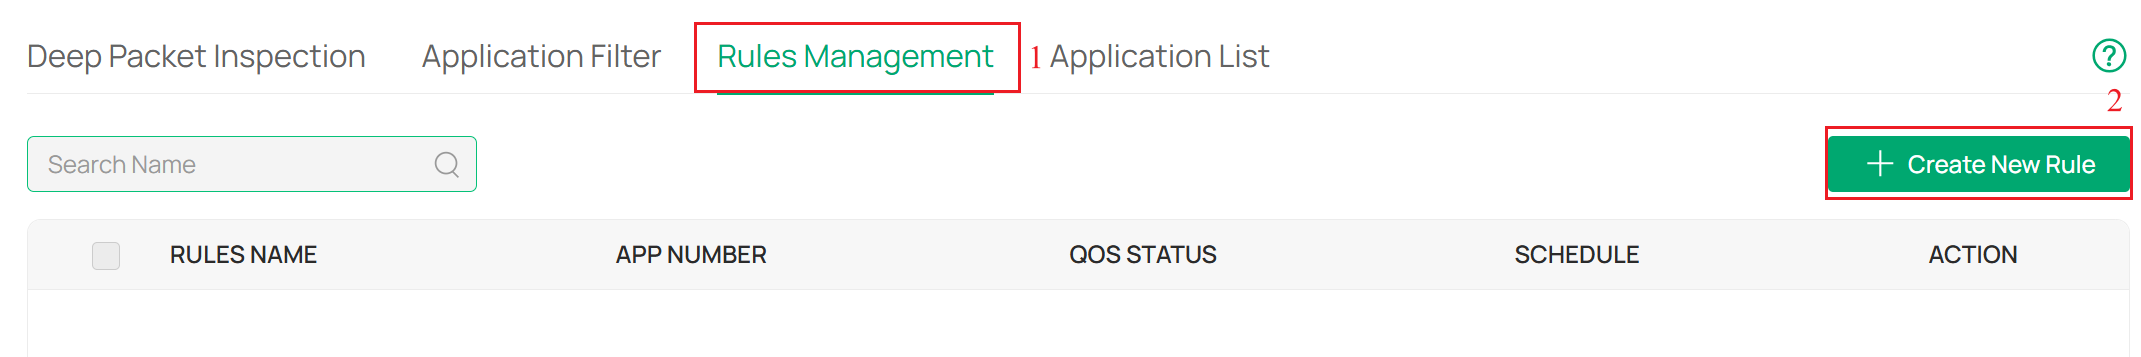
Step 3. Navigate to Rules Management, click + Create New Rule. Enter the Rules Name and specify a time range for the rule to take effect in the Schedule field. The default policy is Deny. In the Select Apps section, search for and select one or more applications to add to the rule. Click Apply to save the newly created rule.
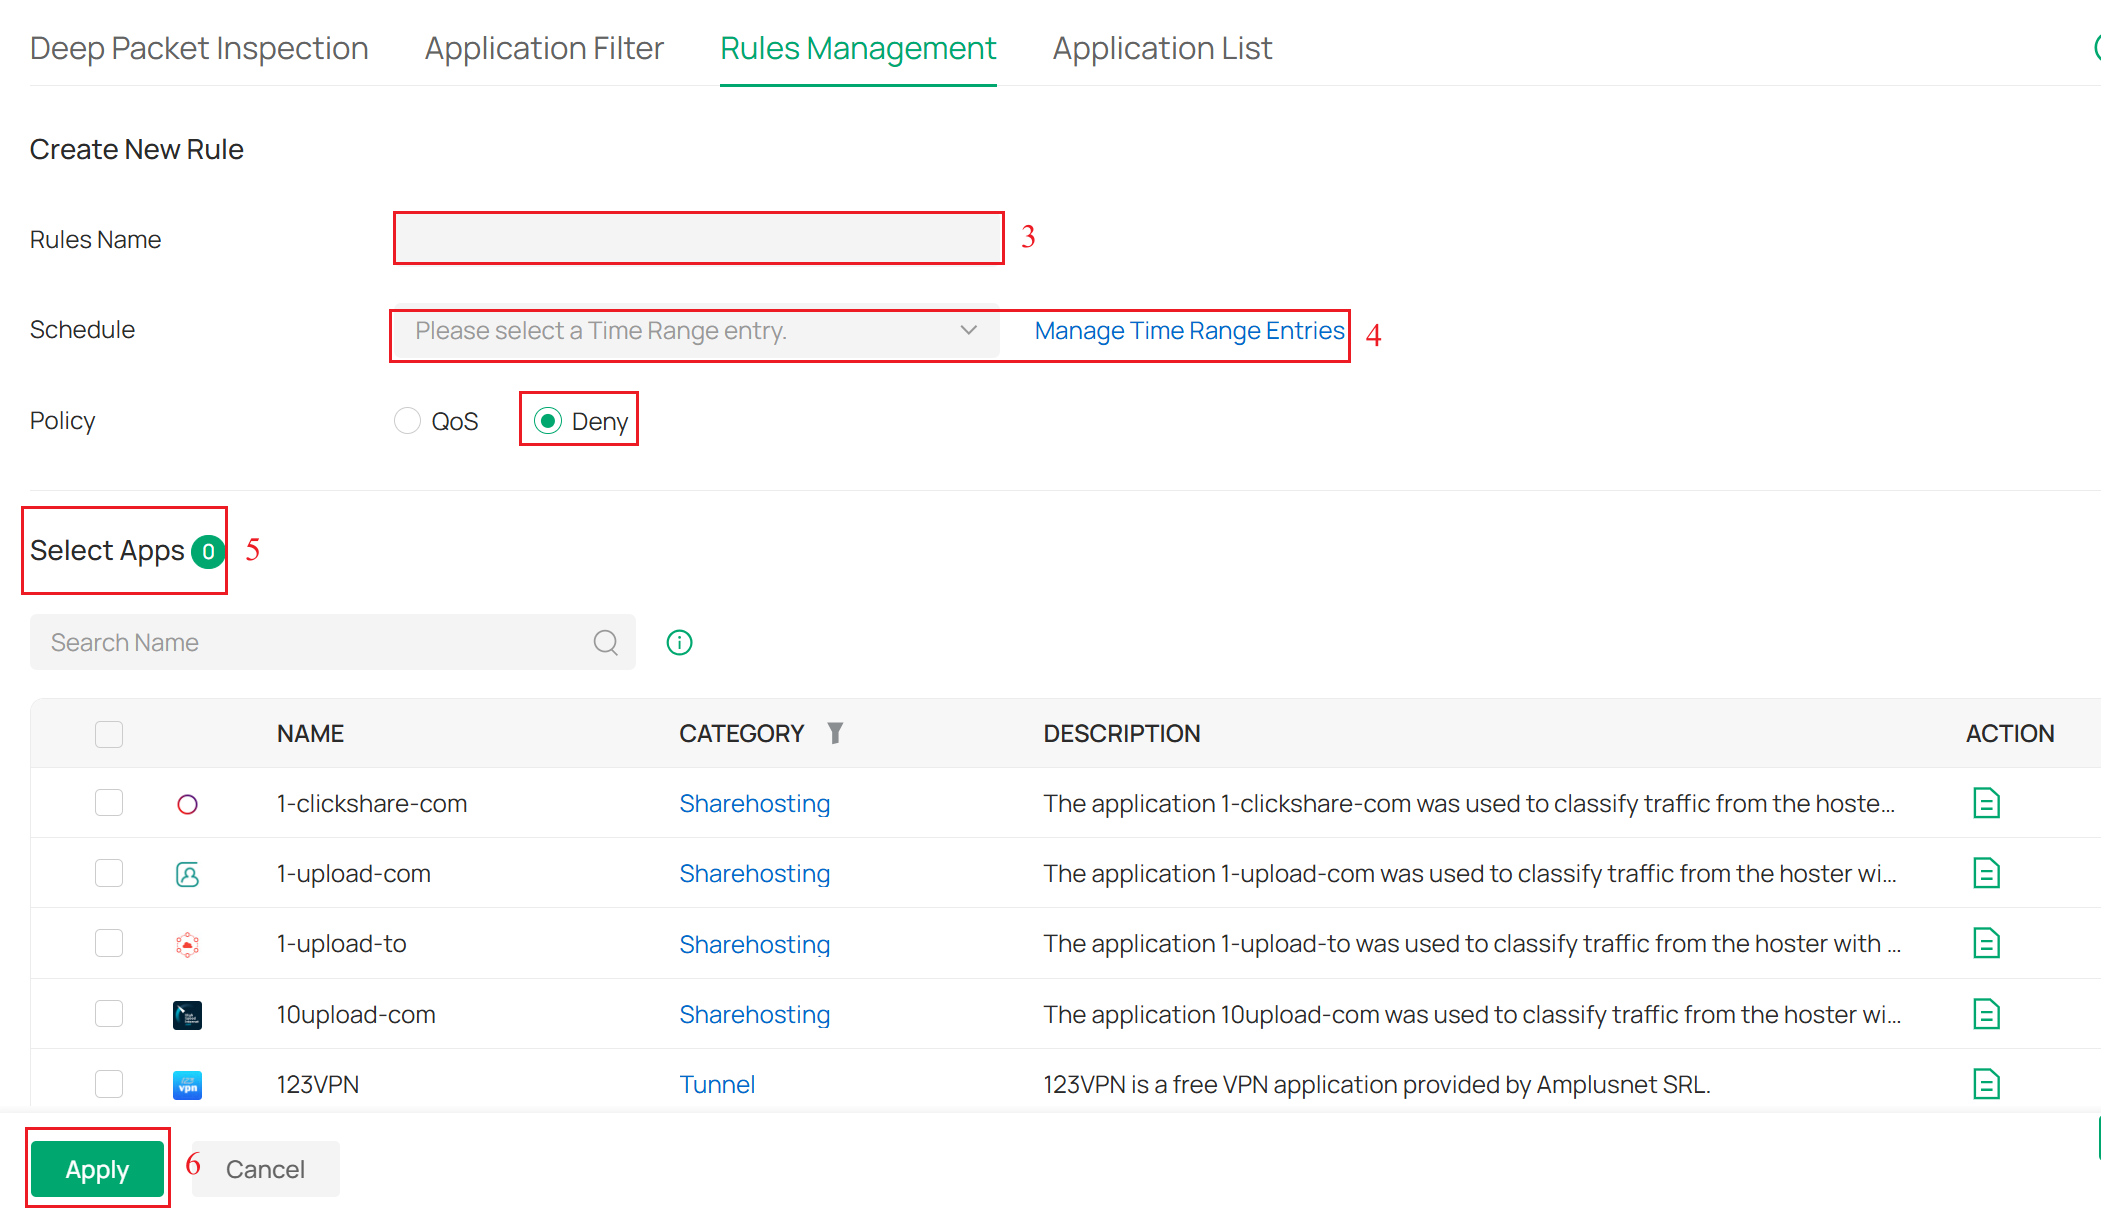
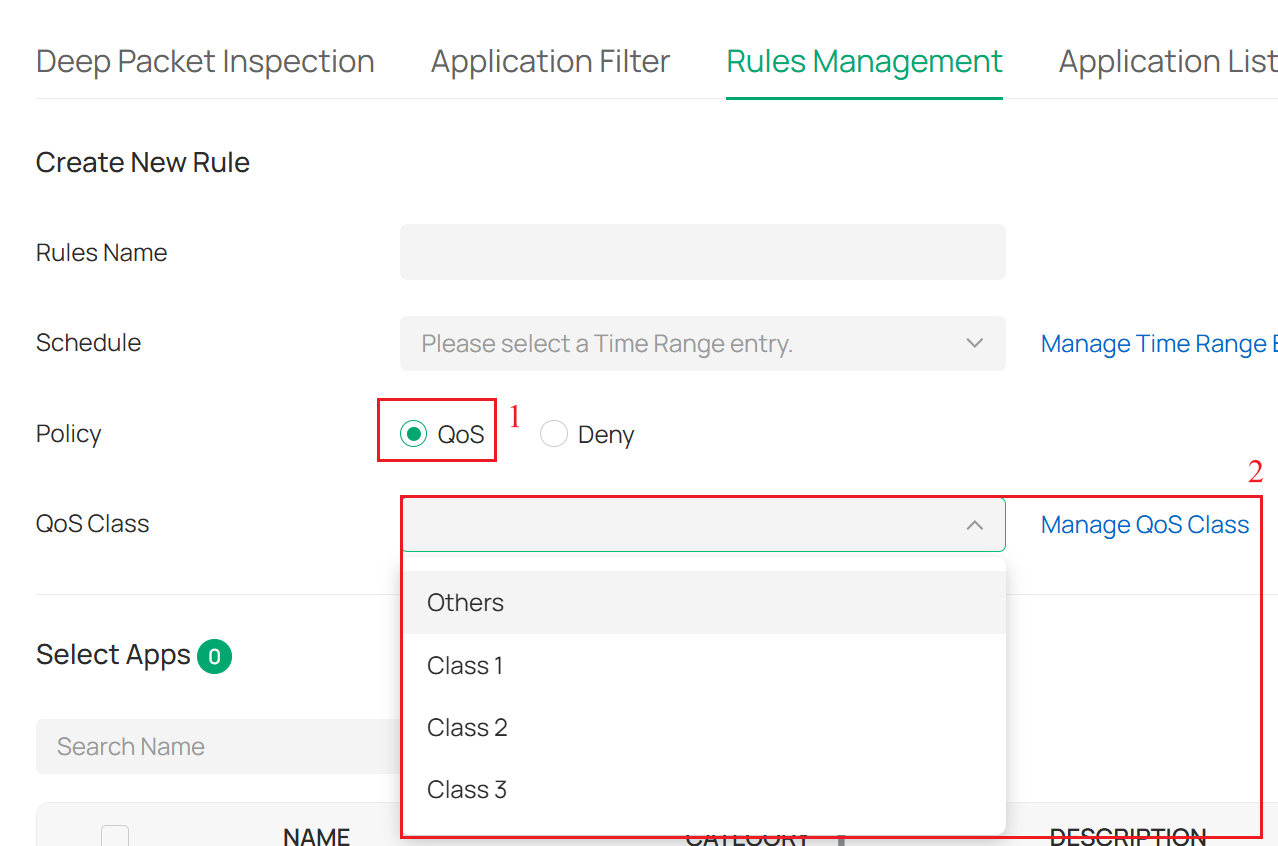
Note: If you enable QoS, you need to select the QoS Class; the applications in this rule will be added to the corresponding QoS class to limit their rate.
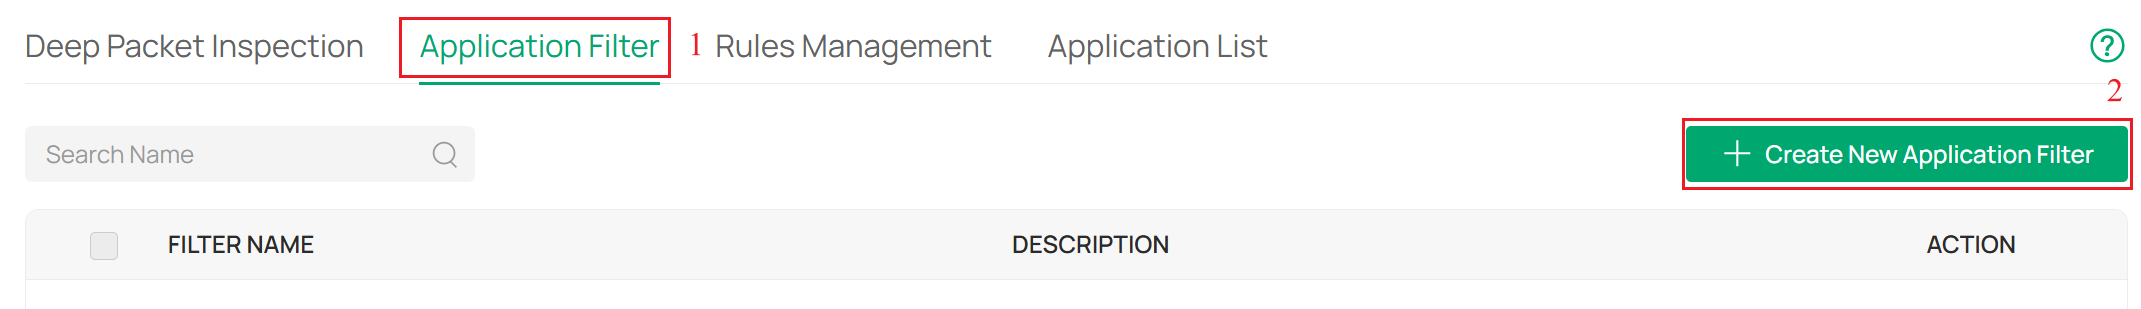
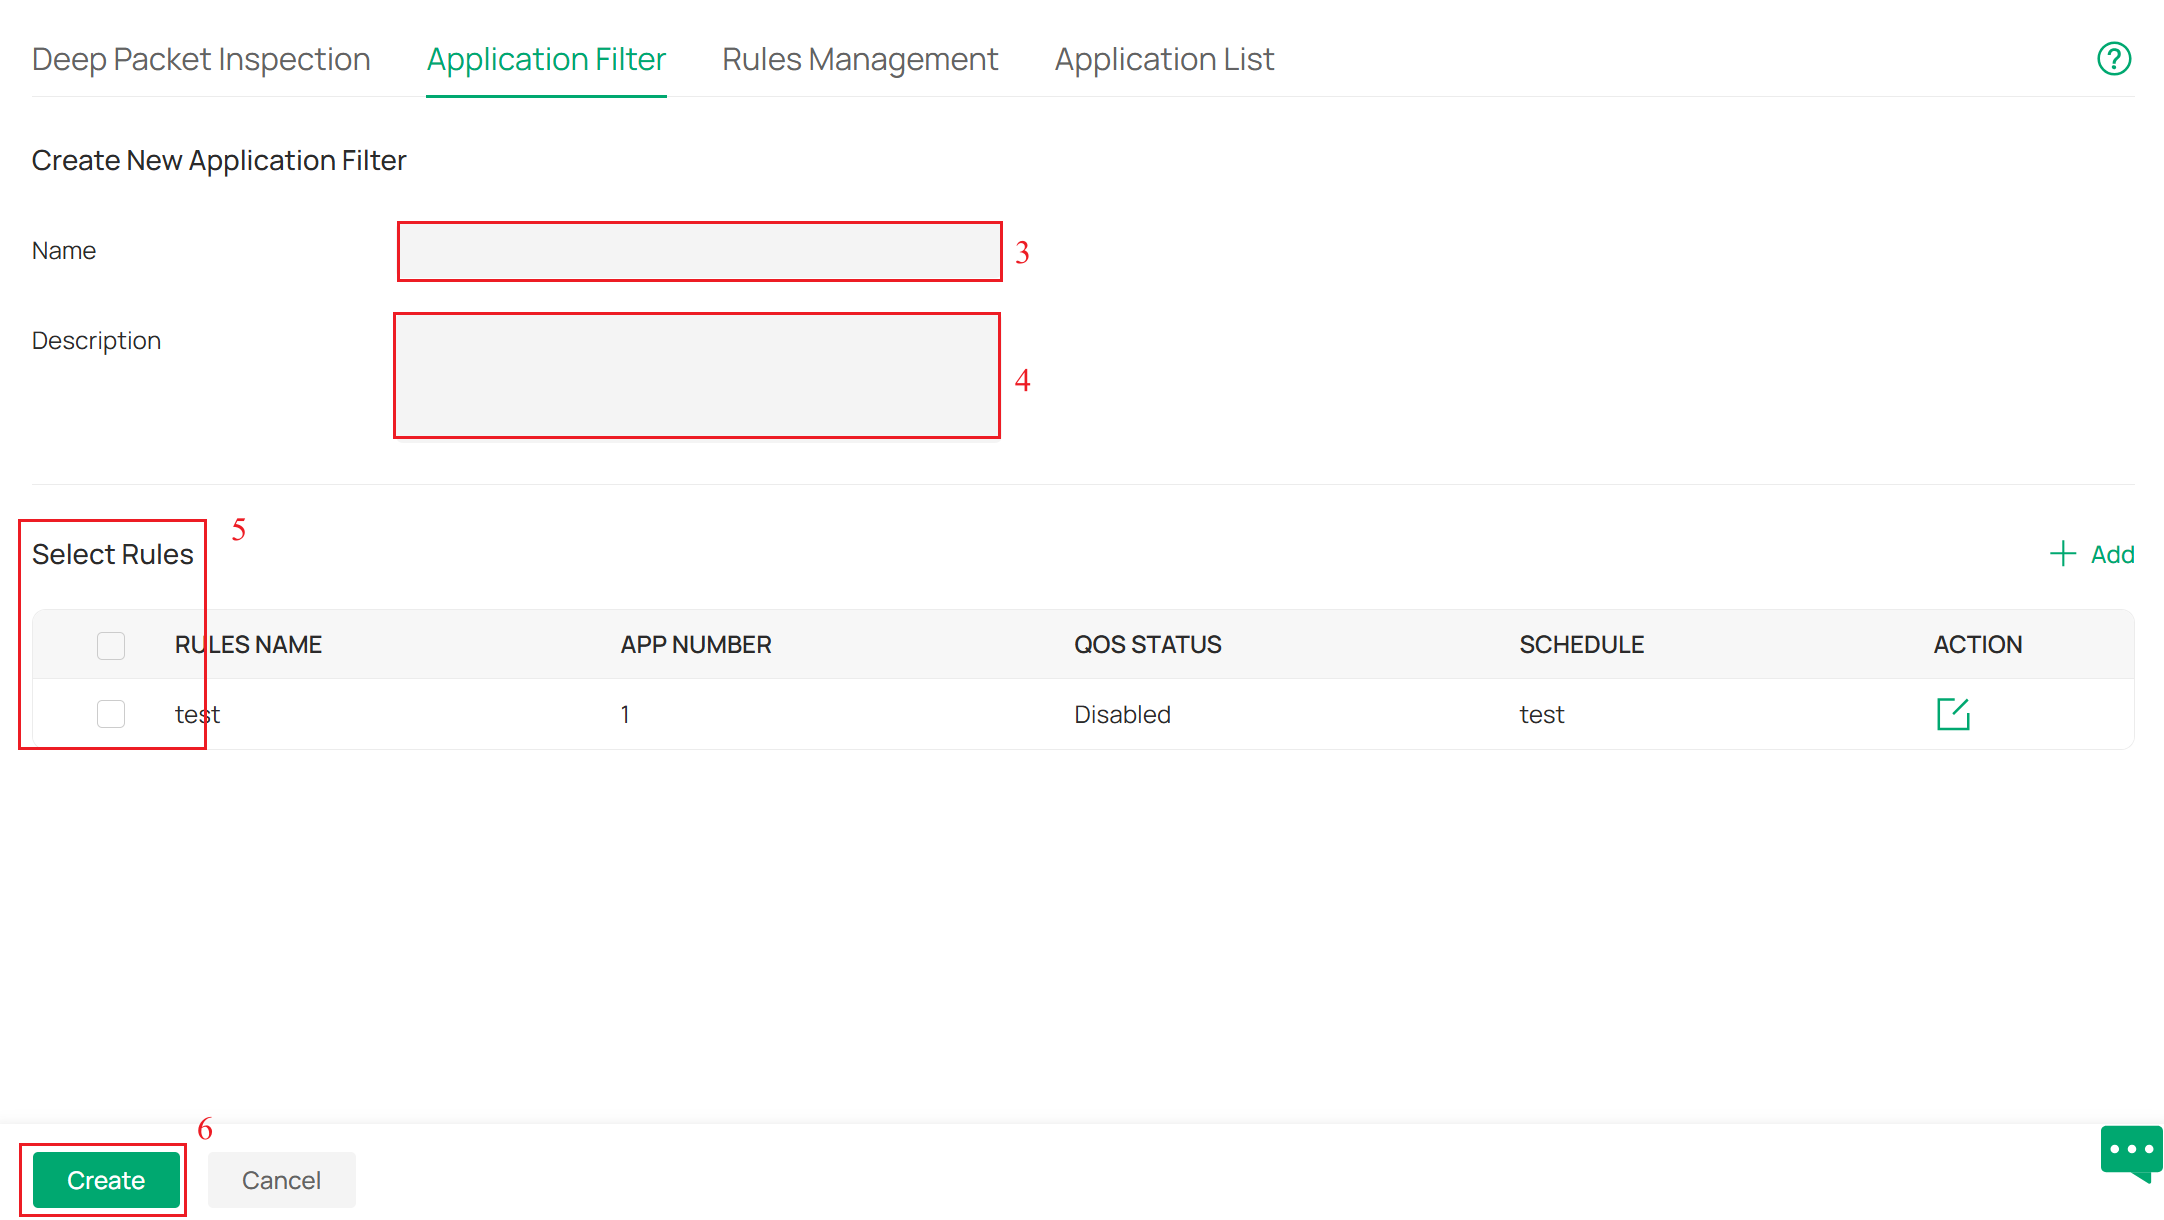
Step 4. Navigate to Application Filter, click + Create New Application Filter. Enter the Filter Name and Description of the newly added Application Filter. Select one or more rules created in Step 3. Click Create to save the newly created application filter.
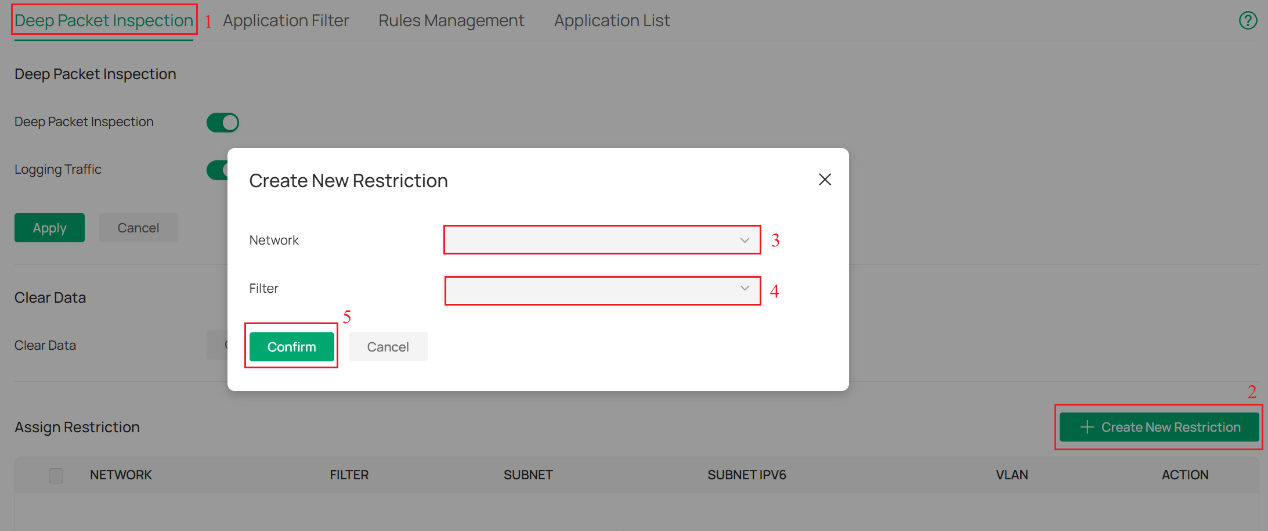
Step 5. Navigate to the Deep Packet Inspection page, click the + Create New Assign Restriction button to create an assign restriction. Select the Network and Application Filter created in Step 4. Click Confirm to save the newly created restriction. The policy will take effect and block the applications.
步驟6、 若在步驟2有啟用紀錄流量,可前往洞察 > 應用程式分析 查看 不同應用程式的流量統計數據
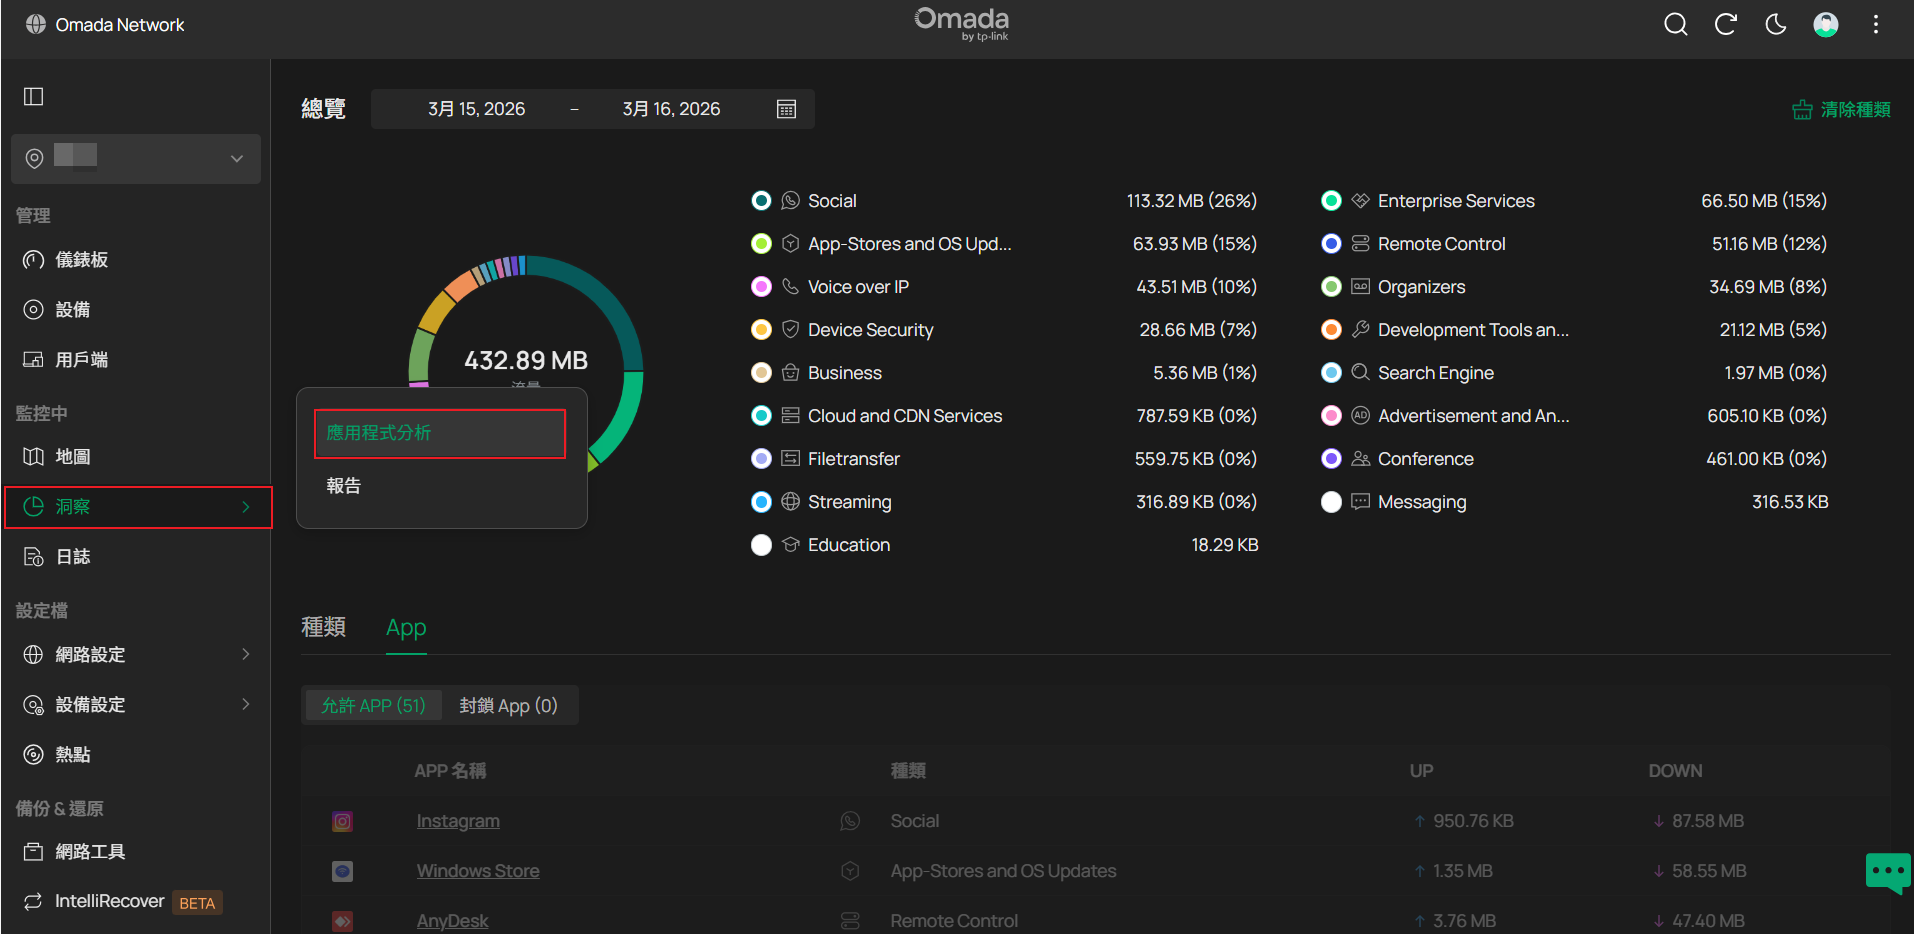
- 圓餅圖代表各類網路流量的佔比。右側資訊則顯示具體的應用程式類型及其比例。
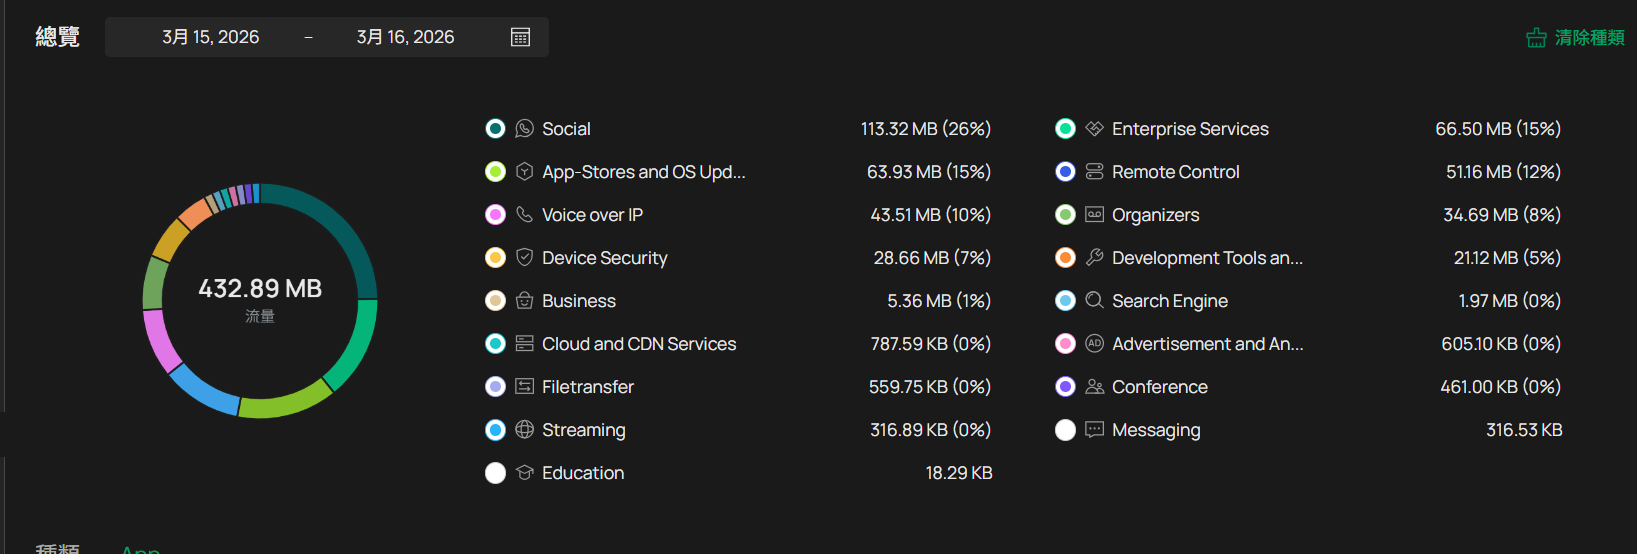
- 種類 的區塊顯示了各類別下特定應用程式的詳細流量資訊
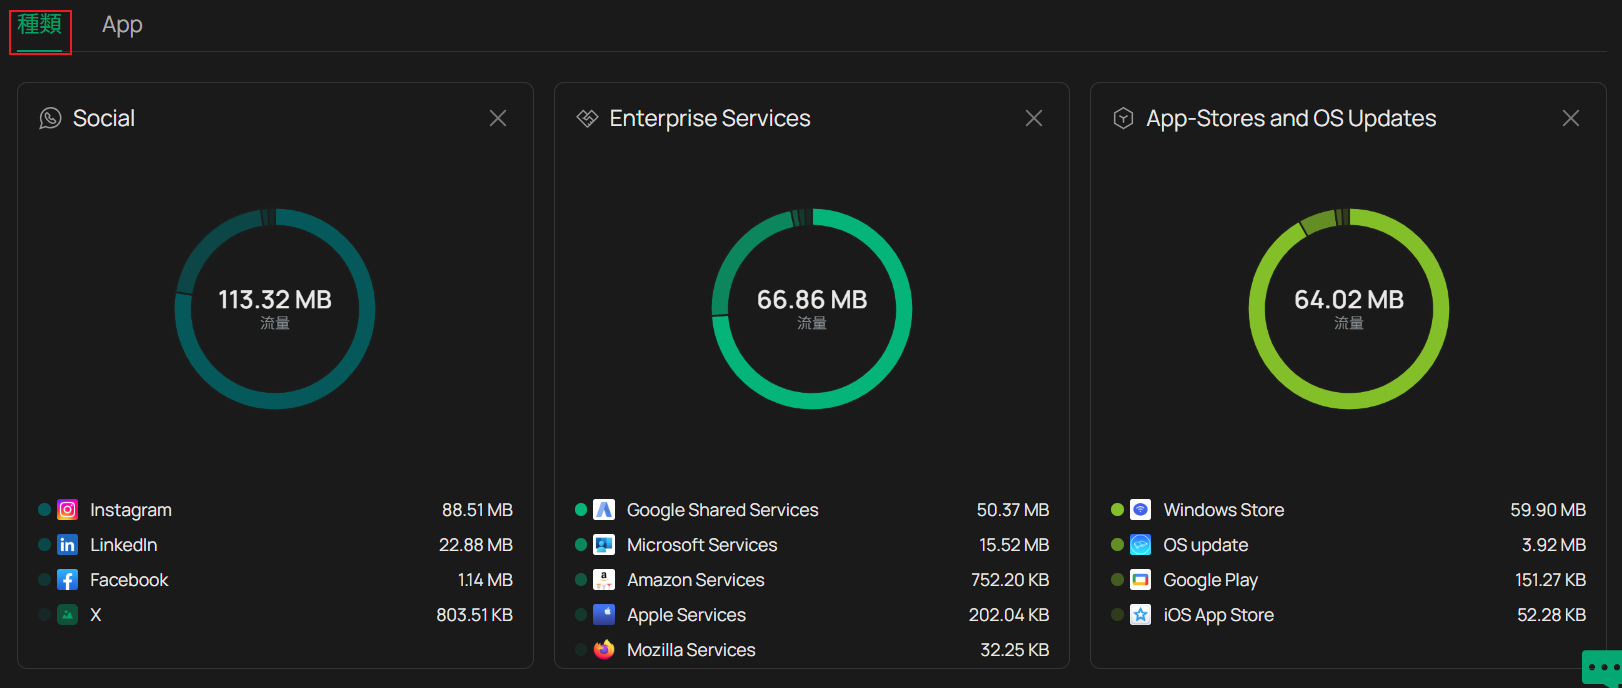
- Apps 區塊顯示所有應用程式的流量統計,包括允許Apps和封鎖App,允許APP提供流量數據、封鎖App顯示阻擋次數
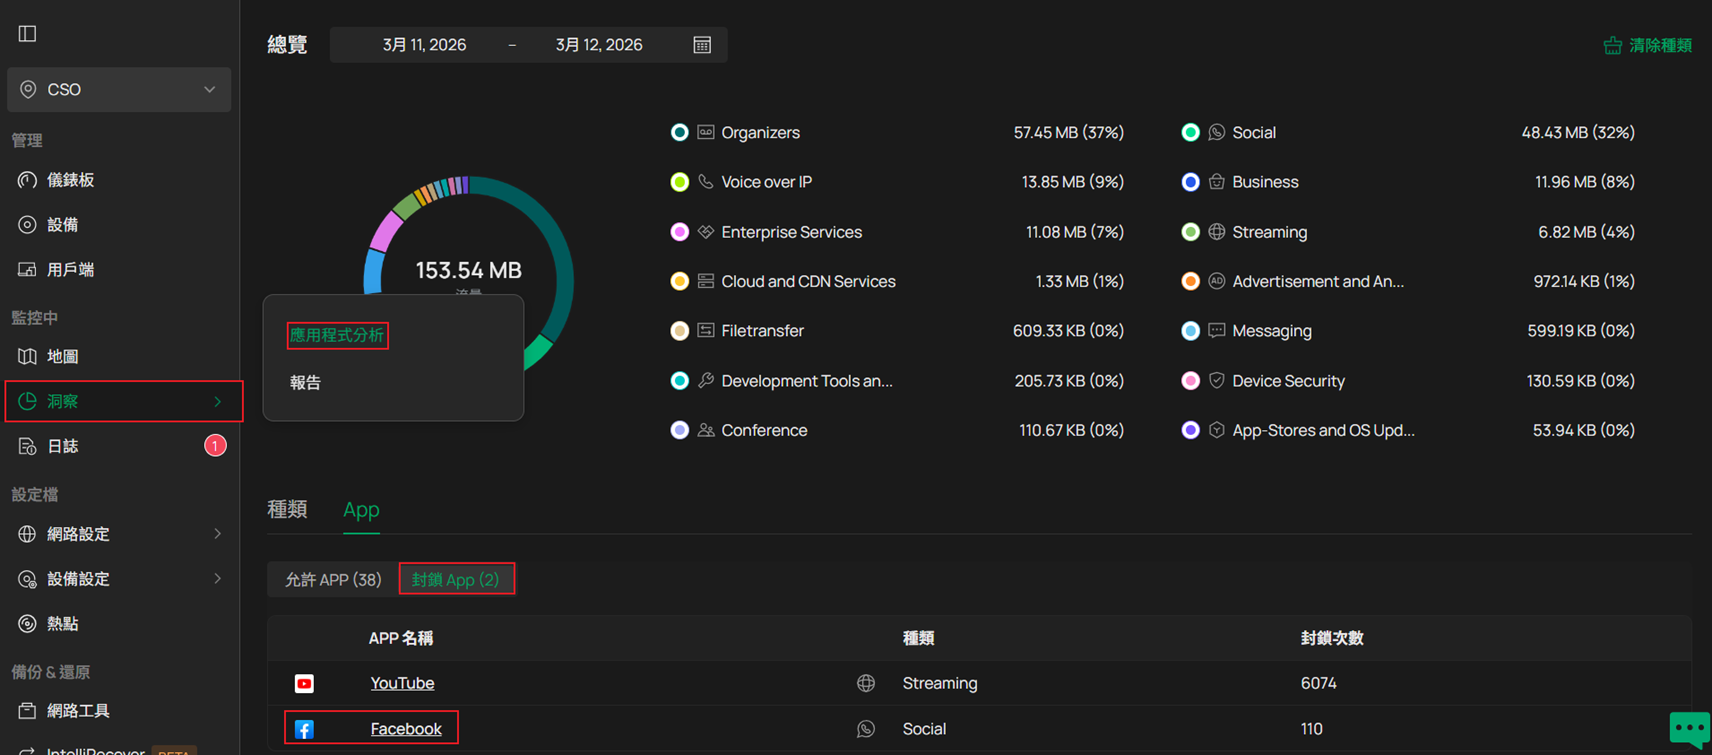
注意: Block Apps的數據僅包含在DPI中設定了Deny規則的應用程式,對於在DPI中設定Deny規則得應用程式,由於可能存在流量洩漏(traffic leakage),這些被拒絕的應用程式紀錄也可能出現在Allow Apps,這是正常狀況。
- The User section provides traffic statistics for all the connected clients in the network.
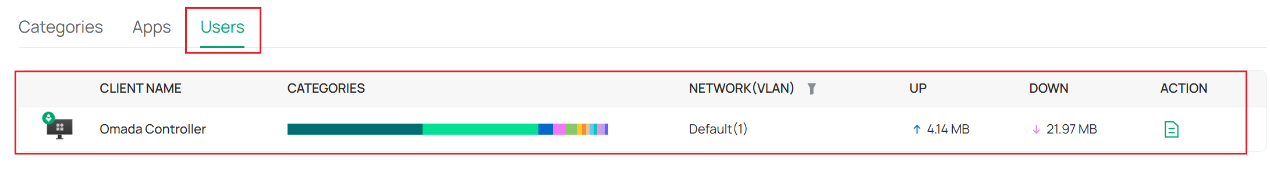
Note: If you use a hardware controller such as OC200, OC220, OC300, ER7212PC, or C5300 to configure the DPI function, the User module will not appear on the controller interface due to hardware limitations.
Conclusion
Now you have configured DPI on the Omada Gateway and can view the traffic statistics of different applications and clients on the network.
Get to know more details of each function and configuration please go to Download Center to download the manual of your product.
QA
Q1: Why does Application Analytics fail to display any traffic statistics even though I have configured DPI?
A1: Ensure that DPI and Logging Traffic is enabled on the gateway and make sure that you are accessing the applications through the gateway. Generally, it takes around 5 minutes for the application traffic statistics to be reported to the Controller. Please note that if you use a local Controller (i.e. Software/Hardware Controller), the DPI application traffic is reported to the Controller through a specific port (TCP port 29815). In this case, check your local firewall policy to ensure that this port is not being blocked.
Recent updates may have expanded access to feature(s) discussed in this FAQ. Visit your product's support page, select the correct hardware version for your device, and check either the Datasheet or the firmware section for the latest improvements added to your product. Please note that product availability varies by region, and certain models may not be available in your region.
