


Contents
Introduction
This article introduces how DPI works and how to configure the DPI function on the Omada Gateway via Standalone mode or Omada Controller.
Deep Packet Inspection (DPI) can help users identify, analyze, and control application-layer traffic in the network. The DPI engine includes the latest application recognition signatures to track which applications are using the most bandwidth. Users can better manage and distribute network traffic through DPI. When DPI is enabled, the device will send the forwarded traffic to the local DPI engine for analysis to determine and identify the type of traffic. When Log Switch or Logging Traffic is enabled, the device will collect and save the results of traffic analysis.
Note: Enabling this function will decrease the number of clients. For OC200/220, the maximum client amount could be 500; For OC300, the maximum client amount could be 5000; For OC400, the maximum client amount could be 10000.
Requirements
- Omada Controller (Software Controller / Hardware Controller / Cloud-Based Controller)
- Omada Gateway (DPI supported)
Configuration
Here, we take ER7206 and the Software Controller as an example.
Standalone Mode
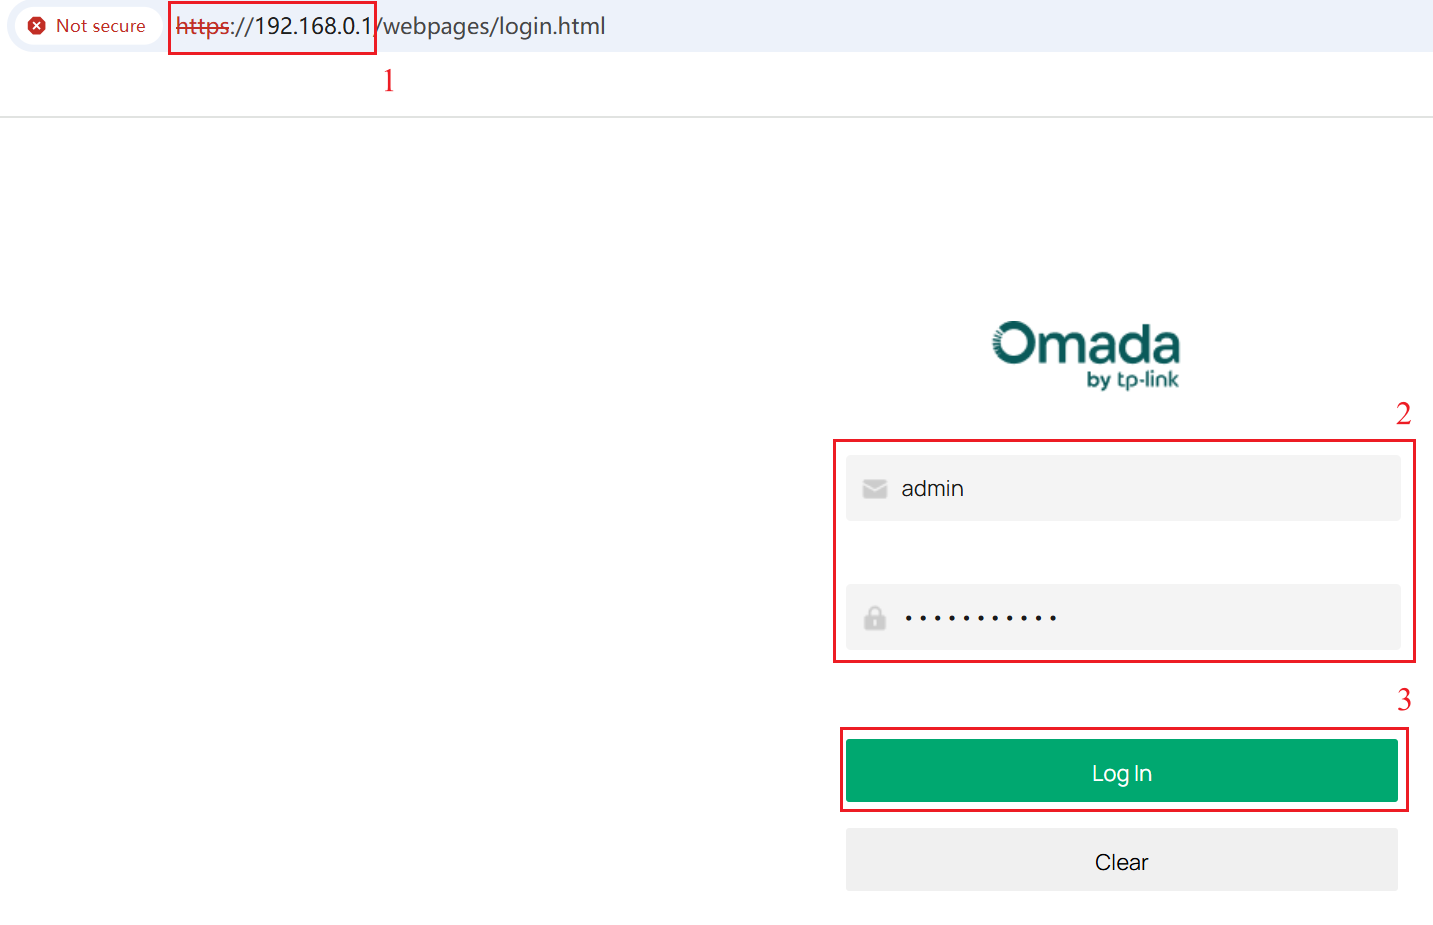
Step 1. Enter the IP address of the Omada Gateway in the browser search bar (default: 192.168.0.1). Then, enter the device’s username and password and click Log in to access the device in Standalone mode.
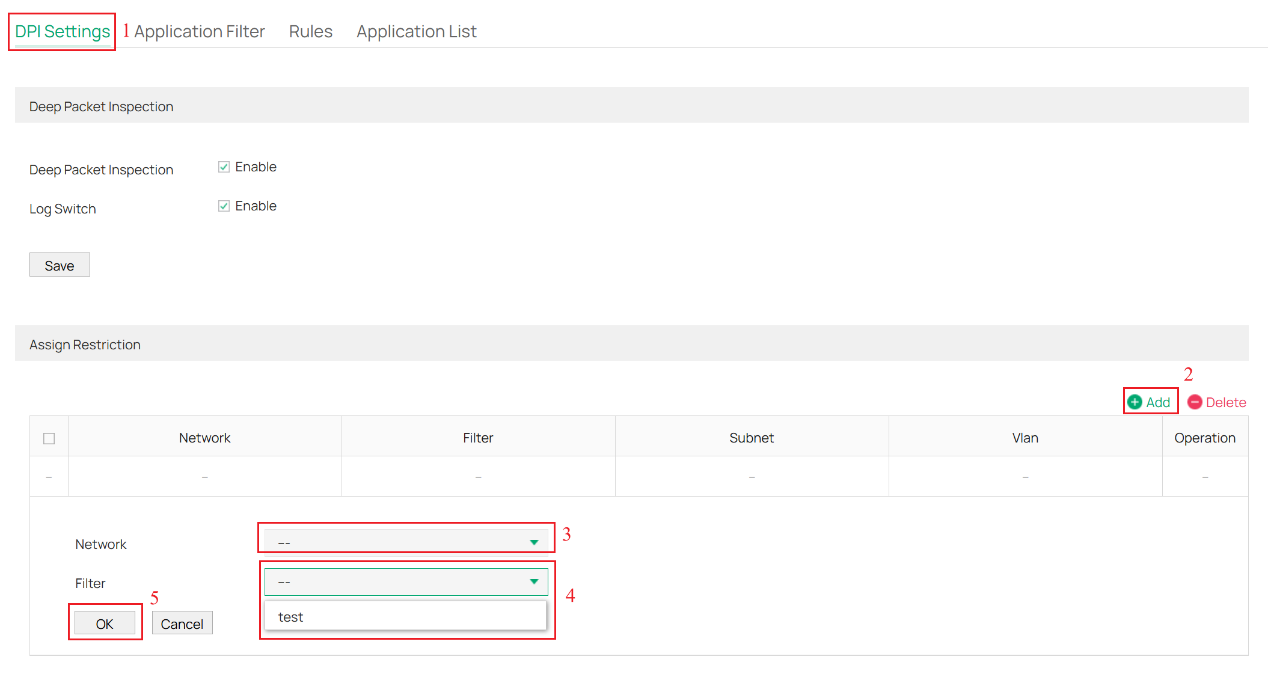
Step 2. Navigate to Firewall > Application Control > DPI Settings. Enable Deep Packet Inspection and Log Switch. Click Save to save the configuration.
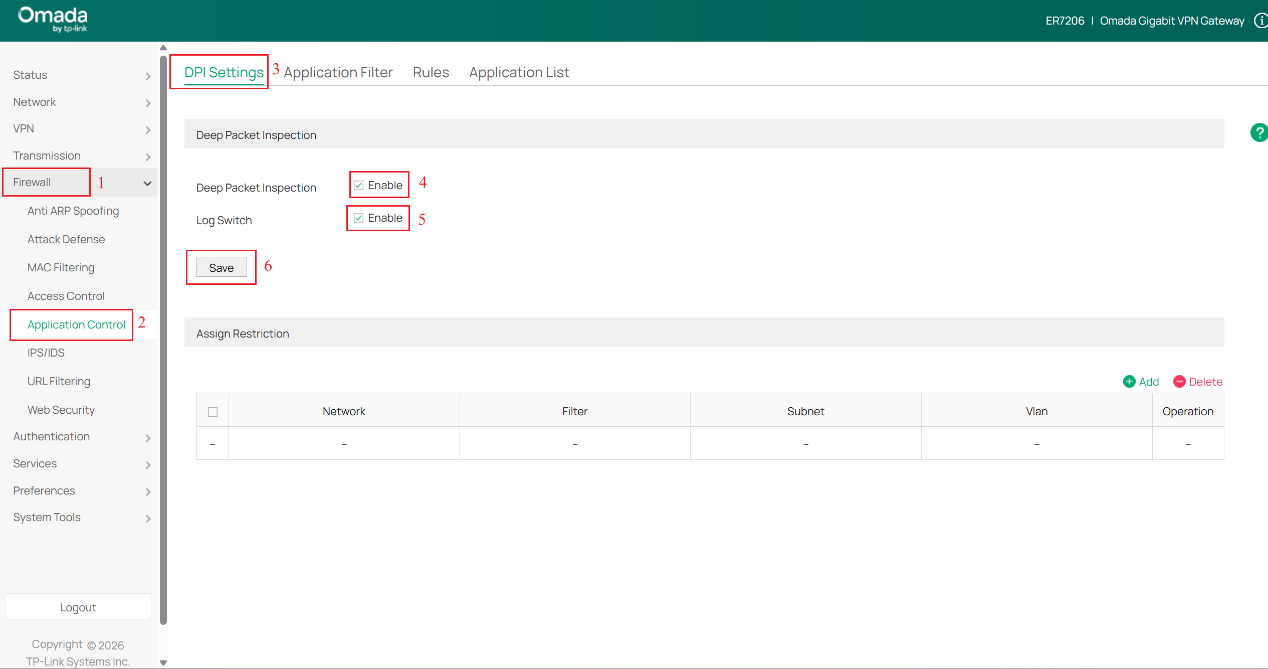
Note: Enabling DPI only activates the detection function. If you need to block or control traffic for specific applications, additional configuration is required. The “Log Switch” option determines whether DPI application statistics logs are recorded.
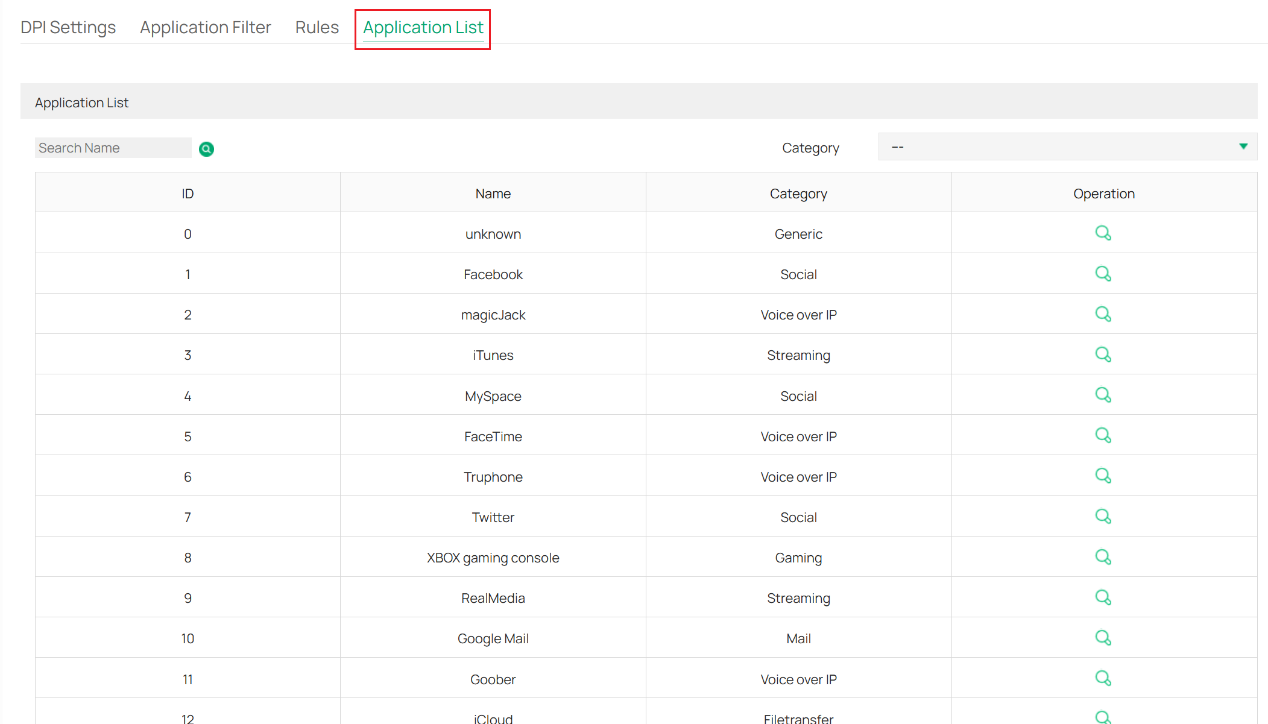
The Application List page allows you to view all the supported applications, as shown in the following figure.
Step 3. Click to switch to the Rules page, then click the +Add button to create a New Rule. Enter the Rules name and select the Schedule. Click the Select button, and in the Select Apps window, search and select one or more applications to add to the rule. After making the selection, click OK to close the application selection window. Finally, click OK to save the rule.
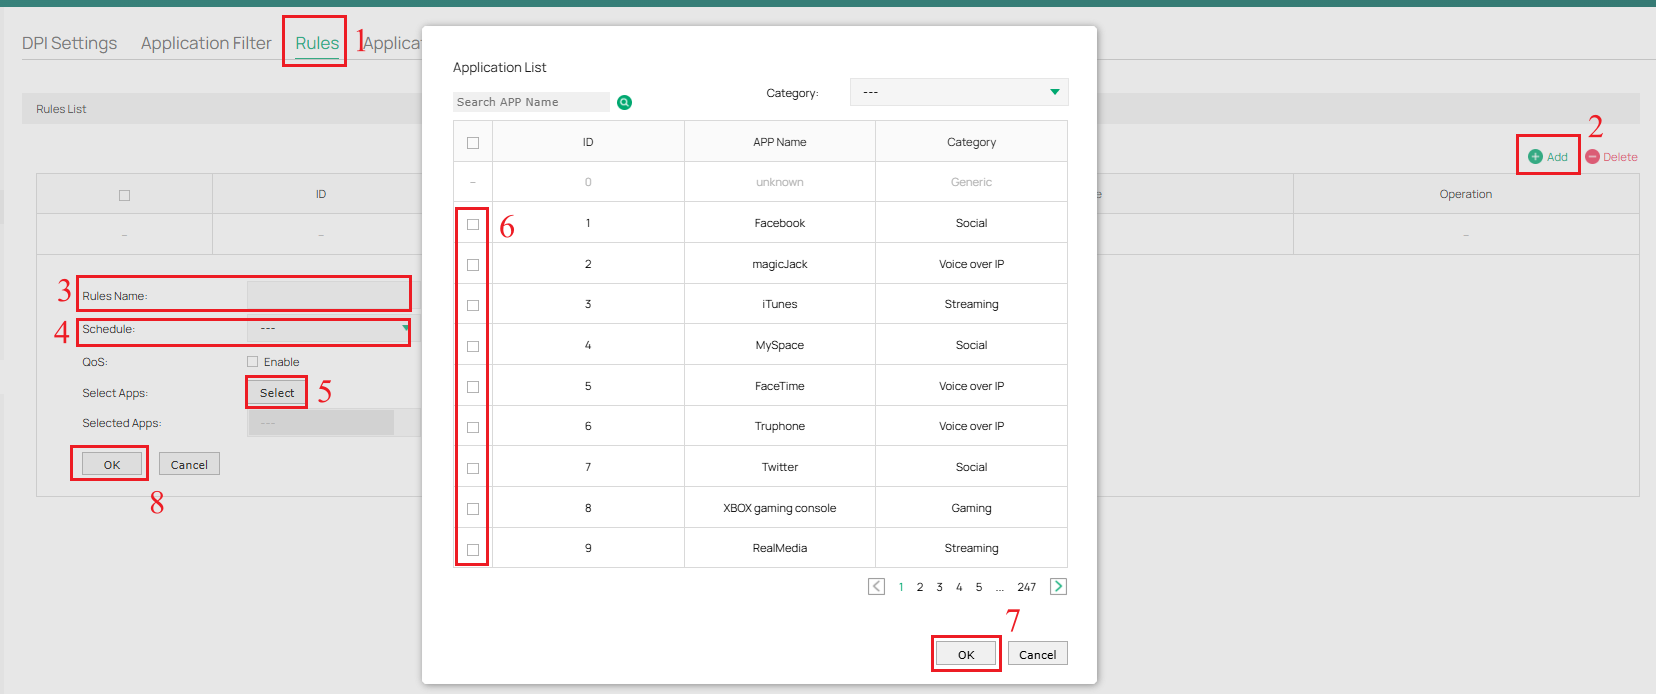
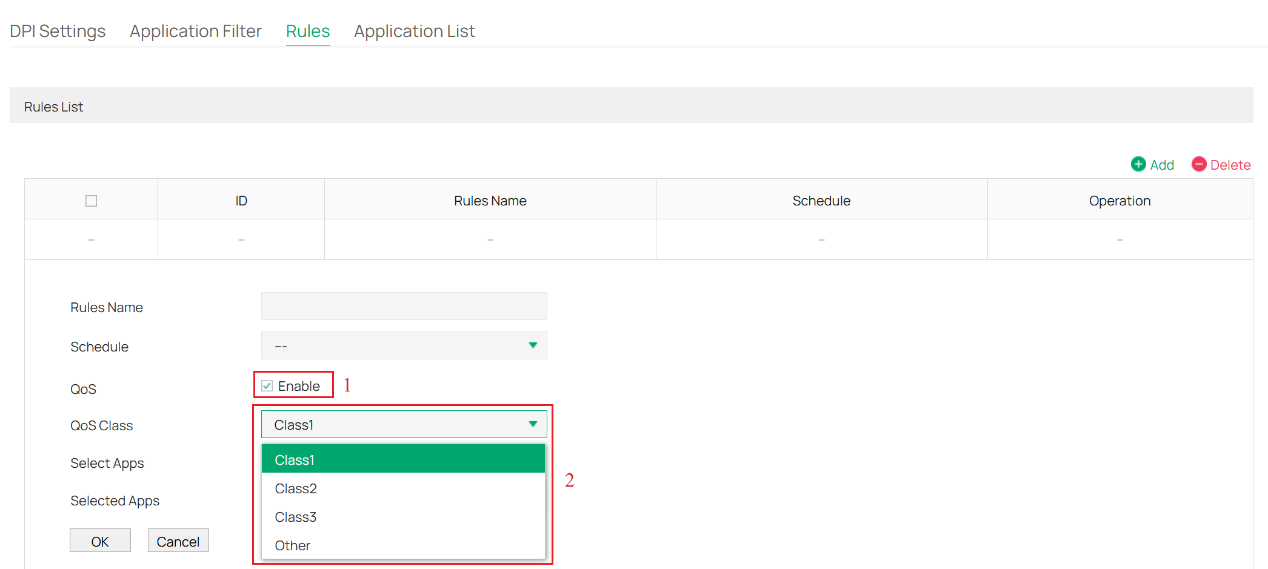
Note: The schedule is the time range you set for the rule to take effect. If you enable QoS, you need to select the QoS Class; the applications in this rule will be added to the corresponding QoS class to limit their rate.
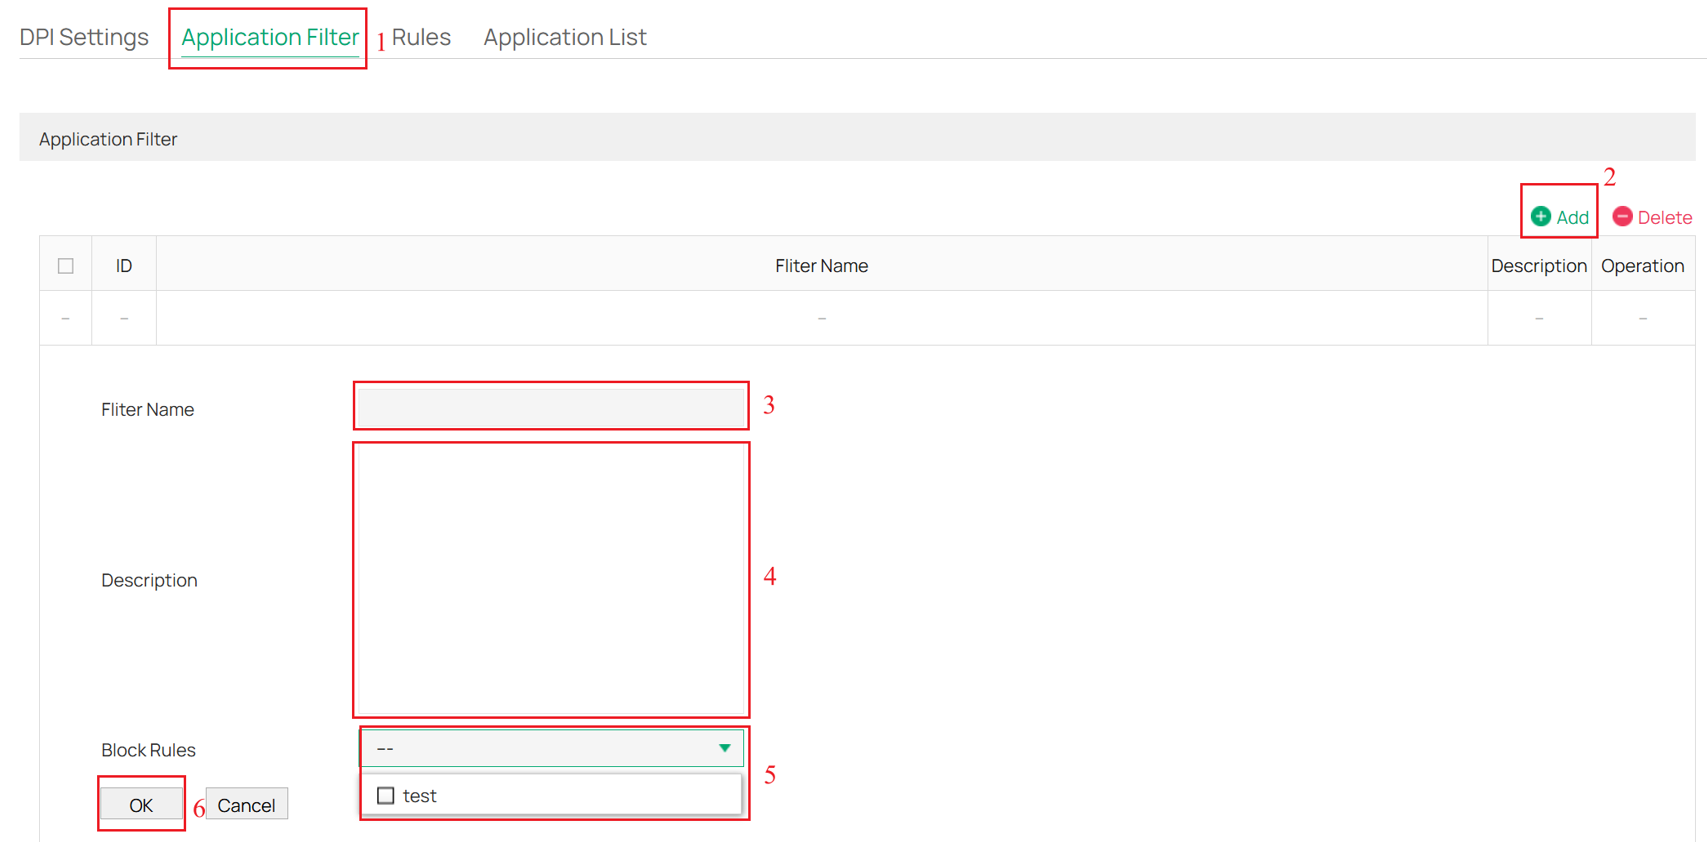
Step 4. Click to switch to the Application Filter page, then click the +Add button to create a New Application Filter. Enter the Filter Name and Description of the newly added Application Filter. Select the one or more rules created in Step 3 as Block Rules. Click OK to save the configuration.
Step 5. Click to switch to the DPI Settings page, click the +Add button to create a New Assign Restriction. Select the Network and Application Filter created in Step 4. Click OK to save the configuration. The policy will take effect and block the applications.
Step 6. If you have enabled Log Switch in Step 2, you can navigate to Status > Traffic Statistics > DPI Statistics to view the traffic statistics for the different Categories selected by default.
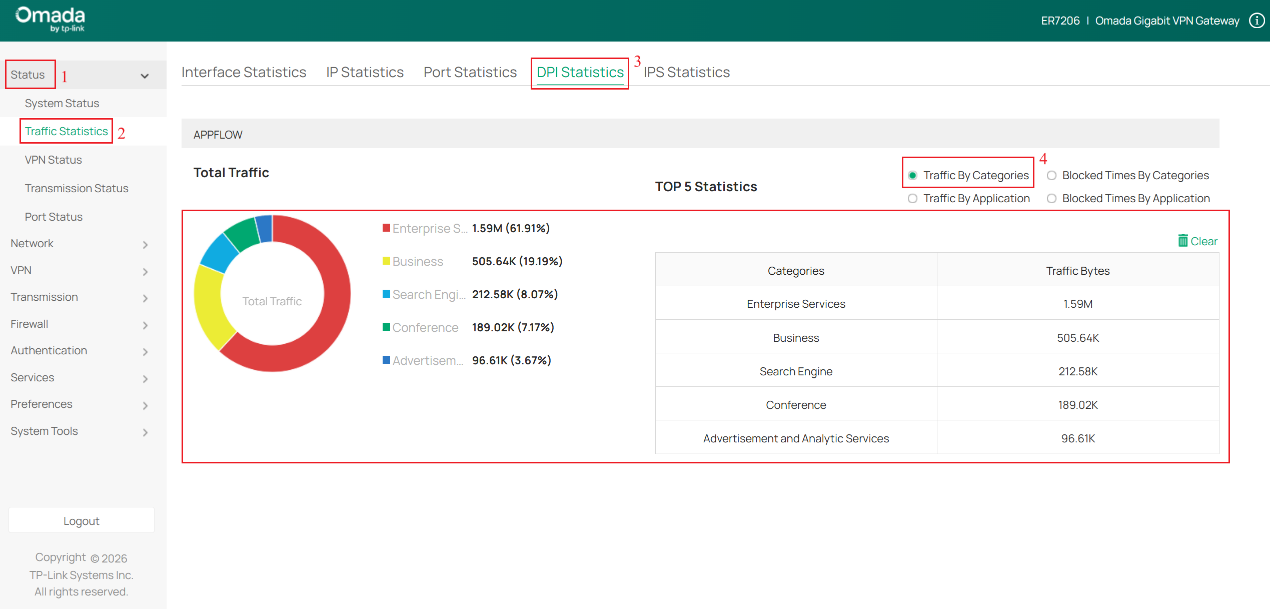
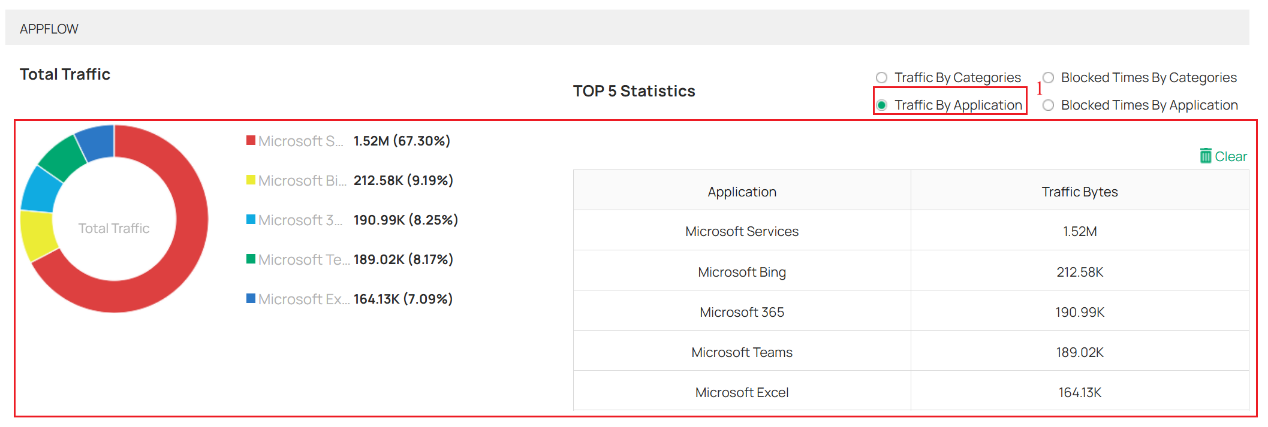
- You can also select Traffic By Application to view traffic statistics for different applications.
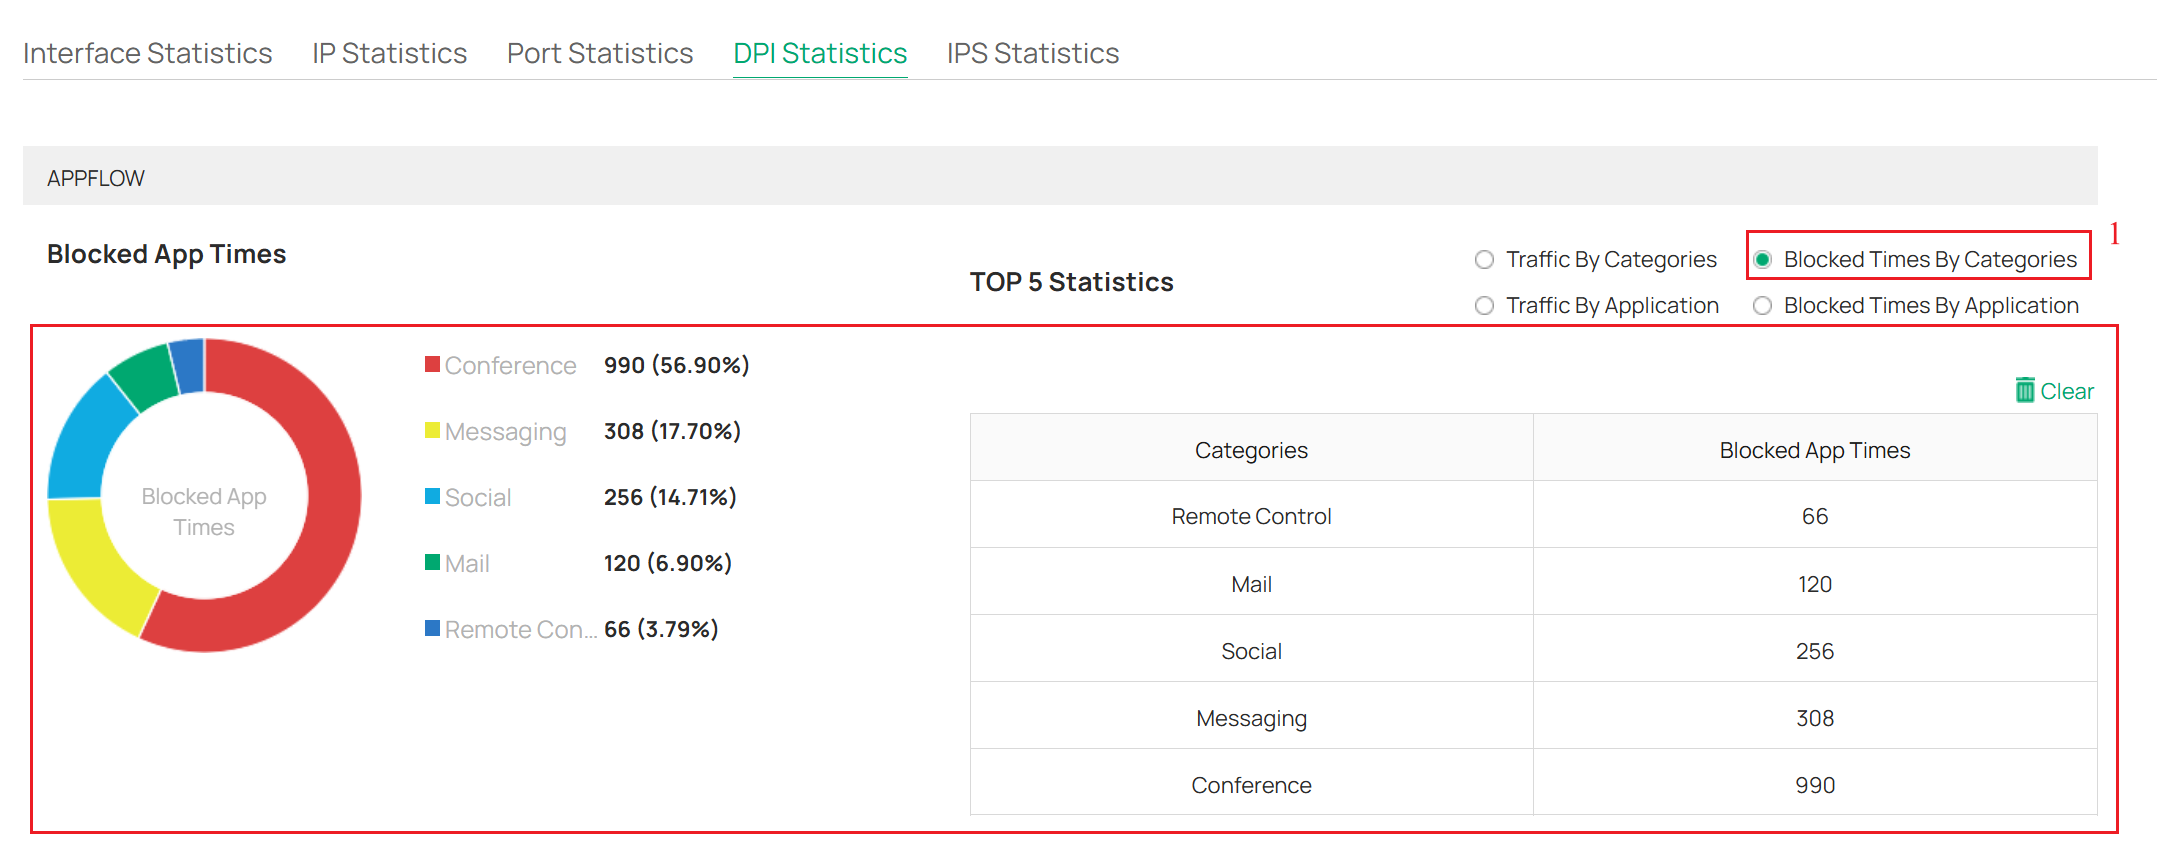
- You can also select Blocked Times By Categories to view the number of blocked access attempts that the Omada Gateway has counted by Categories.
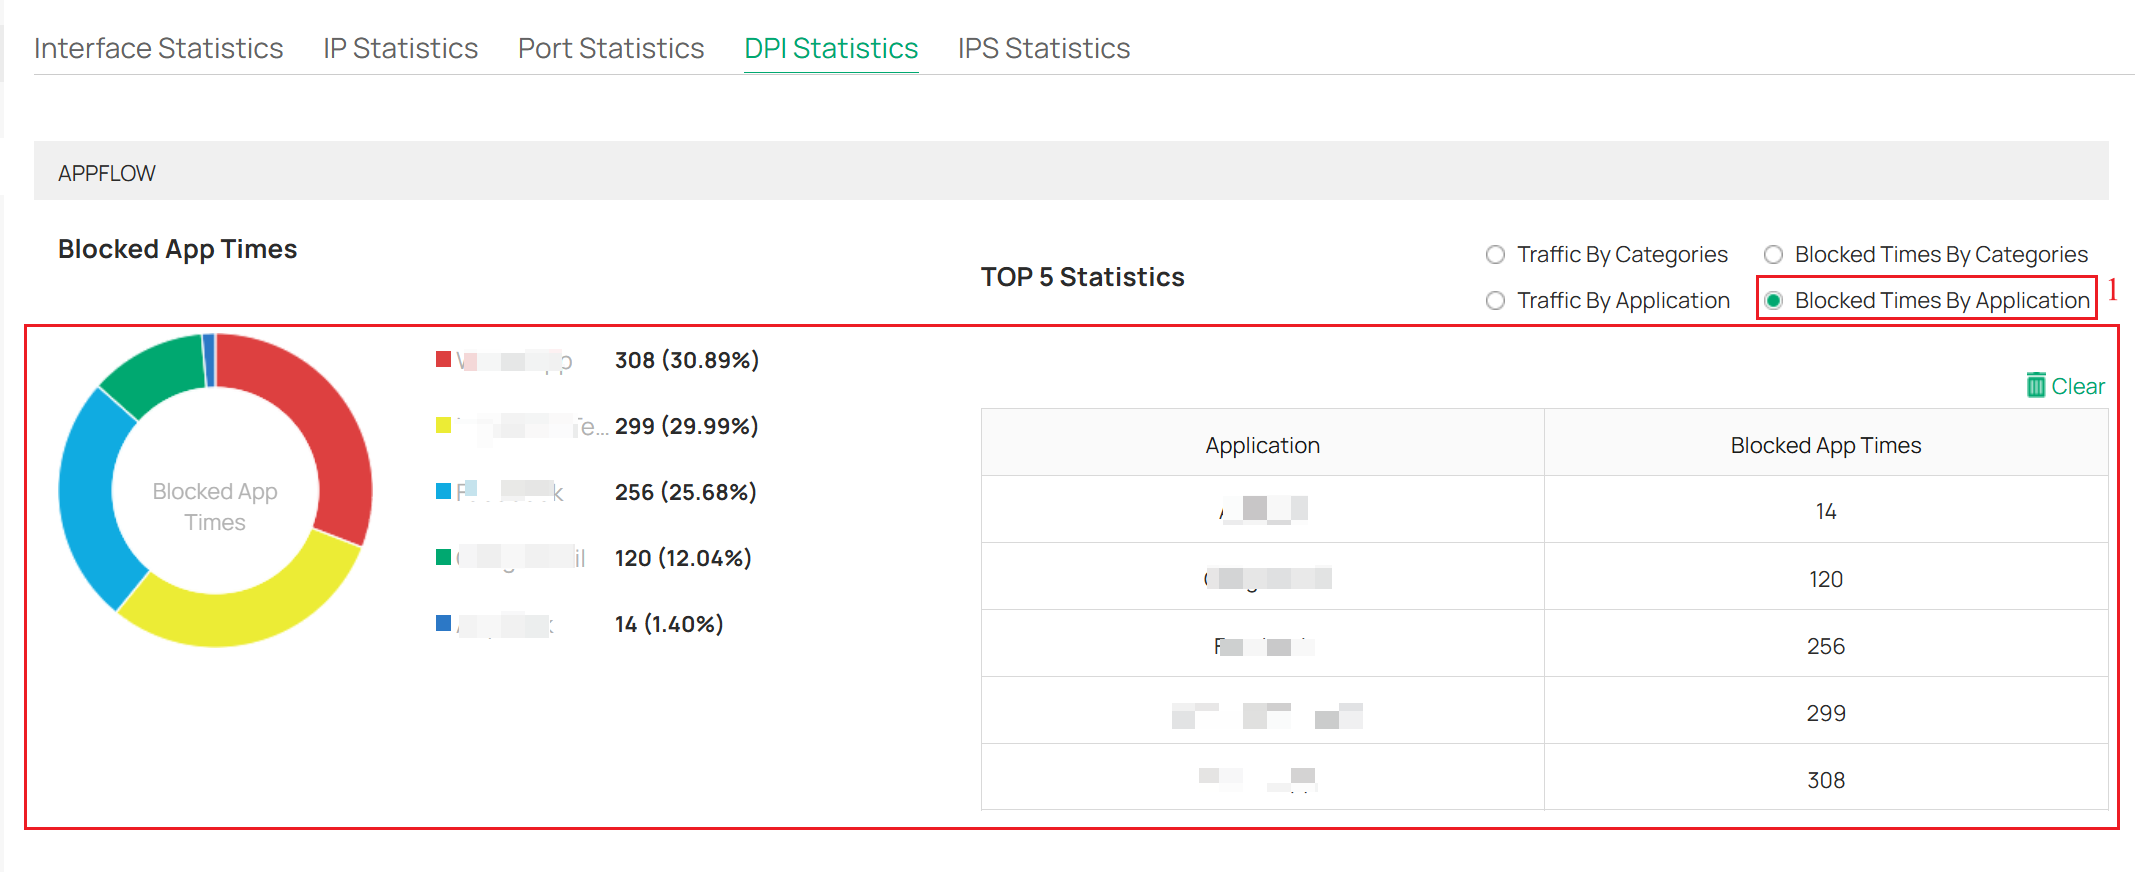
- You can also select Blocked Times By Application to view the number of blocked access attempts that the Omada Gateway has counted by Application.
Omada Controller
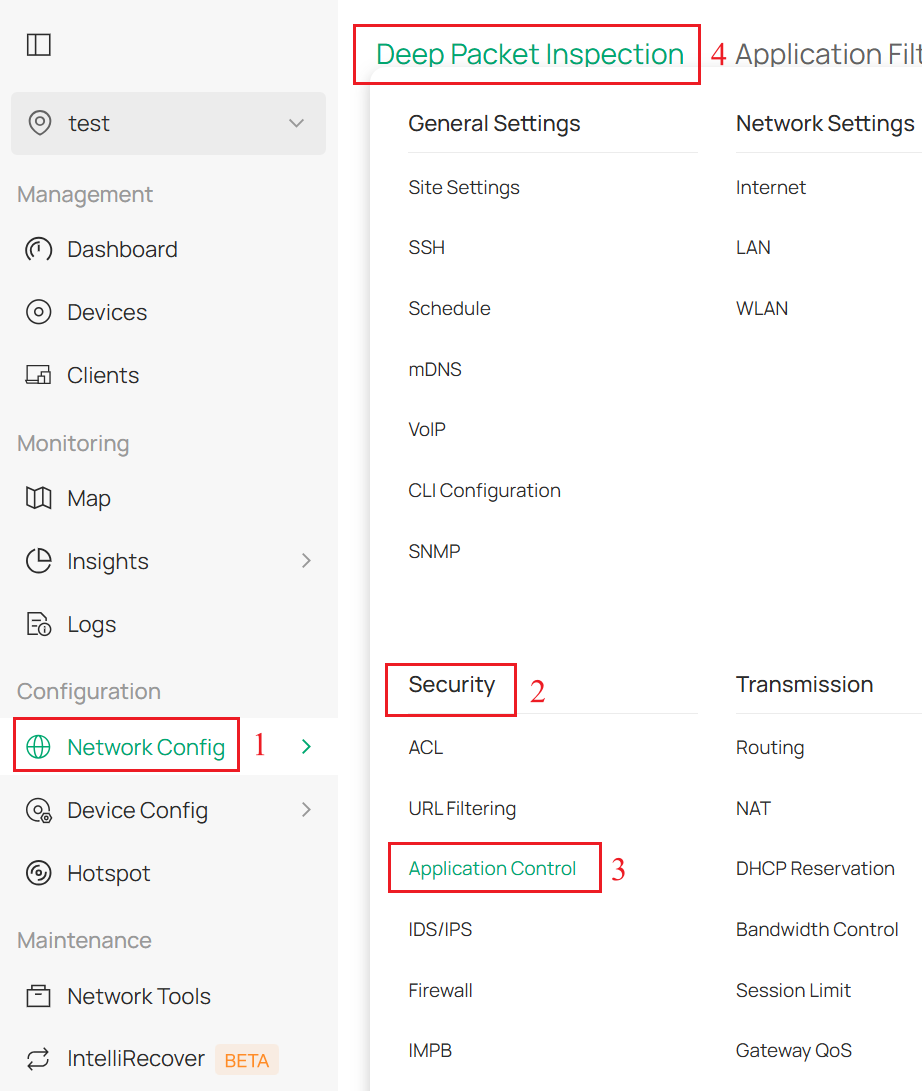
Step 1. Launch the Omada Controller and navigate to Network Config > Security > Application Control > Deep Packet Inspection.
Step 2. Enable Deep Packet Inspection. Note that enabling DPI only activates the inspection capability. If you need to block or control the traffic of certain applications, further configuration is required. Enabling Logging Traffic determines whether to record the DPI application statistics logs. Click Apply to save the configuration. Clear Data allows you to select and clear the logged DPI data records.
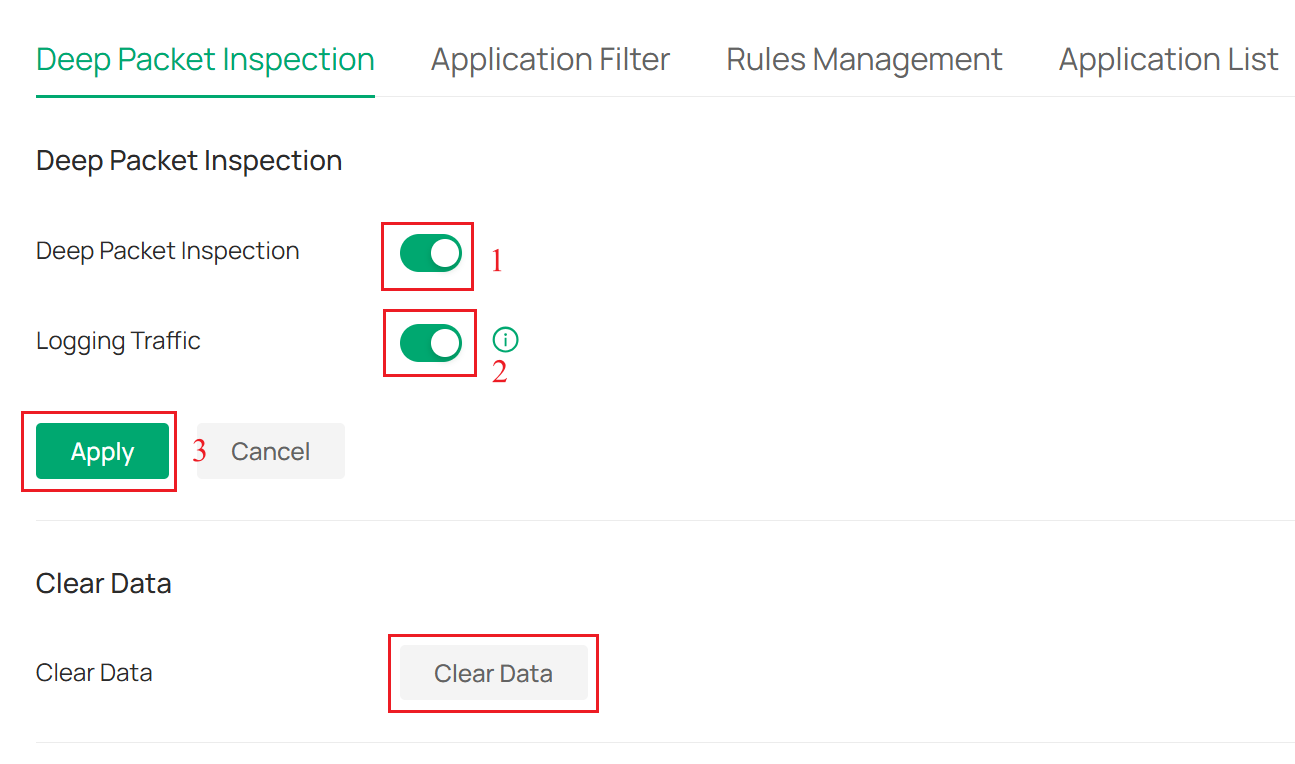
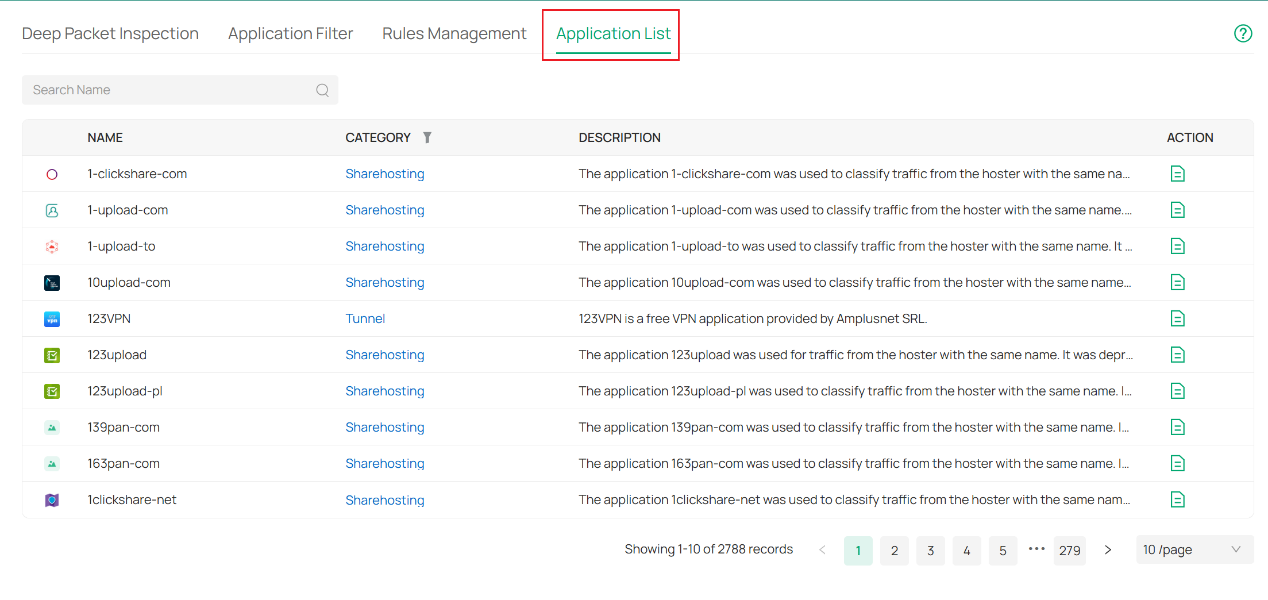
The Application List page allows you to view all the supported applications, as shown in the following figure.
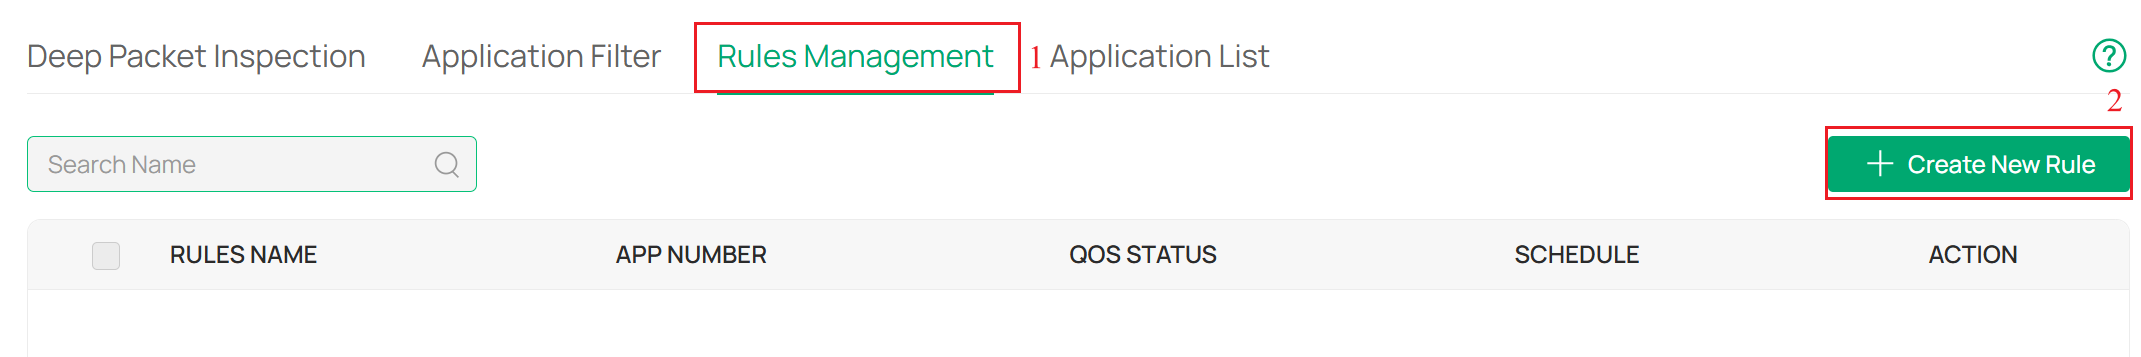
Step 3. Navigate to Rules Management, click + Create New Rule. Enter the Rules Name and specify a time range for the rule to take effect in the Schedule field. The default policy is Deny. In the Select Apps section, search for and select one or more applications to add to the rule. Click Apply to save the newly created rule.
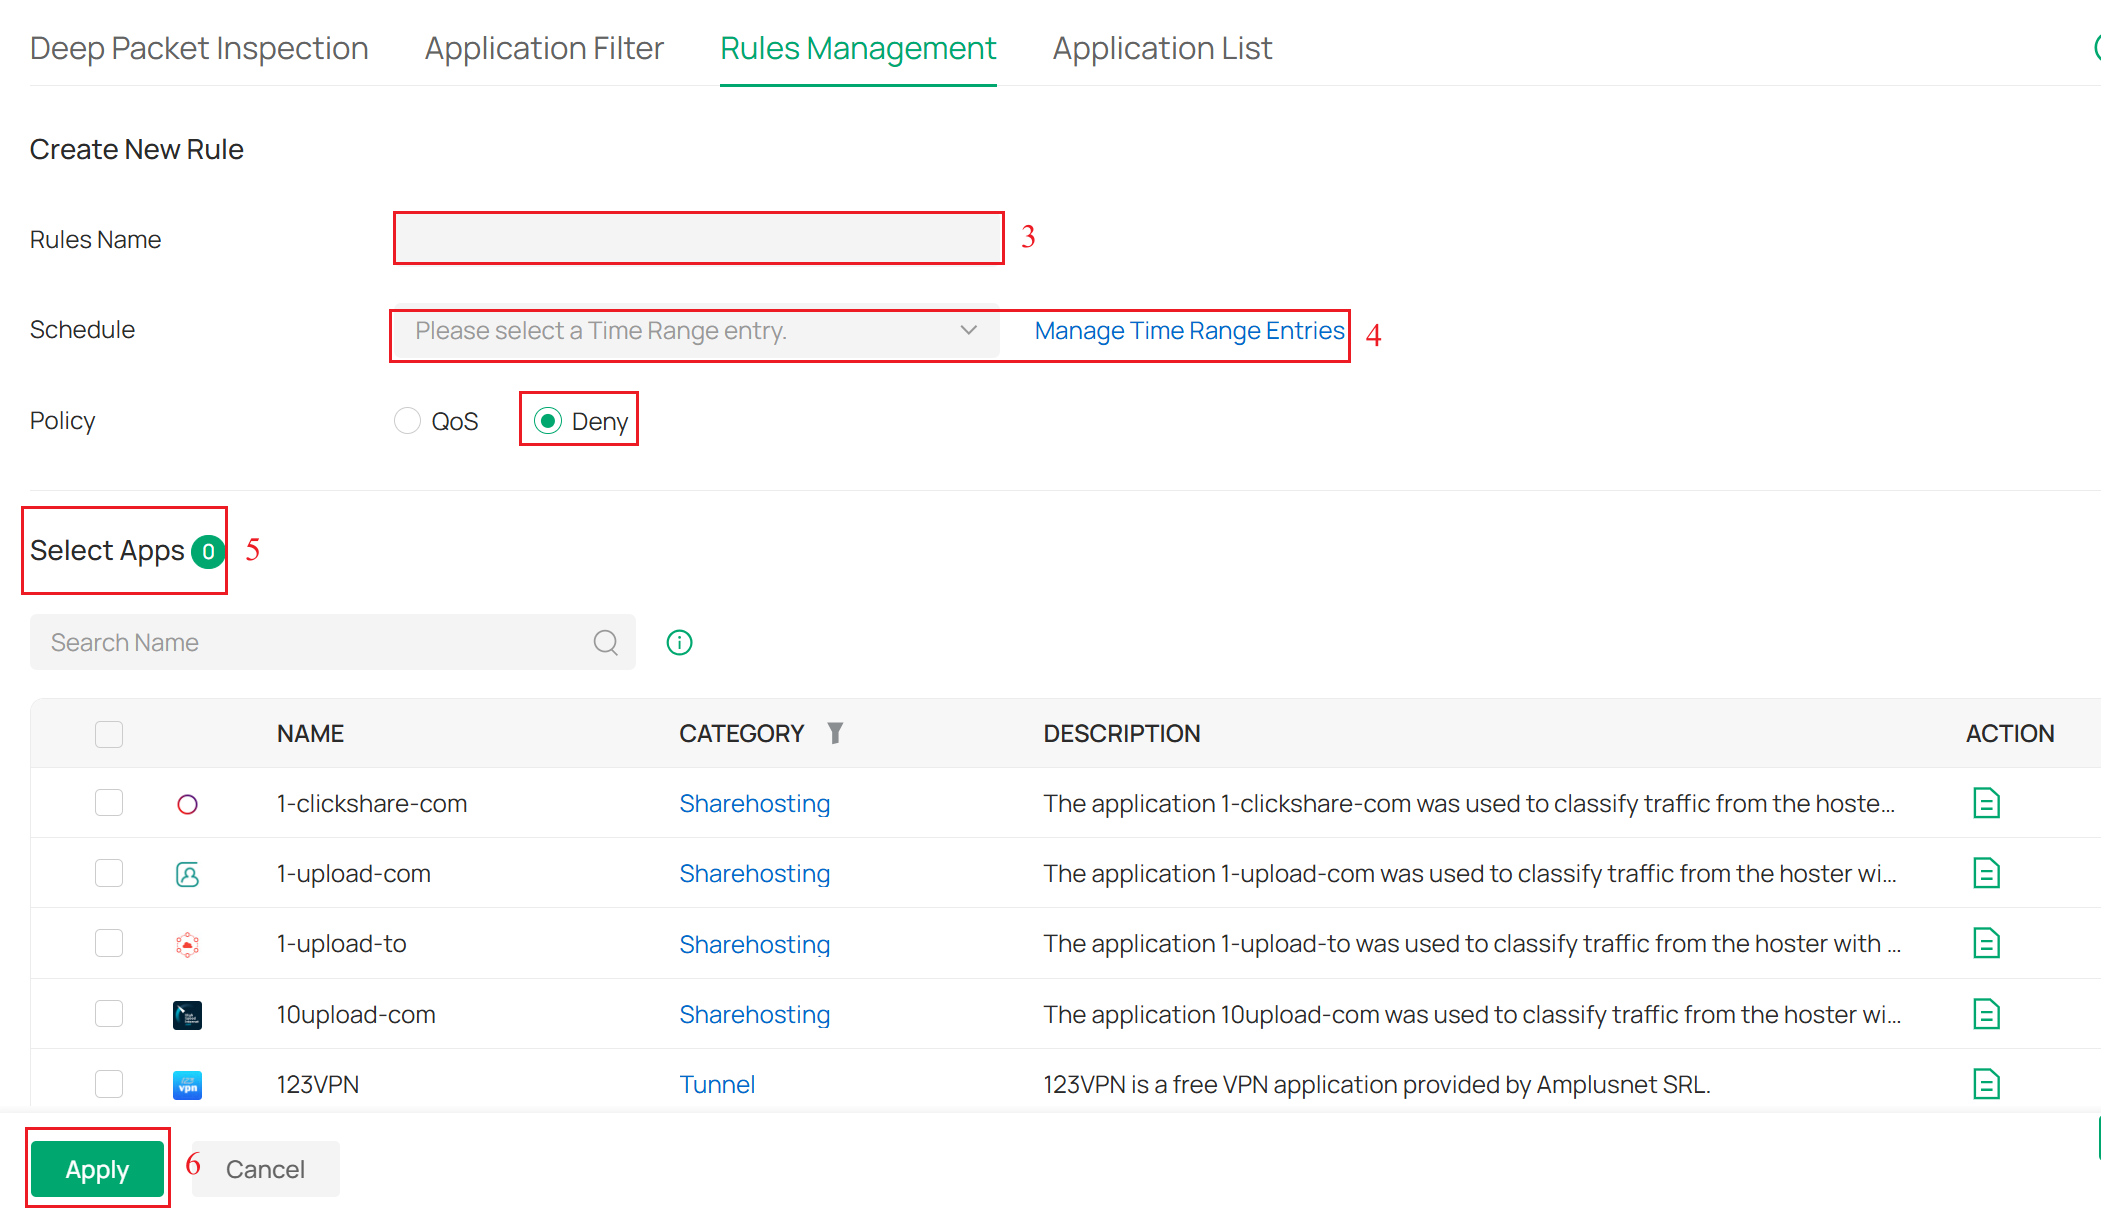
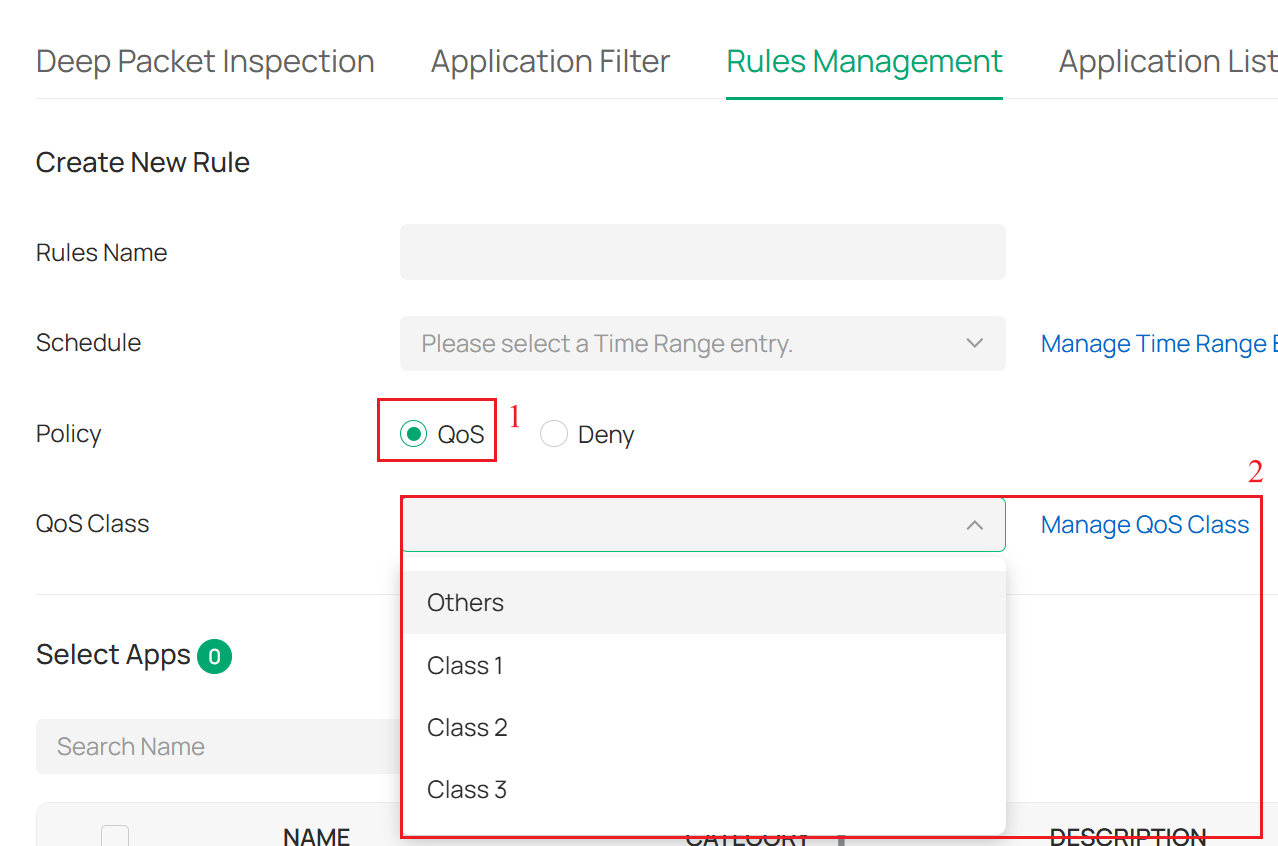
Note: If you enable QoS, you need to select the QoS Class; the applications in this rule will be added to the corresponding QoS class to limit their rate.
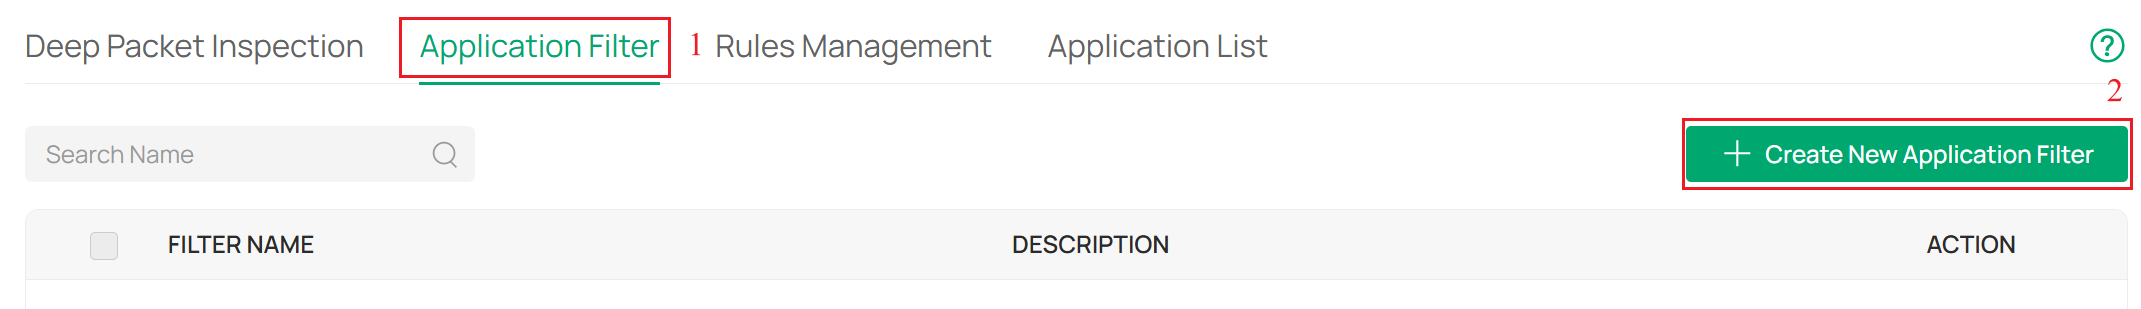
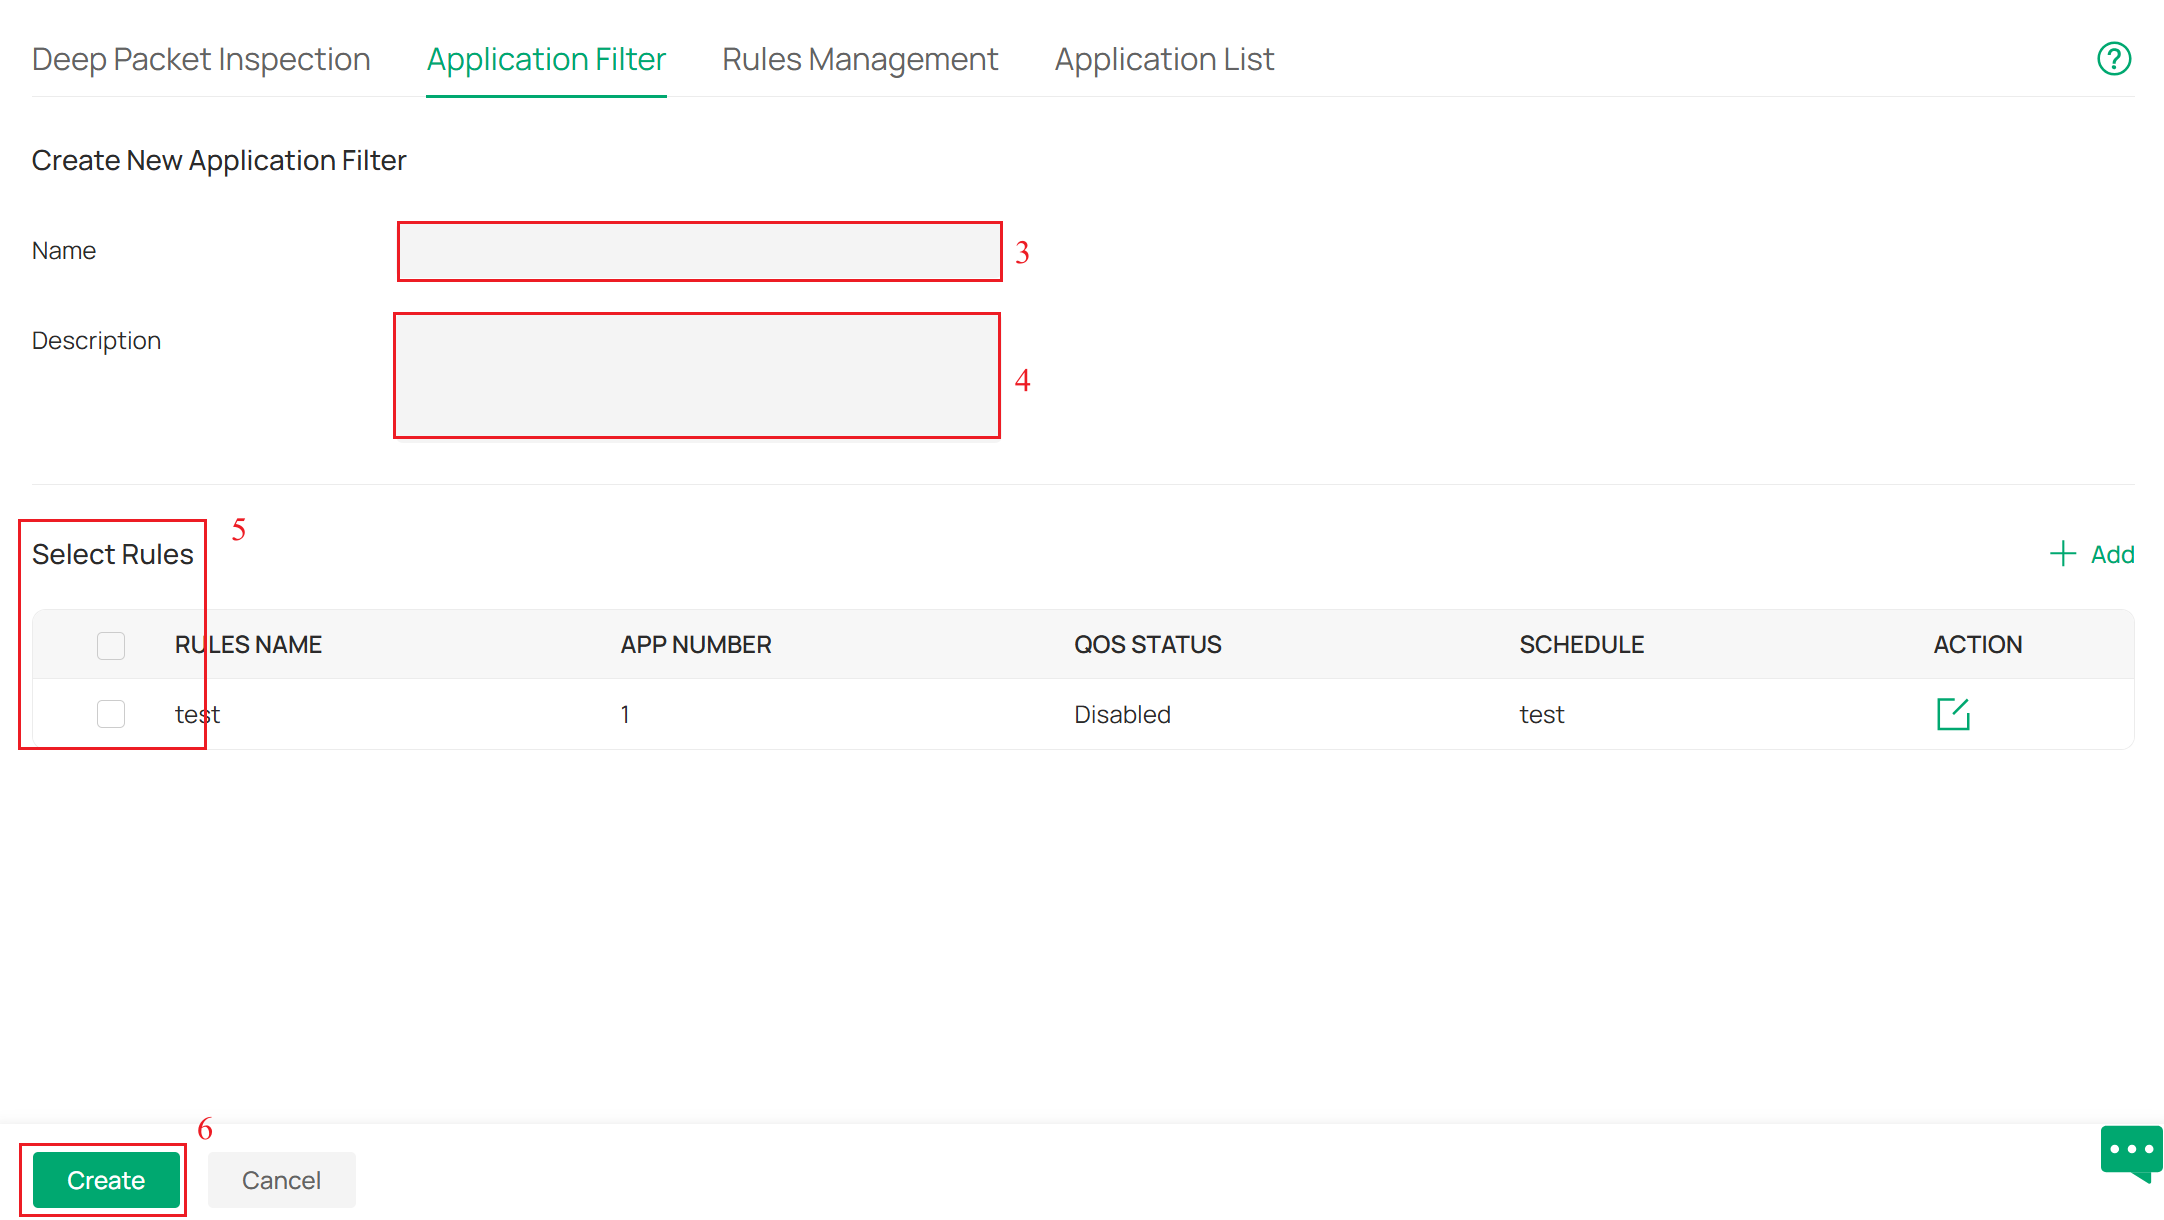
Step 4. Navigate to Application Filter, click + Create New Application Filter. Enter the Filter Name and Description of the newly added Application Filter. Select one or more rules created in Step 3. Click Create to save the newly created application filter.
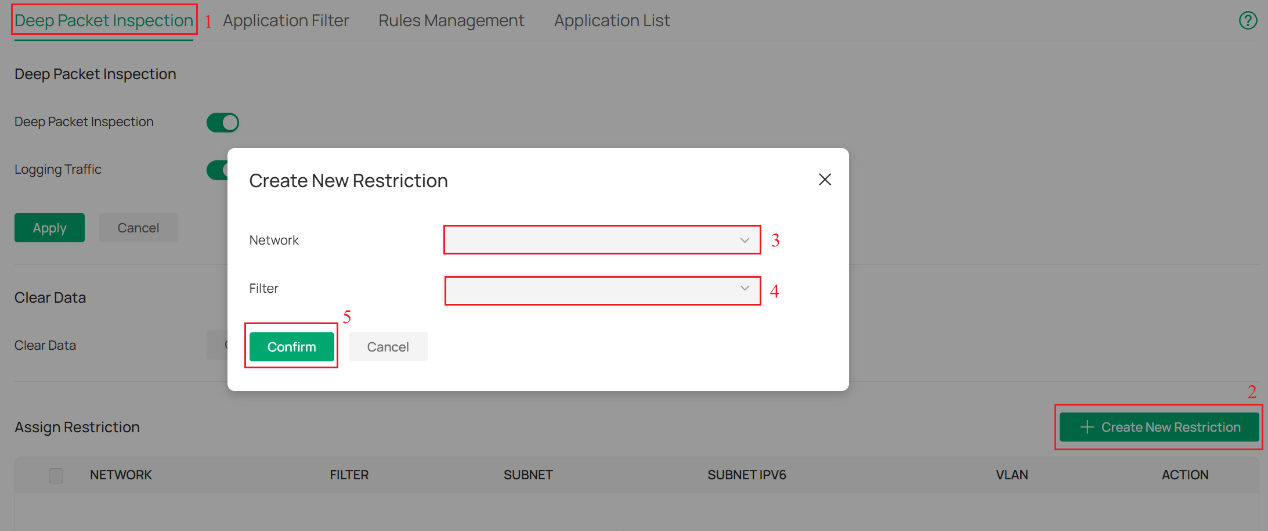
Step 5. Navigate to the Deep Packet Inspection page, click the + Create New Assign Restriction button to create an assign restriction. Select the Network and Application Filter created in Step 4. Click Confirm to save the newly created restriction. The policy will take effect and block the applications.
Step 6. If you have enabled Logging Traffic in Step 2, you can go to Insights > Application Analytics to view the traffic statistics of different applications.
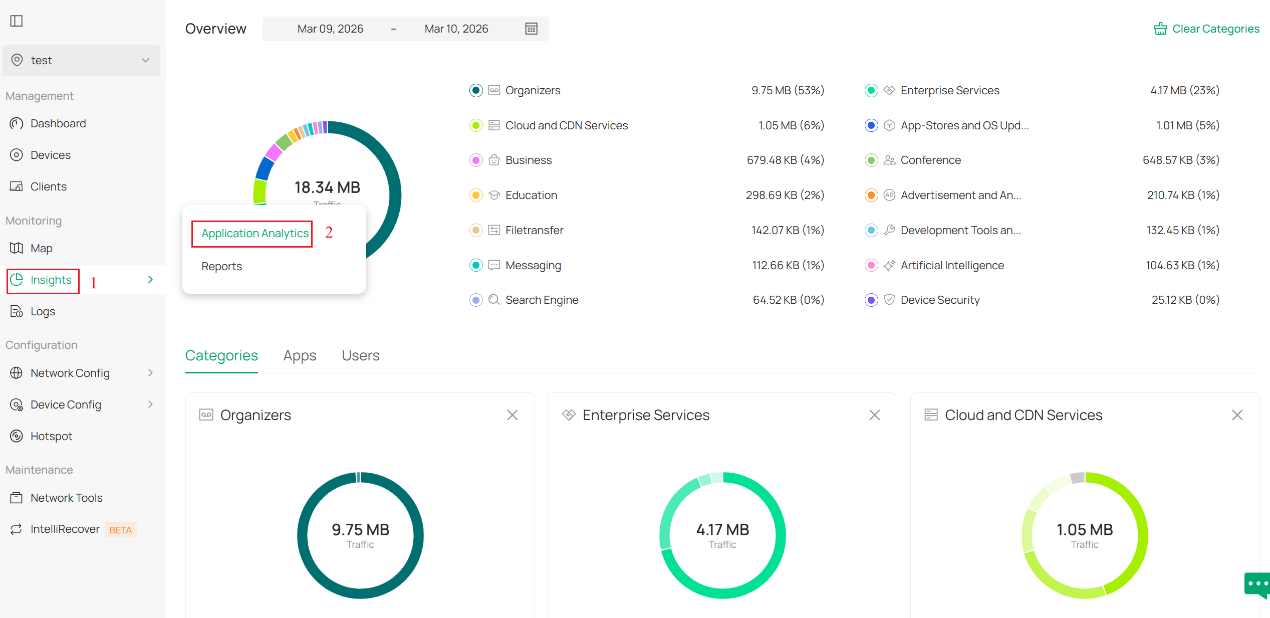
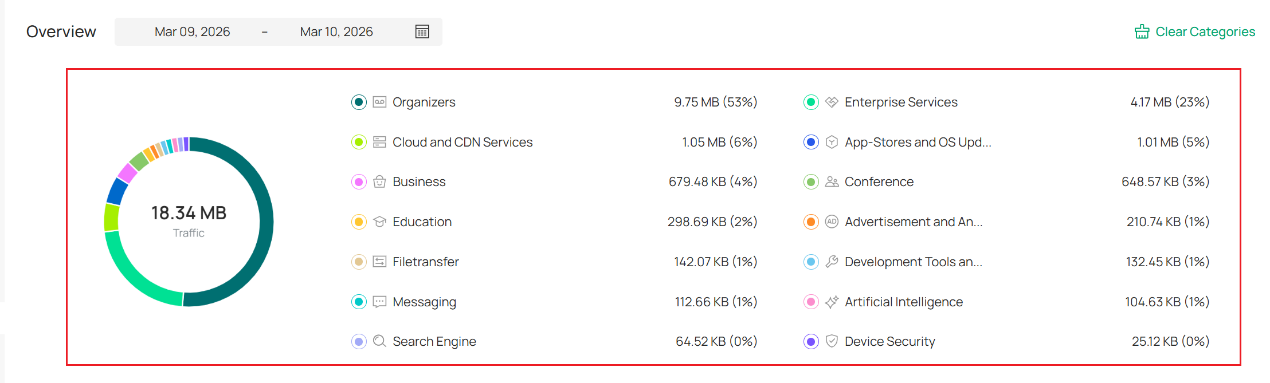
- In the Overview section, the pie chart represents the proportional breakdown of all types of network traffic. The information on the right displays the specific application types and their proportions.
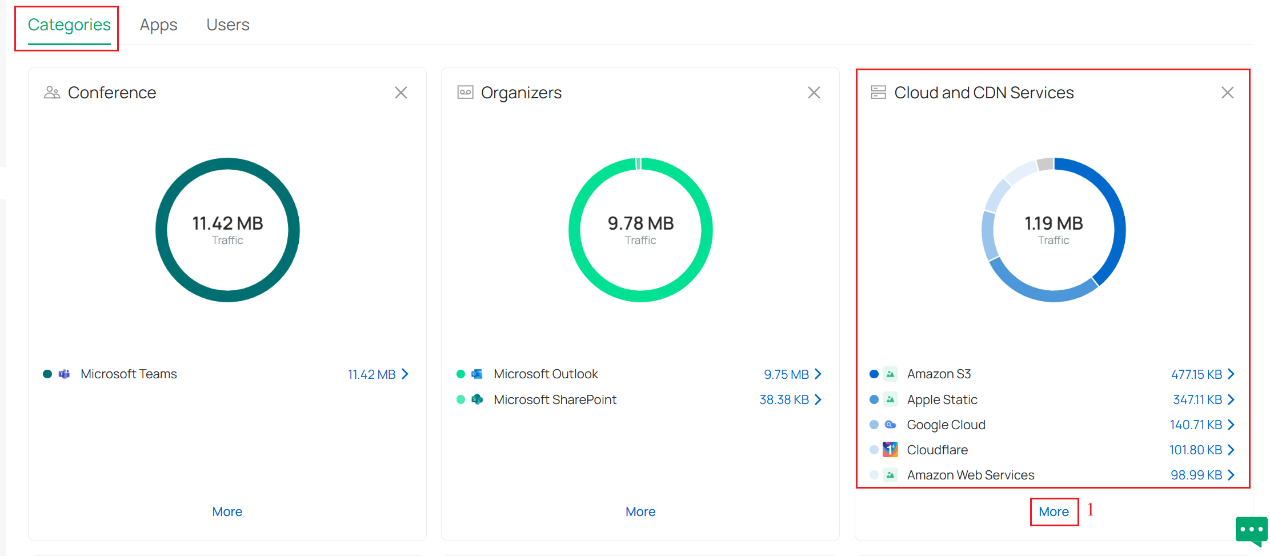
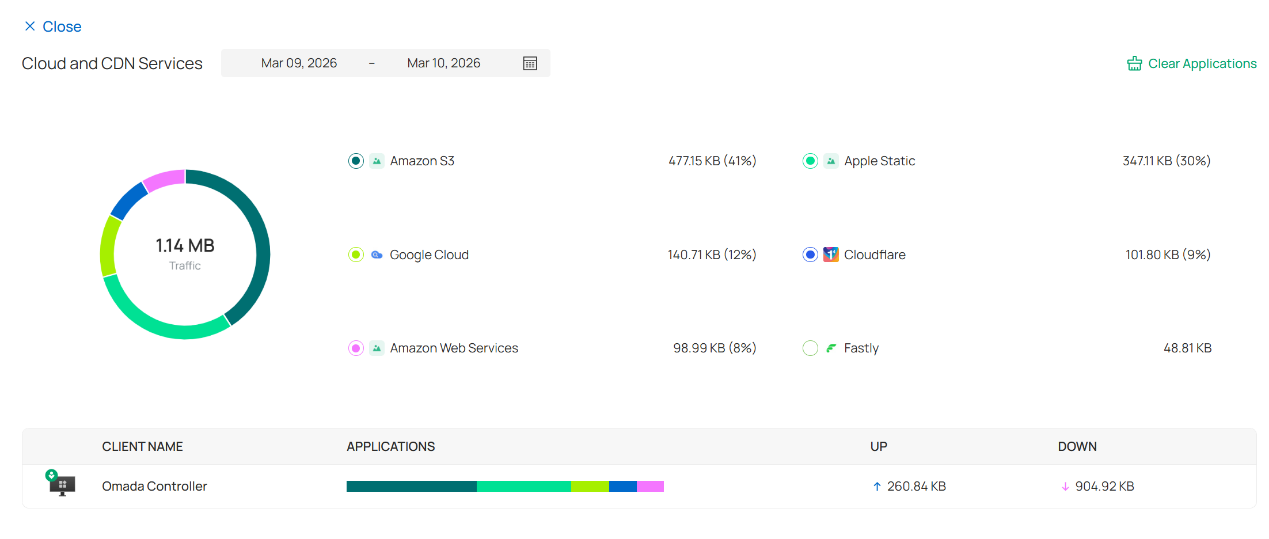
- The Categories section displays the detailed traffic information of specific applications under each category. Click the More button to navigate to a more detailed statistics page. This will allow you to view the information about the specific devices that are accessing the applications.
- The Apps section displays the traffic statistics on all the applications, including the allowed and blocked ones. Allow Apps provides traffic data information, while Block Apps displays block times.
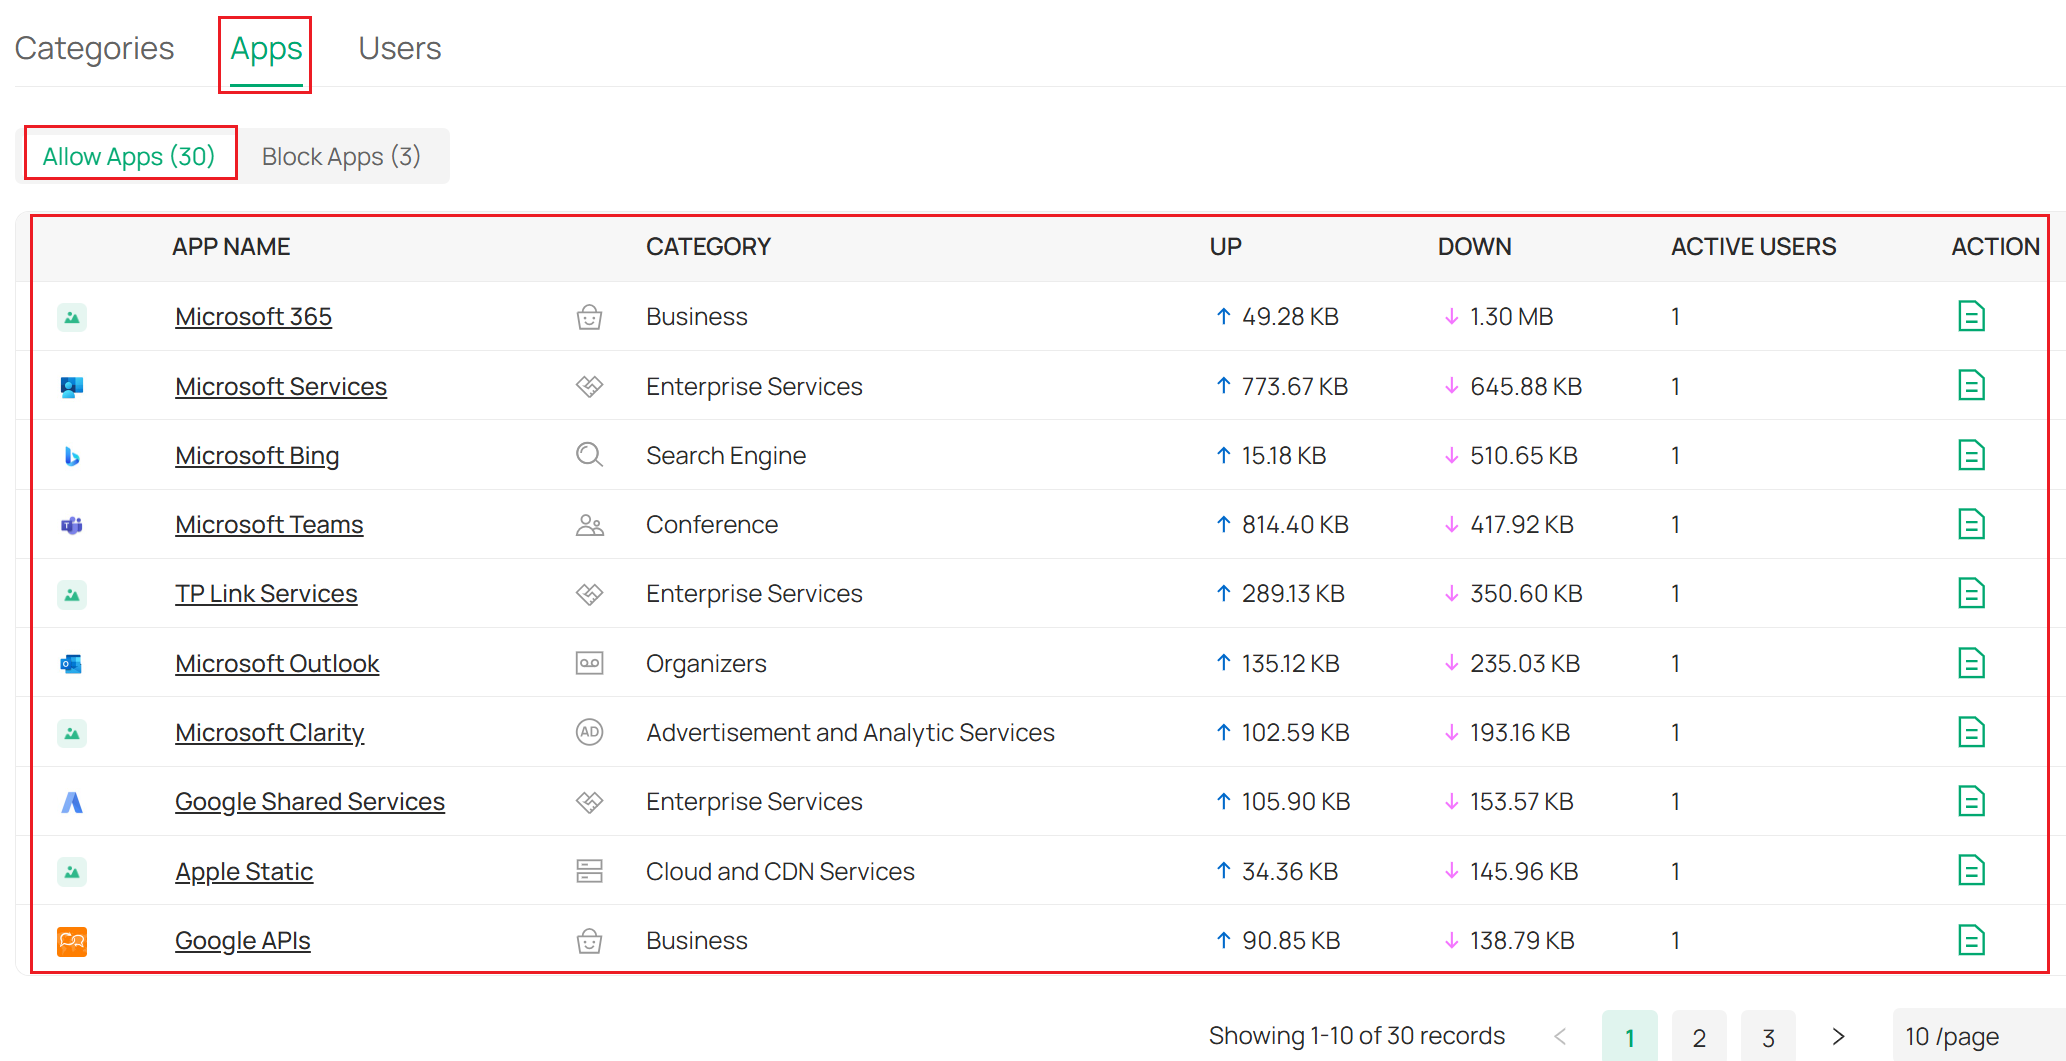
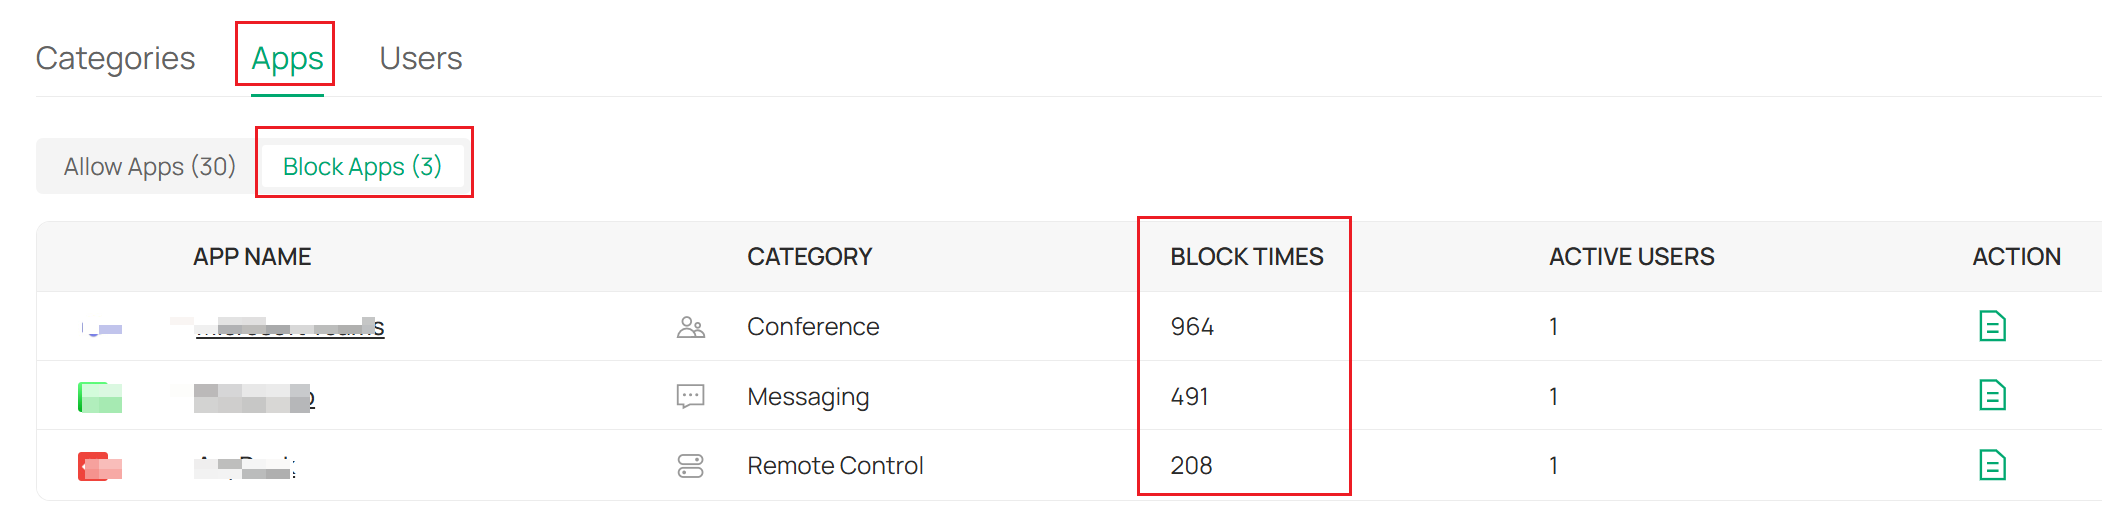
Note: The Block Apps data only includes applications for which Deny rules are configured in DPI. For applications with Deny rules configured in DPI, due to possible traffic leakage, records of these denied applications may also appear in Allow Apps. This is a normal phenomenon.
- The User section provides traffic statistics for all the connected clients in the network.
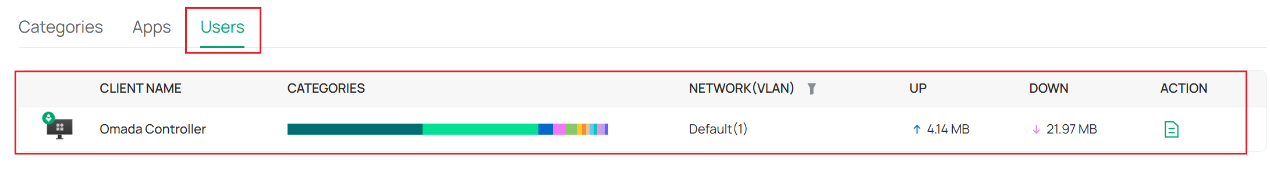
Note: If you use a hardware controller such as OC200, OC220, OC300, ER7212PC, or C5300 to configure the DPI function, the User module will not appear on the controller interface due to hardware limitations.
Conclusion
Now you have configured DPI on the Omada Gateway and can view the traffic statistics of different applications and clients on the network.
Get to know more details of each function and configuration please go to Download Center to download the manual of your product.
QA
Q1: Why does Application Analytics fail to display any traffic statistics even though I have configured DPI?
A1: Ensure that DPI and Logging Traffic is enabled on the gateway and make sure that you are accessing the applications through the gateway. Generally, it takes around 5 minutes for the application traffic statistics to be reported to the Controller. Please note that if you use a local Controller (i.e. Software/Hardware Controller), the DPI application traffic is reported to the Controller through a specific port (TCP port 29815). In this case, check your local firewall policy to ensure that this port is not being blocked.
Recent updates may have expanded access to feature(s) discussed in this FAQ. Visit your product's support page, select the correct hardware version for your device, and check either the Datasheet or the firmware section for the latest improvements added to your product. Please note that product availability varies by region, and certain models may not be available in your region.
